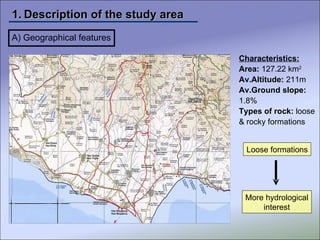
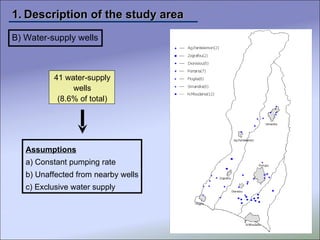
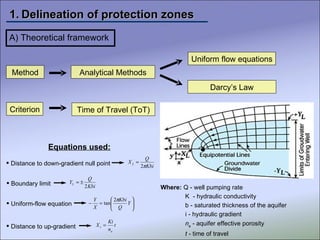
ESTABLISHING COST-EFFECTIVE WELLHEAD PROTECTION  ZONES TO CONTROL NITRATE POLLUTION FROM AGRICULTURE ACTIVITIES   Aristotle University of Thessaloniki 12th International  Conference  on Environmental  Science and Technology 8 - 10 September 2011 Rhodes island, Greece  I. SIARKOS M. KATIRTZIDOU  D. LATINOPOULOS
Groundwater  Aquifers in a state of exhaustion   Pollution   because of  human activities  Difficult and slow diagnosis of pollution Two-stage methodological approach  Introduction Measures Determination of protection zones Identification of potential pollution sources + Set of alternative scenarios Less expensive policy/cost-effective control + Major freshwater resource
Location: Hydrological basin of N.Moudania  Northern Greece Prefecture of Halkidiki Description of the study area Moudania Basin Agricultural activities + Intensive irrigation Α)  Geographical features
Characteristics: Area:  127.22 km 2 Av.Altitude:  211m Av.Ground slope:  1.8% Types of rock:  loose & rocky formations Description of the study area Loose formations More hydrological interest Α)  Geographical features
Assumptions a )  Constant pumping rate b )  Unaffected from nearby wells c )  Exclusive water supply 41  water-supply wells (8 .6 %  of total ) Description of the study area B )  Water-supply wells
Description of the study area C )  Agricultural activities
Equations used: Distance to down-gradient null point Boundary limit Uniform-flow equation Distance to  up -gradient Where:  Q - well pumping rate K  - hydraulic conductivity b - saturated thickness of the aquifer  i - hydraulic gradient n e  - aquifer effective porosity  t  - time of travel  Delineation of protection zones Method Analytical Methods Uniform flow equations Darcy’s Law Criterion Time of Travel (ToT) A )  Theoretical framework
Zone I:  50 days (direct protection zone) Zone II:  2 years (considerable level  of protection) Zone III:  5 years (less  considerable level  of protection ) Zone IV:  12 years (sufficient level of  protection) Delineation of protection zones “ Time of Travel” limits Categories of protection zones Level of  protection A )  Theoretical framework
Delineation of Zone II Delineation of protection zones Agricultural pollution Diffuse source of pollution Inside this protection zone the use of both  pesticides  and  chemical   fertilizers   is prohibited A )  Theoretical framework
Delineation of protection zones W8  ( C ΝΟ3-   = 80  mg / l ) W23  ( C ΝΟ3-  = 107  mg / l ) W40  ( C ΝΟ3-  =  81.5 mg / l ) Drinking water standards (50mg/l) (Council Directive 91/676/EEC) Wells selected Effect of cropping patterns Concentration of nitrates   Selection  criteria a)  Main crop type  in the land parcels around the well b) Results of  chemical analyses  of water samples B )  Well selection
Delineation of protection zones Well Area of zone II (m 2 ) Perimeter of zone II (m) W 8 58 , 690 1,059 W 23 15,150 477.3 W 40 45,690 909.2 C) Drawing of protection zones
Economical analysis Rely mainly on financial indicators & voluntary participation of farmers   A) Alternative scenarios A. Expropriation  of land parcels & changes in land use zoning B. Set aside  (hold out of production) or  pumping restrictions  & farmers compensation C. Changes  in water irrigation technology D.  Cropping pattern changes in order to  reduce fertilizer  consumption E.  Adoption of  organic farming  (non-use of nitrogen fertilizer) Regulated by local authorities  Enforced to farmers   Relatively straightforward computational approaches
Economical analysis 1 st  step Identify initial cropping patterns Using GIS  Visiting the area around the wells B) Cropping patterns  Five  main crops Olive trees  Apricot trees Wheat  Alfalfa  Greenhouse vegetables
Well W8   Glasshouse vegetables (white colour) Alfalfa (green colour)  Olive trees (yellow colour) W8 Economical analysis Protection Zone II   B) Cropping patterns (W8)
Well W8   Glasshouse vegetables (white colour) Alfalfa (green colour)  Olive trees (yellow colour) W8 Economical analysis Protection Zone II   High  implementation costs Environmentally – friendly irrigation method ( drip  irrigation) B) Cropping patterns (W8)
Well W8   Glasshouse vegetables (white colour) Alfalfa (green colour)  Olive trees (yellow colour) W8 Economical analysis No-nitrogen fertilizer application Protection Zone II   B) Cropping patterns (W8)
Economical analysis Well W23   Wheat (gold colour) W23 Low-income Annual Non-irrigated Protection Zone II   B) Cropping patterns (W23)
Economical analysis Well W40   Olive trees (yellow colour) Apricot trees (green colour)  W40 High-income Multiannual Irrigated Protection Zone II   B) Cropping patterns (W40)
Economical analysis Scenario A Scenario B Scenario B1 Scenario B2 Compulsory purchase of agricultural land ( expropriation  of all parcels cultivated with  olive trees, apricot trees and wheat ) Pumping restrictions  to restrict the use of irrigation water in  olive and apricot trees   Set aside  for  wheat  production  C) Finally selected scenarios
(€/ha)   Economical analysis Aim Cost  of compulsory  purchase  ( CP ) Eliminating the use of  fertilizers   Expropriation  &  compensation  to farmers   Current  value of agricultural land  Objective  (assessed) value   - ILV F : initial land value factor (Ministry of Finance) -  assessed value  of a non-irrigated, annual parcel of land  - R F : main cultivation factor - effect of  various annual or multiannual  crops on land values  - I F : irrigation water factor - effect of  irrigated or non-irrigated land  on their objective values  D) Cost estimates (Scenario A)
Compulsory purchase cost around the selected boreholes (total cost in Zone II) Highest cost per hectare  in W23 due to its close proximity to the settlement boundary  Economical analysis Highest total cost  in W40 because there is a greater agricultural area that should be expropriated Well ID number Cultivated Crop Cost of compulsory purchase  (€/ha) Total area  ( ha ) Total cost of Scenario A (€) W 8 Olive trees 45,360 2 . 05 1 9 3 . 033 W 23 Wheat 80,000 1 . 15 9 92 . 704 W 40 Olive trees 45 ,360 3 . 81 3 19 9 . 914 Apricot trees 5 1,840 0. 5 20 D) Cost estimates (Scenario A)
Regional agro-economic indicators Fertilizers Pesticides Water use Market cost Labor costs Crop yields  Crop prices Gross margin for irrigated and non-irrigated olive and apricot trees Economical analysis Objective Implementation cost Minimize the  nitrate  pollution  Pumping restrictions   &  compensation  to farmers   Difference  in  gross margin  between  irrigated and dry farming  conditions  Compensation  to farmers due to  income losses Costs Annual income loss   (dry farming conditions) Olive trees  €915/ha Apricot trees €3306/ha E) Cost estimates (Scenario B1)
Only applied to wheat cultivation  (low income, annual, non irrigated crop)   Economical analysis Objective Implementation cost Minimize the  nitrate  pollution  Set aside  &  compensation to farmers   Total income losses  of farmers Abandon their business for a number of years B2 scenario cost > B1 scenario cost Annual income loss   (set aside policy) Wheat € 235.6/ha   F) Cost estimates (Scenario B2)
Discount future implementation costs to a present value Economical analysis Scenario A  form of a lump sum payment Scenario B  form of “annual costs”  Future annual costs of wellhead protection zones (Ct) for a given time horizon T (T>0) discounted at the discount rate r Time periods  (T= 20, 30 and 40 years) - impact of time horizon on the expected total costs Discount rates  (r = 2% and 4%) - sensitivity of our findings to the choice of discount rate G) Cost estimates (Scenario B) Present value (PV)
Implementation cost of pumping restrictions and set aside  ( total cost in Zone II )  Economical analysis r   Well ID Number Cultivated crop Area  ( ha ) Implementation cost  (€/ha) according to the time period Total implementation cost in  Zone II (€) 20  years 3 0  years 4 0  years 20  years 3 0  years 4 0  years Scenario B 1 :  Pumping restrictions in W 8  and W 40 2% W 8 Olive trees 2 . 05 1 15 , 0 00 20 , 5 00 36 , 6 00 30 , 668 42 , 006 75 , 023 W 40 Olive trees 3 . 81 3 15 ,00 0 20 , 5 00 36 ,600 85 , 108 116 , 572 186 , 47 5 Apricot trees 0.520 54 , 1 00 74 ,00 0 90 , 4 00 4% W 8 Olive trees 2 . 05 1 12 , 4 00 15 , 8 00 18 , 1 00 25 , 489 32 , 432 37 , 12 3 W 40 Olive trees 3 . 81 3 12 , 4 00 15 , 8 00 18 , 1 00 70 , 737 90 , 004 103 , 020 Apricot trees 0.520 44 , 9 00 57 , 2 00 65 , 4 00   Scenario B 2 :  Set aside policy in W 23 2% W 23 Wheat 1 . 15 9 3 , 9 00 5 , 3 00 6 , 4 00 4 , 464 6 , 114 7 , 468 4% W 23 Wheat 1 . 15 9 3,21 0 4 , 1 00 4 , 7 00 3 , 7 20 4 , 721 5 , 40 4 G) Cost estimates (Scenario B)
Conclusions Well W23 Scenario A Scenario B r   Well ID Number Cultivated crop Area  ( ha ) Total implementation cost in Zone II (€) 20  years 3 0  years 4 0  years 2% W 8 Olive trees 2 . 05 1 30 , 668 42 , 006 75 , 023 W 40 Olive trees 3 . 81 3 85 , 108 116 , 572 186 , 47 5 Apricot trees 0.520 4% W 8 Olive trees 2 . 05 1 25 , 489 32 , 432 37 , 12 3 W 40 Olive trees 3 . 81 3 70 , 737 90 , 004 103 , 020 Apricot trees 0.520 2% W 23 Wheat 1 . 15 9 4 , 464 6 , 114 7 , 468 4% W 23 Wheat 1 . 15 9 3 , 7 20 4 , 721 5 , 40 4 Well ID number Cultivated Crop Total area  ( ha ) Total cost of Scenario A (€) W 8 Olive trees 2 . 05 1 9 3 . 033 W 23 Wheat 1 . 15 9 92 . 704 W 40 Olive trees 3 . 81 3 19 9 . 914 Apricot trees 0. 5 20 Area with  low income agriculture  (wheat production) but with  high value of land   Set aside policy  is by far  the most cost effective measure  in  W23
Conclusions Wells W8 & W40 Pumping restrictions  seems to be the most economically advantageous in  W8 & W40   Scenario A Scenario B r   Well ID Number Cultivated crop Area  ( ha ) Total implementation cost in Zone II (€) 20  years 3 0  years 4 0  years 2% W 8 Olive trees 2 . 05 1 30 , 668 42 , 006 75 , 023 W 40 Olive trees 3 . 81 3 Apricot trees 0.520 85 , 108 116 , 572 186 , 47 5 4% W 8 Olive trees 2 . 05 1 25 , 489 32 , 432 37 , 12 3 W 40 Olive trees 3 . 81 3 Apricot trees 0.520 70 , 737 90 , 004 103 , 020 2% W 23 Wheat 1 . 15 9 4 , 464 6 , 114 7 , 468 4% W 23 Wheat 1 . 15 9 3 , 7 20 4 , 721 5 , 40 4 Well ID number Cultivated Crop Total area  ( ha ) Total cost of Scenario A (€) W 8 Olive trees 2 . 05 1 9 3 . 033 W 23 Wheat 1 . 15 9 92 . 704 W 40 Olive trees 3 . 81 3 19 9 . 914 Apricot trees 0. 5 20 Low discount rates  and  long time horizon  make the choice more difficult The decision maker may choose  Scenario A  because  expropriation  is  more effective  method in groundwater protection
Implementation cost depends on several parameters (area of protection zones, current cropping patterns and the land values) Not always an easy task Determined by many factors Conclusions Objectives of this study Exploration of all alternative scenarios Protect water supply wells from pollution Economic valuation of some of these scenarios Necessary  further research  focusing on a  decision-making methodology Choosing the best scenario
“ When you drink the water, remember the spring”

Wellhead protection zones

  • 1.
    ESTABLISHING COST-EFFECTIVE WELLHEADPROTECTION ZONES TO CONTROL NITRATE POLLUTION FROM AGRICULTURE ACTIVITIES Aristotle University of Thessaloniki 12th International Conference on Environmental Science and Technology 8 - 10 September 2011 Rhodes island, Greece I. SIARKOS M. KATIRTZIDOU D. LATINOPOULOS
  • 2.
    Groundwater Aquifersin a state of exhaustion Pollution because of human activities Difficult and slow diagnosis of pollution Two-stage methodological approach Introduction Measures Determination of protection zones Identification of potential pollution sources + Set of alternative scenarios Less expensive policy/cost-effective control + Major freshwater resource
  • 3.
    Location: Hydrological basinof N.Moudania Northern Greece Prefecture of Halkidiki Description of the study area Moudania Basin Agricultural activities + Intensive irrigation Α) Geographical features
  • 4.
    Characteristics: Area: 127.22 km 2 Av.Altitude: 211m Av.Ground slope: 1.8% Types of rock: loose & rocky formations Description of the study area Loose formations More hydrological interest Α) Geographical features
  • 5.
    Assumptions a ) Constant pumping rate b ) Unaffected from nearby wells c ) Exclusive water supply 41 water-supply wells (8 .6 % of total ) Description of the study area B ) Water-supply wells
  • 6.
    Description of thestudy area C ) Agricultural activities
  • 7.
    Equations used: Distanceto down-gradient null point Boundary limit Uniform-flow equation Distance to up -gradient Where: Q - well pumping rate K - hydraulic conductivity b - saturated thickness of the aquifer i - hydraulic gradient n e - aquifer effective porosity t - time of travel Delineation of protection zones Method Analytical Methods Uniform flow equations Darcy’s Law Criterion Time of Travel (ToT) A ) Theoretical framework
  • 8.
    Zone I: 50 days (direct protection zone) Zone II: 2 years (considerable level of protection) Zone III: 5 years (less considerable level of protection ) Zone IV: 12 years (sufficient level of protection) Delineation of protection zones “ Time of Travel” limits Categories of protection zones Level of protection A ) Theoretical framework
  • 9.
    Delineation of ZoneII Delineation of protection zones Agricultural pollution Diffuse source of pollution Inside this protection zone the use of both pesticides and chemical fertilizers is prohibited A ) Theoretical framework
  • 10.
    Delineation of protectionzones W8 ( C ΝΟ3- = 80 mg / l ) W23 ( C ΝΟ3- = 107 mg / l ) W40 ( C ΝΟ3- = 81.5 mg / l ) Drinking water standards (50mg/l) (Council Directive 91/676/EEC) Wells selected Effect of cropping patterns Concentration of nitrates Selection criteria a) Main crop type in the land parcels around the well b) Results of chemical analyses of water samples B ) Well selection
  • 11.
    Delineation of protectionzones Well Area of zone II (m 2 ) Perimeter of zone II (m) W 8 58 , 690 1,059 W 23 15,150 477.3 W 40 45,690 909.2 C) Drawing of protection zones
  • 12.
    Economical analysis Relymainly on financial indicators & voluntary participation of farmers A) Alternative scenarios A. Expropriation of land parcels & changes in land use zoning B. Set aside (hold out of production) or pumping restrictions & farmers compensation C. Changes in water irrigation technology D. Cropping pattern changes in order to reduce fertilizer consumption E. Adoption of organic farming (non-use of nitrogen fertilizer) Regulated by local authorities Enforced to farmers Relatively straightforward computational approaches
  • 13.
    Economical analysis 1st step Identify initial cropping patterns Using GIS Visiting the area around the wells B) Cropping patterns Five main crops Olive trees Apricot trees Wheat Alfalfa Greenhouse vegetables
  • 14.
    Well W8 Glasshouse vegetables (white colour) Alfalfa (green colour) Olive trees (yellow colour) W8 Economical analysis Protection Zone II B) Cropping patterns (W8)
  • 15.
    Well W8 Glasshouse vegetables (white colour) Alfalfa (green colour) Olive trees (yellow colour) W8 Economical analysis Protection Zone II High implementation costs Environmentally – friendly irrigation method ( drip irrigation) B) Cropping patterns (W8)
  • 16.
    Well W8 Glasshouse vegetables (white colour) Alfalfa (green colour) Olive trees (yellow colour) W8 Economical analysis No-nitrogen fertilizer application Protection Zone II B) Cropping patterns (W8)
  • 17.
    Economical analysis WellW23 Wheat (gold colour) W23 Low-income Annual Non-irrigated Protection Zone II B) Cropping patterns (W23)
  • 18.
    Economical analysis WellW40 Olive trees (yellow colour) Apricot trees (green colour) W40 High-income Multiannual Irrigated Protection Zone II B) Cropping patterns (W40)
  • 19.
    Economical analysis ScenarioA Scenario B Scenario B1 Scenario B2 Compulsory purchase of agricultural land ( expropriation of all parcels cultivated with olive trees, apricot trees and wheat ) Pumping restrictions to restrict the use of irrigation water in olive and apricot trees Set aside for wheat production C) Finally selected scenarios
  • 20.
    (€/ha) Economical analysis Aim Cost of compulsory purchase ( CP ) Eliminating the use of fertilizers Expropriation & compensation to farmers Current value of agricultural land Objective (assessed) value - ILV F : initial land value factor (Ministry of Finance) - assessed value of a non-irrigated, annual parcel of land - R F : main cultivation factor - effect of various annual or multiannual crops on land values - I F : irrigation water factor - effect of irrigated or non-irrigated land on their objective values D) Cost estimates (Scenario A)
  • 21.
    Compulsory purchase costaround the selected boreholes (total cost in Zone II) Highest cost per hectare in W23 due to its close proximity to the settlement boundary Economical analysis Highest total cost in W40 because there is a greater agricultural area that should be expropriated Well ID number Cultivated Crop Cost of compulsory purchase (€/ha) Total area ( ha ) Total cost of Scenario A (€) W 8 Olive trees 45,360 2 . 05 1 9 3 . 033 W 23 Wheat 80,000 1 . 15 9 92 . 704 W 40 Olive trees 45 ,360 3 . 81 3 19 9 . 914 Apricot trees 5 1,840 0. 5 20 D) Cost estimates (Scenario A)
  • 22.
    Regional agro-economic indicatorsFertilizers Pesticides Water use Market cost Labor costs Crop yields Crop prices Gross margin for irrigated and non-irrigated olive and apricot trees Economical analysis Objective Implementation cost Minimize the nitrate pollution Pumping restrictions & compensation to farmers Difference in gross margin between irrigated and dry farming conditions Compensation to farmers due to income losses Costs Annual income loss (dry farming conditions) Olive trees €915/ha Apricot trees €3306/ha E) Cost estimates (Scenario B1)
  • 23.
    Only applied towheat cultivation (low income, annual, non irrigated crop) Economical analysis Objective Implementation cost Minimize the nitrate pollution Set aside & compensation to farmers Total income losses of farmers Abandon their business for a number of years B2 scenario cost > B1 scenario cost Annual income loss (set aside policy) Wheat € 235.6/ha F) Cost estimates (Scenario B2)
  • 24.
    Discount future implementationcosts to a present value Economical analysis Scenario A form of a lump sum payment Scenario B form of “annual costs” Future annual costs of wellhead protection zones (Ct) for a given time horizon T (T>0) discounted at the discount rate r Time periods (T= 20, 30 and 40 years) - impact of time horizon on the expected total costs Discount rates (r = 2% and 4%) - sensitivity of our findings to the choice of discount rate G) Cost estimates (Scenario B) Present value (PV)
  • 25.
    Implementation cost ofpumping restrictions and set aside ( total cost in Zone II ) Economical analysis r Well ID Number Cultivated crop Area ( ha ) Implementation cost (€/ha) according to the time period Total implementation cost in Zone II (€) 20 years 3 0 years 4 0 years 20 years 3 0 years 4 0 years Scenario B 1 : Pumping restrictions in W 8 and W 40 2% W 8 Olive trees 2 . 05 1 15 , 0 00 20 , 5 00 36 , 6 00 30 , 668 42 , 006 75 , 023 W 40 Olive trees 3 . 81 3 15 ,00 0 20 , 5 00 36 ,600 85 , 108 116 , 572 186 , 47 5 Apricot trees 0.520 54 , 1 00 74 ,00 0 90 , 4 00 4% W 8 Olive trees 2 . 05 1 12 , 4 00 15 , 8 00 18 , 1 00 25 , 489 32 , 432 37 , 12 3 W 40 Olive trees 3 . 81 3 12 , 4 00 15 , 8 00 18 , 1 00 70 , 737 90 , 004 103 , 020 Apricot trees 0.520 44 , 9 00 57 , 2 00 65 , 4 00   Scenario B 2 : Set aside policy in W 23 2% W 23 Wheat 1 . 15 9 3 , 9 00 5 , 3 00 6 , 4 00 4 , 464 6 , 114 7 , 468 4% W 23 Wheat 1 . 15 9 3,21 0 4 , 1 00 4 , 7 00 3 , 7 20 4 , 721 5 , 40 4 G) Cost estimates (Scenario B)
  • 26.
    Conclusions Well W23Scenario A Scenario B r Well ID Number Cultivated crop Area ( ha ) Total implementation cost in Zone II (€) 20 years 3 0 years 4 0 years 2% W 8 Olive trees 2 . 05 1 30 , 668 42 , 006 75 , 023 W 40 Olive trees 3 . 81 3 85 , 108 116 , 572 186 , 47 5 Apricot trees 0.520 4% W 8 Olive trees 2 . 05 1 25 , 489 32 , 432 37 , 12 3 W 40 Olive trees 3 . 81 3 70 , 737 90 , 004 103 , 020 Apricot trees 0.520 2% W 23 Wheat 1 . 15 9 4 , 464 6 , 114 7 , 468 4% W 23 Wheat 1 . 15 9 3 , 7 20 4 , 721 5 , 40 4 Well ID number Cultivated Crop Total area ( ha ) Total cost of Scenario A (€) W 8 Olive trees 2 . 05 1 9 3 . 033 W 23 Wheat 1 . 15 9 92 . 704 W 40 Olive trees 3 . 81 3 19 9 . 914 Apricot trees 0. 5 20 Area with low income agriculture (wheat production) but with high value of land Set aside policy is by far the most cost effective measure in W23
  • 27.
    Conclusions Wells W8& W40 Pumping restrictions seems to be the most economically advantageous in W8 & W40 Scenario A Scenario B r Well ID Number Cultivated crop Area ( ha ) Total implementation cost in Zone II (€) 20 years 3 0 years 4 0 years 2% W 8 Olive trees 2 . 05 1 30 , 668 42 , 006 75 , 023 W 40 Olive trees 3 . 81 3 Apricot trees 0.520 85 , 108 116 , 572 186 , 47 5 4% W 8 Olive trees 2 . 05 1 25 , 489 32 , 432 37 , 12 3 W 40 Olive trees 3 . 81 3 Apricot trees 0.520 70 , 737 90 , 004 103 , 020 2% W 23 Wheat 1 . 15 9 4 , 464 6 , 114 7 , 468 4% W 23 Wheat 1 . 15 9 3 , 7 20 4 , 721 5 , 40 4 Well ID number Cultivated Crop Total area ( ha ) Total cost of Scenario A (€) W 8 Olive trees 2 . 05 1 9 3 . 033 W 23 Wheat 1 . 15 9 92 . 704 W 40 Olive trees 3 . 81 3 19 9 . 914 Apricot trees 0. 5 20 Low discount rates and long time horizon make the choice more difficult The decision maker may choose Scenario A because expropriation is more effective method in groundwater protection
  • 28.
    Implementation cost dependson several parameters (area of protection zones, current cropping patterns and the land values) Not always an easy task Determined by many factors Conclusions Objectives of this study Exploration of all alternative scenarios Protect water supply wells from pollution Economic valuation of some of these scenarios Necessary further research focusing on a decision-making methodology Choosing the best scenario
  • 29.
    “ When youdrink the water, remember the spring”