Axis Direct presents daily derivatives report presenting recommendations based on technical analysis. For trading in derivatives visit https://simplehai.axisdirect.in/offerings/products/derivatives
https://simplehai.axisdirect.in/share-stock-prices/nse/Cipla-Ltd-114
https://simplehai.axisdirect.in/share-stock-prices/nse/ICICI-Bank-Ltd-5418
https://simplehai.axisdirect.in/share-stock-prices/nse/Oil-&-Natural-Gas-Corpn-Ltd-6068
https://simplehai.axisdirect.in/share-stock-prices/nse/Ashok-Leyland-Ltd-31
https://simplehai.axisdirect.in/share-stock-prices/nse/Bharat-Petroleum-Corporation-Ltd-2290
https://simplehai.axisdirect.in/share-stock-prices/nse/Lupin-Ltd-3026
https://simplehai.axisdirect.in/share-stock-prices/nse/Aurobindo-Pharma-Ltd-4666
Weekly Technical Report :29 October 2018Axis Direct
Axis Direct presents daily derivatives report presenting recommendations based on technical analysis. For trading in derivatives visit https://simplehai.axisdirect.in/offerings/products/derivatives
Nifty closed the previous week at 10195, down 32 points. On the weekly chart, Nifty has formed a bearish candle with a long upper shadow, indicating selling pressure at higher levels. It has closed below its one year up-sloping trend line support of 10280 for the second consecutive week, signaling weak sentiment. The index is in a lower top and lower bottom formation, indicating a sustained downtrend. The key support level to watch is 10161. If Nifty breaks below 10140, it could fall to 10050-9950, but a break above 10350 could see a rise to 10430-10480.
Daily Technical Report:12 December 2017Axis Direct
Axis Direct presents daily derivatives report presenting recommendations based on technical analysis. For trading in derivatives visit https://simplehai.axisdirect.in/offerings/products/derivatives
The document provides a technical analysis and overview of currency movements for the USDINR, EURINR, GBPINR, JPYINR for September 16th, 2014. It analyzes trends and indicators including prices breaking above or below levels, movements of the 50 EMA, MACD giving bullish or bearish crossovers, RSI and stochastic indicators moving above or below mid-range levels, and ADX moving above or below trend levels. It also lists upcoming economic indicators and forecasts their potential impact on currencies.
Axis Direct presents daily derivatives report presenting recommendations based on technical analysis. For trading in derivatives visit https://simplehai.axisdirect.in/offerings/products/derivatives
https://simplehai.axisdirect.in/share-stock-prices/nse/Cipla-Ltd-114
https://simplehai.axisdirect.in/share-stock-prices/nse/ICICI-Bank-Ltd-5418
https://simplehai.axisdirect.in/share-stock-prices/nse/Oil-&-Natural-Gas-Corpn-Ltd-6068
https://simplehai.axisdirect.in/share-stock-prices/nse/Ashok-Leyland-Ltd-31
https://simplehai.axisdirect.in/share-stock-prices/nse/Bharat-Petroleum-Corporation-Ltd-2290
https://simplehai.axisdirect.in/share-stock-prices/nse/Lupin-Ltd-3026
https://simplehai.axisdirect.in/share-stock-prices/nse/Aurobindo-Pharma-Ltd-4666
Weekly Technical Report :29 October 2018Axis Direct
Axis Direct presents daily derivatives report presenting recommendations based on technical analysis. For trading in derivatives visit https://simplehai.axisdirect.in/offerings/products/derivatives
Nifty closed the previous week at 10195, down 32 points. On the weekly chart, Nifty has formed a bearish candle with a long upper shadow, indicating selling pressure at higher levels. It has closed below its one year up-sloping trend line support of 10280 for the second consecutive week, signaling weak sentiment. The index is in a lower top and lower bottom formation, indicating a sustained downtrend. The key support level to watch is 10161. If Nifty breaks below 10140, it could fall to 10050-9950, but a break above 10350 could see a rise to 10430-10480.
Daily Technical Report:12 December 2017Axis Direct
Axis Direct presents daily derivatives report presenting recommendations based on technical analysis. For trading in derivatives visit https://simplehai.axisdirect.in/offerings/products/derivatives
The document provides a technical analysis and overview of currency movements for the USDINR, EURINR, GBPINR, JPYINR for September 16th, 2014. It analyzes trends and indicators including prices breaking above or below levels, movements of the 50 EMA, MACD giving bullish or bearish crossovers, RSI and stochastic indicators moving above or below mid-range levels, and ADX moving above or below trend levels. It also lists upcoming economic indicators and forecasts their potential impact on currencies.
The document discusses the technical analysis of the Indian equity markets and argues that the markets are currently in a bullish ascending triangle pattern. It notes that the Nifty has formed a 5-year ascending triangle and is nearing a breakout point that could lead to explosive moves upwards. Global markets are also experiencing bullish breakouts from long-term patterns. The analysis concludes that the markets are at a critical support level and recommends a bullish investing strategy of buying on dips in anticipation of an upwards breakout in the coming months.
Daily Technical Report:07 February 2019Axis Direct
Axis Direct presents daily derivatives report presenting recommendations based on technical analysis. For trading in derivatives visit https://simplehai.axisdirect.in/offerings/products/derivatives
https://simplehai.axisdirect.in/share-stock-prices/nse/ICICI-Bank-Ltd-5418
https://simplehai.axisdirect.in/share-stock-prices/nse/Asian-Paints-Ltd-34
https://simplehai.axisdirect.in/share-stock-prices/nse/Bharat-Petroleum-Corporation-Ltd-2290
BourseIndia is a Stock Advisory company, which provide you accurate Equity Market Tips. We are here to provide tips for Stock Cash, Equity Market Tips, Stock Futures and traded in both NSE and BSE. These tips will be profitable and will help to get better profit in Stock market financial services
There are 3 entry level of fibonacci retracement. In this pdf ebook will tell you the 3 entry level. Stop loss, and your target profits.
This entry level is also suitable for beginners.
The document provides analysis of the Indian stock market and makes predictions based on technical indicators. It summarizes that:
1) The Sensex and Nifty indexes tend to form important short-term bottoms when the RSI indicator reaches oversold levels between 35-45.
2) India's VIX volatility index similarly indicates market bottoms when rising to between 30-40, as major post-2010 bottoms have occurred in this range.
3) A dollar-denominated index of the Sensex testing previous election breakout levels suggests the potential for a sharp rally in Indian stocks in the coming months if this support holds.
- The document discusses Fibonacci retracements, which are horizontal support and resistance levels placed at key Fibonacci ratios (23.6%, 38.2%, 61.8%, 76.4%) of the vertical distance between a trend's extreme high and low points. These levels are based on the Fibonacci sequence discovered by Leonardo Fibonacci, where dividing successive numbers results in the golden ratio of 1.618. Fibonacci retracements are widely followed in financial markets as areas where a trend may reverse direction before continuing in its original course.
- The document discusses the trading experience of a group of 17 people using a stock market simulator over several months. They learned about risk analysis, sector performance, different trading types (commodities, stocks, futures), and tools like stop losses and limits.
- Their strategy was diversified, with 50% in safe commodity stocks, 25% in higher risk short selling, 18% in future stocks, and 12% in experiments like mutual funds. Two members analyzed data daily and the others rotated providing recommendations.
- Their Indian market analysis found it moves extremely in bull and bear cycles with interlinked sectors, so one sector declining can impact others.
Axis Direct presents daily derivatives report presenting recommendations based on technical analysis. For trading in derivatives visit https://simplehai.axisdirect.in/offerings/products/derivatives
The Nifty index gained 391 points over the week, closing at 11427. It broke out of its five-month consolidation range between 11100-10600, indicating strength. If the Nifty sustains above 11500, it could rise to 11600-11700 levels, but a break below 11380 could trigger profit taking down to 11330-11250. Technical indicators are positive and the index is expected to trade between 11600-11300 levels for the week with an upward bias.
Weekly Technical Report :03 September 2018Axis Direct
The document provides a technical analysis of the Indian stock market indexes Nifty and Sensex. It notes that Nifty closed the week higher by 124 points, forming a bullish candle on the weekly chart. It is currently in an uptrend, trading above short-term moving averages. The analysis expects Nifty to trade in the 11500-11800 range for the week with a mixed bias. It identifies several stocks to focus on for potential long and short intraday trades.
Nifty closed at 11713, up 44 points from the previous day. The index has formed an upward bullish candle and is in an uptrend according to technical indicators. If Nifty sustains above 11750, it could rise to 11780-11800, but a break below 11650 may lead to a decline to 11620-11600. Stocks like HDFC and M&M are recommended as buy opportunities.
Axis Direct presents daily derivatives report presenting recommendations based on technical analysis. For trading in derivatives visit https://simplehai.axisdirect.in/offerings/products/derivatives
https://simplehai.axisdirect.in/share-stock-prices/nse/Tech-Mahindra-Ltd-17215
https://simplehai.axisdirect.in/share-stock-prices/nse/Sun-Pharmaceuticals-Industries-Ltd-4325
Nifty opened higher but saw most gains erased later in the day, closing near the lows with a loss of 119 points. On the daily chart, Nifty has formed a bearish candle but maintained a higher high-low range, indicating ongoing short-term positive bias within a long-term uptrend. Key support levels are at 11650 and 11550, while resistance is at 11750 and 11850. Technical indicators remain positive in the short to medium term, suggesting buying on dips continues to be the strategy.
The Nifty index opened flat but gained momentum late in the day, closing up 12 points near its daily high. On the daily chart, Nifty has formed a bullish candle with lower shadows, indicating buying at lower levels. It has found support at its 20-day simple moving average. The index is trading between 11700-11550 and a break above 11630 could lead it toward 11680-11700, while a break below 11550 risks a fall to 11500-11470. Technical indicators point to continued short to medium term strength in the index.
Axis Direct presents daily derivatives report presenting recommendations based on technical analysis. For trading in derivatives visit https://simplehai.axisdirect.in/offerings/products/derivatives
https://simplehai.axisdirect.in/share-stock-prices/nse/Adani-Power-Ltd-17808
https://simplehai.axisdirect.in/share-stock-prices/nse/Delta-Corp-Ltd-17211
Axis Direct presents daily derivatives report presenting recommendations based on technical analysis. For trading in derivatives visit https://simplehai.axisdirect.in/offerings/products/derivatives
https://simplehai.axisdirect.in/share-stock-prices/nse/Coal-India-Ltd-12019
https://simplehai.axisdirect.in/share-stock-prices/nse/DLF-Ltd-6890
Axis Direct presents daily derivatives report presenting recommendations based on technical analysis. For trading in derivatives visit https://simplehai.axisdirect.in/offerings/products/derivatives
Weekly Technical Report :13 August 2018Axis Direct
Axis Direct presents daily derivatives report presenting recommendations based on technical analysis. For trading in derivatives visit https://simplehai.axisdirect.in/offerings/products/derivatives
https://simplehai.axisdirect.in/share-stock-prices/nse/Bharat-Petroleum-Corporation-Ltd-2290
https://simplehai.axisdirect.in/share-stock-prices/nse/Sun-Pharmaceuticals-Industries-Ltd-4325
https://simplehai.axisdirect.in/share-stock-prices/nse/Tata-Motors-Ltd-560
Axis Direct presents daily derivatives report presenting recommendations based on technical analysis. For trading in derivatives visit https://simplehai.axisdirect.in/offerings/products/derivatives
Similar to Weekly Technical Report :27 May 2019 (20)
Axis Direct presents daily derivatives report presenting recommendations based on technical analysis. For trading in derivatives visit https://simplehai.axisdirect.in/offerings/products/derivatives
- Nifty futures closed at 8651.4 on March 30th, down 3.85% with a decrease in open interest indicating short covering. BankNifty closed higher at 19779 with an 18.51% rise in open interest showing long buildup.
- India VIX index is at 70.58. Nifty put and call option IVs are quoting at 70.3 and 63.53 respectively.
- ASIANPAINT, BANDHANBNK, NAUKRI and RELIANCE saw long buildup while HDFCLIFE, KOTAKBANK, GAIL and M&MFIN had short buildup as per the report.
Axis Direct presents daily derivatives report presenting recommendations based on technical analysis. For trading in derivatives visit https://simplehai.axisdirect.in/offerings/products/derivatives
The document provides a technical analysis of the Nifty and Bank Nifty indices for the week. It notes that both indices ended the week lower, forming bearish candlestick patterns and closing at new 3-year lows. It identifies support and resistance levels for the indices and sees further downside if those levels are broken. The analysis recommends selling on rallies as the indices remain in downtrends in the short to medium term. Specific stock ideas are also provided based on the technical analysis.
Axis Direct presents daily derivatives report presenting recommendations based on technical analysis. For trading in derivatives visit https://simplehai.axisdirect.in/offerings/products/derivatives
- The Nifty and Sensex indices opened with downward gaps and fell throughout the trading session, closing near their lowest points of the day with losses of over 7%.
- On the daily chart, both indices have formed bearish candles and remain restricted within the high-low ranges of previous sessions, indicating an absence of strength on either side and a sustained downtrend.
- Technical indicators suggest that if the Nifty breaks below 9,130 it could fall to 9,000-8,920, while a move above 9,380 could trigger a short-term pullback rally to 9,450-9,520.
Axis Direct presents daily derivatives report presenting recommendations based on technical analysis. For trading in derivatives visit https://simplehai.axisdirect.in/offerings/products/derivatives
Webroot antivirus helps with online security. Use reliable security software to protect your devices from attacks, providing online security and quiet mind when using technology for business or work.
Whatsapp Number for Paid Service:
+447490809237
How To Check SIM Owner Name And CNIC Of Any Mobile Number
Thanks to the Pakistan Telecommunication Authority’s (PTA) online verification facilities, obtaining SIM owner information has become much easier. Here’s how to find the CNIC and SIM owner details by number:
Compose an SMS to 667: Open a new message on your SIM card and write “MNP”.
Send the SMS: Send this message to the shortcode 667.
Receive Information: Wait for a reply. A message containing the name of the SIM owner associated with the specific SIM number will be sent to you.
Additionally, you can visit or call your network service provider’s local customer care center to confirm the SIM registration status and owner’s name. This simplified procedure eliminates the need for extensive documentation and offers a convenient way to obtain necessary SIM details in Pakistan.
Check SIM Owner Details With Name Online
In Pakistan, there are various Android apps and software solutions available to check the SIM owner’s name by mobile number online. However, it is important to note that most of these apps have not been approved by the Pakistan Telecommunication Authority (PTA), and their use is not recommended. If you choose to use these apps, proceed with caution. Remember, the current law only permits the registration of five SIMs under one identity.
Always verify the validity of any software or tool you decide to use, as unauthorized access to SIM owner credentials may have legal consequences.
Check Jazz SIM Owner Name Details 2024
To check Jazz SIM owner name and details online, follow these steps:
Open the Messaging App: On your mobile phone, open the messaging app.
Create a New Message: Type “667” in the recipient field.
Write the Message: Type “MNP” in the message body.
Send the Message: Send the message using your Jazz SIM.
Wait for a Response: You will receive a message containing the SIM owner’s name and CNIC number associated with the Jazz SIM you are using.
Terms:
Codes can change at any time. Check the Jazz website if the code above has an error.
For further information, call the Jazz helpline.
You can check the Jazz SIM owner, registered address, and location by calling the helpline.
Check Ufone Sim Owner Name Details 2024.
If you want to Check Ufone SIM Owner Name & Ufone SIM Owner Details online check it by the following steps:
Open the messaging app on your mobile phone.
Create a new message.
In the recipient field, type “667”.
In the message body, type “MNP”.
Send the message through your Ufone SIM.
Wait for a response. You will receive a message containing the SIM owner’s name and CNIC number associated with the Ufone SIM which is in your use.
#sim owner details
#sim owner details pakistan
#nadra sim owner details
#sim owner details by number
#sim owner details online
#sim owner details apk
#sim owner details app
#sim owner details online check pakistan
#pak sim data sim owner details
#zong sim owner details
Whatsapp Number: +447490809237
sim owner details
sim owner details pakistan
nadra sim owner details
sim owner details by number
sim owner details online
sim owner details apk
sim owner details app
sim owner details online check pakistan
pak sim data sim owner details
zong sim owner details
check sim owner details
how to check sim owner details in pakistan
find sim owner details in pakistan
mobile sim owner details
how to check sim owner details
sim card owner details
sim card owner details online
sim owner details with name and address
track sim card owner details online
jio sim owner details
sim owner details software
check sim card owner details
find sim owner details
how to check airtel sim owner details
how to check sim card owner details
how to find a sim owner details
how to find sim owner details
how to know sim card owner details
how to know sim owner details
idea sim card owner details online
sim card owner details app
sim card owner details software
sim owner name details
ufone sim owner details
00923456435194 sim owner detail
ap to know the sim owners details
check sim number owner details
find out details of owner of sim card
finding sim registration owner details
full details of sim card owner pakistan
how to check my sim owner details
how to check owner detail through sim
how to check owner details of a sim
how to check owner details of jaz sim
how to check sim owner details who tease people
how to check sim owner name and detail warid
how to chek owner details of sim
how to find a sim owner details pakista
how to find a sim owner details pakistan
how to find sim card owner details in pakistan
how to get details of others sim owner in pakistan
how to trace a sim owner details pakistan
idea sim card owner details
iran sim details of owner
iran sim details of owner website
mobile phone number details sim owner name address
mobile phone number details sim owner name address location
online sim owner details.pakistan
pakistan prepaid sim owner details
pakistan sim owner details
phone number details sim owner name address location
search sim card owner and details using apk
sim card owner details app for pakistan
sim detail check online owner
sim details online by number owner name
sim number all details with owner name
sim number all details with owner name id card
sim owner call details online
sim owner details by contact number
sim owner details online with name and address
sim owner name full details
Top 10 Challenges That Every Web Designer Face on A Daily Basis.pptxe-Definers Technology
In today’s fast-moving digital world, building websites is super important for how well a business does online. But, because things keep changing with technology and what people expect, teams who make websites often run into big problems. These problems can slow down their work and stop them from making really good websites. Let us see what the best website designers in Delhi have to say –
https://www.edtech.in/services/website-designing-development-company-delhi.htm
Top 10 Proven Ways for Optimizing a WordPress Website for SEO.pptxe-Definers Technology
Designing a WordPress website for SEO involves a combination of technical optimization, content strategy, and user experience considerations. Some of the leading WordPress developers of the best web design company in Delhi are here with some useful ways –
https://www.edtech.in/services/website-designing-development-company-delhi.htm
Best Web Development Frameworks in 2024growthgrids
Best Web Development Frameworks: In 2024, the landscape of web development frameworks is diverse, with different frameworks excelling in various aspects such as 1. React, 2. Jquery, 3. MySQL, and 4. ASP.NET. With a strategic blend of manual testing and cutting-edge automated tools, we guarantee a flawless user experience. Partner with Growth Grids and elevate your software quality to new heights.
Contact Us :-
Email: [business@growthgrids.com]
Phone: [+91-9773356002]
Website : https://growthgrids.com
How Long Does Vinyl Siding Last and What Impacts Its Life Expectancy?Alexa Bale
The majority of siding industry insiders assert that vinyl has a 20–40-year lifespan. Although this lifetime indicates an increase over earlier siding types, the average life expectancy is heavily dependent on outside factors. Vinyl siding needs to be carefully maintained, especially after a weather event. Dive into ppt to know How Long Does Vinyl Siding Last and What Impacts Its Life Expectancy.
Visions of Reality Inspiring Innovations from MIT Reality Hack 2024.betterworlds2012
The MIT Reality Hack 2024 brought together over 500 visionaries in VR, AR, MR, and XR, transforming my view on what I had skeptically called "computational illusions."
How Live-In Care Benefits Chronic Disease Management.pdfKenWaterhouse
Explore how live-in care can significantly benefit chronic disease management, enhancing the quality of life for those affected and providing peace of mind for their families.
Whatsapp Number For Paid Services:
+447490809237
Find Sim owner details easily with our Live Tracker. You will get accurate and instant sim information with number. Whether, you are looking for Nadra Sim Ownership details or location we are here to serve you.
Are you in need of quick and reliable access to SIM ownership details and other essential information for Pakistani telecommunications customers? Look no further!
Our live tracker is providing you with up-to-date SIM database information within seconds. Gone are the days of waiting for official sources to provide this data, as our service offers instant access to SIM ownership details, equivalent to information obtained from official sources but without the long wait times.
With just basic internet skills and a stable connection, you can conveniently access Pakistani SIM data, including owner details for 2024. Whether you need to verify phone number details, check SIM information, or access mobile number information online, our platform has you covered. Save time and effort by using our service today!
Sim Tracker – Free Sim Data 2024
Here are the some tools that are free to use like sim tracker, sim database checker , sim owner details , and also vehicle owner details and if you want our premium or paid services then you can contact us on whatsapp.
How to Verify the Number of SIM Cards Registered under your CNIC?
If you want to check how many SIM cards are registered under your name, you can do it easily. Just go to your mobile network provider’s website or app. Look for the feature called “SIM Ownership CNIC Tracker.” Then, type in your CNIC number correctly. After you submit it, the system will show you a list of all the SIM cards registered under your name. It will tell you which ones are active (in use) and which ones are inactive (not in use). Check this list carefully to see if there are any SIM cards you don’t need anymore. If you find any inactive ones, you can remove them to make room for new ones. This is helpful if you’re trying to add a new SIM card but all the slots are full. If you have any questions or problems with the registered SIM cards, you can contact your mobile network provider’s customer support for help.. By doing this, you can manage your SIM cards better and make sure you’re using your slots efficiently.
What information does live tracker provide for CNIC numbers?
SimOwnerDetails.online offers a comprehensive range of NADRA sim owner details for CNIC numbers. This includes the holder’s name, address, and a complete list of mobile numbers registered under the CNIC. Users can access detailed information about each registered SIM, facilitating better management and security of their telecommunications accounts.
What Sim information does SimOwnerDetails.online provide for SIM card numbers?
#sim owner details
#sim owner details pakistan
#nadra sim owner details
#sim owner details by number
#sim owner details online
#sim owner details apk
#sim owner details app
Electrical Testing Lab Services in Dubai.pptxsandeepmetsuae
An electrical testing lab in Dubai plays a crucial role in ensuring the safety and efficiency of electrical systems across various industries. Equipped with state-of-the-art technology and staffed by experienced professionals, these labs conduct comprehensive tests on electrical components, systems, and installations.
How Can I Apply in India (2024) for a US B1/B2 Visa Renewal?usaisofficial
Are your US visas current? Though it will soon expire, I’m not sure what to do. We will assist you in getting a fresh US visa and being protected. The procedures and conditions for renewing a US B1/B2 visa can grab your attention. This blog article will cover everything you need to know regarding the US B1/B2 visa renewal in India in 2024. Alternatively, do you have to show up for an interview? Right now, the US B1/B2 visa waiting period in India is what?
Material Testing Lab Services in Dubai.pdfsandeepmetsuae
Dubai is home to numerous advanced material testing labs, offering state-of-the-art facilities for a wide range of industries. These labs provide critical services such as mechanical testing, chemical analysis, and non-destructive testing, ensuring the quality and durability of materials used in construction, aerospace, and manufacturing.
Electrical Testing Lab Services in Dubai.pdfsandeepmetsuae
An electrical testing lab in Dubai plays a crucial role in ensuring the safety and efficiency of electrical systems across various industries. Equipped with state-of-the-art technology and staffed by experienced professionals, these labs conduct comprehensive tests on electrical components, systems, and installations.
#1 Call Girls in Islamabad || 03274100048 || Quick Booking at Affordable Priceownerdetailssim
Islamabad Call Girls Services – Available 24/7
One of the most educated and reliable Call Girls in Islamabad. They only work with real guys who want to enjoy the company of our high-class, sexy call girls with love and respect. Our call girls have enough experience to know how to make their guests happy at that time. Of course, we’re known for our genuine hospitality.
Our stylish Independent Islamabad call girls are available 24 hours a day, seven days a week. People who work for our agency will make you feel right at home as soon as you meet them. You’ll feel like you’re at a real Call Girl agency in Islamabad.
Our guests come back repeatedly, and no matter what megacity they visit, they always contact us to talk about the nightlife. If you’re in a big city by yourself and getting sexy in a hotel room. Our girls are so well-trained that they can go to a club, a party, or a DJ night with you and make you feel unforgettable.
Our VIP call girls are dedicated to their jobs and look forward to giving you a great experience and ensuring you’re delighted. We are quick at getting new gifts, which is why our customers love us so much. Before, you saw our girls’ portfolios and hot pictures, which made you want to do anything. Book your stay in Islamabad right now by calling.
Special Moments with Islamabad Call Girls
Customers are surprised by how satisfying, inspiring, and powerful Islamabad Call Girl’s minutes are, which makes them love her even more. Our agency’s name in the market is due to our excellent call girls, who keep clients coming back for life.
As a Call Girl service in Islamabad, Islamabad Nights Call Girl has been helping a wide range of clients for a long time. His work makes the value of the business easy to understand, appealing, and beautiful. The only thing that makes the firm successful is its dedication to giving clients excellent customer service.
The terms and conditions of the Islamabad Call Girls service are standard. Kids under 18 can’t get help from this government because it doesn’t want them; they have to be at least 18 years old. His agency only gives the power to mature people travelling with real sidekicks.
The people who work for this office are trained, responsible, and prepared for their jobs. They don’t like other Call Girls who only want money in exchange for giving clients beds. They serve both inside and outside people.
Ready to Meet Islamabad Call Girls Now!
You don’t need to wait. We’ll send hot Call Girls to your house if you call us. It’s easy for these young, pretty women to make guys happy.
No need to worry about how they treat you because they are all very friendly and work for a company. They know how to make every guy happy.
#call girls in islamabad #islamabad call girls #call girl in islamabad #islamabad call girl
Material Testing Lab Services in Dubai.pptxsandeepmetsuae
Dubai is home to numerous advanced material testing labs, offering state-of-the-art facilities for a wide range of industries. These labs provide critical services such as mechanical testing, chemical analysis, and non-destructive testing, ensuring the quality and durability of materials used in construction, aerospace, and manufacturing.
The Fraud Examiner’s Report –
What the Certified Fraud Examiner Should Know
Being a Virtual Training Paper presented at the Association of Certified Fraud Examiners (ACFE) Port Harcourt Chapter Anti-Fraud Training on July 29, 2023.
The Fraud Examiner’s Report – What the Certified Fraud Examiner Should Know
Weekly Technical Report :27 May 2019
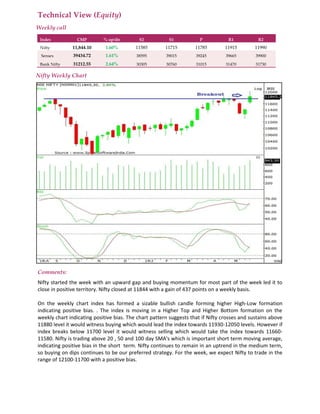
1. Technical View (Equity)
Weekly call
Index CMP % up/dn S2 S1 P R1 R2
Nifty 11,844.10 1.60% 11585 11715 11785 11915 11990
Sensex 39434.72 1.61% 38595 39015 39245 39665 39900
Bank Nifty 31212.55 2.64% 30305 30760 31015 31470 31730
Nifty Weekly Chart
Comments:
Nifty started the week with an upward gap and buying momentum for most part of the week led it to
close in positive territory. Nifty closed at 11844 with a gain of 437 points on a weekly basis.
On the weekly chart index has formed a sizable bullish candle forming higher High-Low formation
indicating positive bias. . The index is moving in a Higher Top and Higher Bottom formation on the
weekly chart indicating positive bias. The chart pattern suggests that if Nifty crosses and sustains above
11880 level it would witness buying which would lead the index towards 11930-12050 levels. However if
index breaks below 11700 level it would witness selling which would take the index towards 11660-
11580. Nifty is trading above 20 , 50 and 100 day SMA's which is important short term moving average,
indicating positive bias in the short term. Nifty continues to remain in an uptrend in the medium term,
so buying on dips continues to be our preferred strategy. For the week, we expect Nifty to trade in the
range of 12100-11700 with a positive bias.
2. The weekly strength indicator RSI and momentum oscillator Stochastic have both turned positive and
are above their respective reference lines indicating positive bias
The trend deciding level for the day is 11785. If NIFTY trades above this level then we may witness a
further rally up to 11915-11990-12115 levels. However, if NIFTY trades below 11785 levels then we may
see some profit booking initiating in the market, which may correct up to 11715-11585-11515 levels
Bank Nifty Weekly Chart
Comments:
Bank Nifty started the week with an upward gap and buying momentum for most part of the week led it
to close in positive territory. Bank Nifty closed at 31213 with a gain of 1762 points on a weekly basis.
On the weekly chart index has formed a bullish candle forming higher High-Low formation indicating
positive bias. . The index is moving in a Higher Top and Higher Bottom formation on the weekly chart
indicating positive bias. The chart pattern suggests that if Bank Nifty crosses and sustains above 31280
levels it would witness buying which would lead the index towards 31430-31700 levels. However if index
breaks below 30650 level it would witness selling which would take the index towards 30500-30200.
Bank Nifty is trading below 20 ,50 and 100 day SMA's which are important short term moving average,
indicating negative bias in the short to medium term. Bank Nifty continues to remain in an uptrend in
the medium term, so buying on dips continues to be our preferred strategy. For the week, we expect
Bank Nifty to trade in the range of 32000-30500 with a positive bias.
The weekly strength indicator RSI and momentum oscillator Stochastic have both turned positive and
are above their respective reference lines indicating positive bias
3. The trend deciding level for the day is 39245. If BANK NIFTY trades above this level then we may witness
a further rally up to 39665-39900-40320 levels. However, if BANK NIFTY trades below 39245 levels then
we may see some profit booking initiating in the market, which may correct up to 39015-38595-38360
levels
STOCKS IDEAS FOR THE DAY
Company Name BUY/SELL RANGE Stop Loss Target
INFRATEL BUY(Above) 280 277 283-286
PETRONET BUY(Above) 245 242 248-250
Note- Stocks Ideas are based on previous day’s close and are activated only if they trade in buy/sell range.