Daily Technical Report:16 April 2019
•
0 likes•13 views

Axis Direct presents daily derivatives report presenting recommendations based on technical analysis. For trading in derivatives visit https://simplehai.axisdirect.in/offerings/products/derivatives

Recommended
Recommended
More Related Content
What's hot
What's hot (20)
Similar to Daily Technical Report:16 April 2019
Similar to Daily Technical Report:16 April 2019 (16)
More from Axis Direct
More from Axis Direct (20)
Recently uploaded
Recently uploaded (20)
Daily Technical Report:16 April 2019
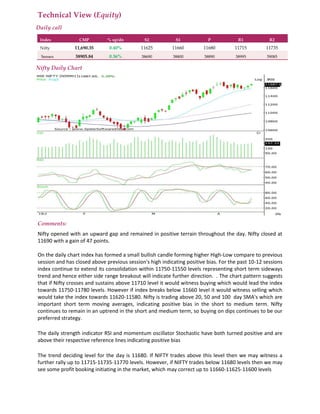
- 1. Technical View (Equity) Daily call Index CMP % up/dn S2 S1 P R1 R2 Nifty 11,690.35 0.40% 11625 11660 11680 11715 11735 Sensex 38905.84 0.36% 38690 38800 38890 38995 39085 Nifty Daily Chart Comments: Nifty opened with an upward gap and remained in positive terrain throughout the day. Nifty closed at 11690 with a gain of 47 points. On the daily chart index has formed a small bullish candle forming higher High-Low compare to previous session and has closed above previous session's high indicating positive bias. For the past 10-12 sessions index continue to extend its consolidation within 11750-11550 levels representing short term sideways trend and hence either side range breakout will indicate further direction. . The chart pattern suggests that if Nifty crosses and sustains above 11710 level it would witness buying which would lead the index towards 11750-11780 levels. However if index breaks below 11660 level it would witness selling which would take the index towards 11620-11580. Nifty is trading above 20, 50 and 100 day SMA's which are important short term moving averages, indicating positive bias in the short to medium term. Nifty continues to remain in an uptrend in the short and medium term, so buying on dips continues to be our preferred strategy. The daily strength indicator RSI and momentum oscillator Stochastic have both turned positive and are above their respective reference lines indicating positive bias The trend deciding level for the day is 11680. If NIFTY trades above this level then we may witness a further rally up to 11715-11735-11770 levels. However, if NIFTY trades below 11680 levels then we may see some profit booking initiating in the market, which may correct up to 11660-11625-11600 levels
- 2. STOCKS IDEAS FOR THE DAY Company Name BUY/SELL RANGE Stop Loss Target TCS BUY 2113-2106 2092 2146-2160 MOTHERSUMI BUY 155-154 152 157-160