Weekly Technical Report :22 April 2019
•
0 likes•13 views

Axis Direct presents daily derivatives report presenting recommendations based on technical analysis. For trading in derivatives visit https://simplehai.axisdirect.in/offerings/products/derivatives

Recommended
Recommended
More Related Content
What's hot
What's hot (20)
Similar to Weekly Technical Report :22 April 2019
Similar to Weekly Technical Report :22 April 2019 (20)
More from Axis Direct
More from Axis Direct (20)
Recently uploaded
Recently uploaded (20)
Weekly Technical Report :22 April 2019
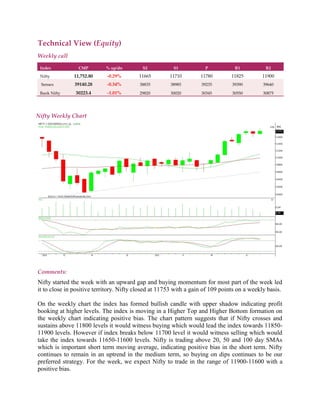
- 1. Technical View (Equity) Weekly call Index CMP % up/dn S2 S1 P R1 R2 Nifty 11,752.80 -0.29% 11665 11710 11780 11825 11900 Sensex 39140.28 -0.34% 38835 38985 39235 39390 39640 Bank Nifty 30223.4 -1.01% 29820 30020 30345 30550 30875 Nifty Weekly Chart Comments: Nifty started the week with an upward gap and buying momentum for most part of the week led it to close in positive territory. Nifty closed at 11753 with a gain of 109 points on a weekly basis. On the weekly chart the index has formed bullish candle with upper shadow indicating profit booking at higher levels. The index is moving in a Higher Top and Higher Bottom formation on the weekly chart indicating positive bias. The chart pattern suggests that if Nifty crosses and sustains above 11800 levels it would witness buying which would lead the index towards 11850- 11900 levels. However if index breaks below 11700 level it would witness selling which would take the index towards 11650-11600 levels. Nifty is trading above 20, 50 and 100 day SMAs which is important short term moving average, indicating positive bias in the short term. Nifty continues to remain in an uptrend in the medium term, so buying on dips continues to be our preferred strategy. For the week, we expect Nifty to trade in the range of 11900-11600 with a positive bias.
- 2. The weekly strength indicator RSI is moving upwards and is quoting above its reference line indicating positive bias. However momentum oscillator Stochastic has turned negative from the overbought zone indicating a possible consolidation or a down move in the near term The trend deciding level for the day is 11780. If NIFTY trades above this level then we may witness a further rally up to 11825-11900-11945 levels. However, if NIFTY trades below 11780 levels then we may see some profit booking initiating in the market, which may correct up to 11710-11665-11590 levels Bank Nifty Weekly Chart Bank Nifty started the week with an upward gap and buying momentum for most part of the week led it to close in positive territory. Bank Nifty closed at 30223 with a gain of 285 points on a weekly basis. On the weekly chart the index has formed bullish candle with upper shadow indicating profit booking at higher levels. The index is moving in a Higher Top and Higher Bottom formation on the weekly chart indicating positive bias. The chart pattern suggests that if Bank Nifty crosses and sustains above 30400 levels it would witness buying which would lead the index towards 30500-30700 levels. However if index breaks below 30100 level it would witness selling which
- 3. would take the index towards 29900-29700 levels. Bank Nifty is trading above 20, 50 and 100 day SMAs which is important short term moving average, indicating positive bias in the short term. Bank Nifty continues to remain in an uptrend in the medium term, so buying on dips continues to be our preferred strategy. For the week, we expect Bank Nifty to trade in the range of 30700-29700 with a positive bias. The weekly strength indicator RSI is moving upwards and is quoting above its reference line indicating positive bias. However momentum oscillator Stochastic has turned negative from the overbought zone indicating a possible consolidation or a down move in the near term The trend deciding level for the day is 39235. If BANK NIFTY trades above this level then we may witness a further rally up to 39390-39640-39795 levels. However, if BANK NIFTY trades below 39235 levels then we may see some profit booking initiating in the market, which may correct up to 38985-38835-38580 levels STOCKS IDEAS FOR THE DAY Company Name BUY/SELL CMP Stop Loss Target RELIANCE BUY Above 1390 1375 1405/1420 TCS BUY Above 2155 2130 2180/2200