Daily Technical Report:26 April 2019
•
0 likes•11 views

Axis Direct presents daily derivatives report presenting recommendations based on technical analysis. For trading in derivatives visit https://simplehai.axisdirect.in/offerings/products/derivatives

Recommended
More Related Content
What's hot
What's hot (20)
Similar to Daily Technical Report:26 April 2019
Similar to Daily Technical Report:26 April 2019 (13)
More from Axis Direct
More from Axis Direct (20)
Recently uploaded
Recently uploaded (20)
Daily Technical Report:26 April 2019
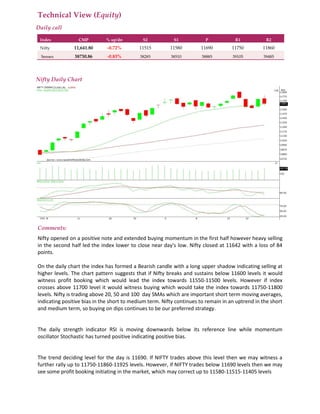
- 1. Technical View (Equity) Daily call Index CMP % up/dn S2 S1 P R1 R2 Nifty 11,641.80 -0.72% 11515 11580 11690 11750 11860 Sensex 38730.86 -0.83% 38285 38510 38885 39105 39485 Nifty Daily Chart Comments: Nifty opened on a positive note and extended buying momentum in the first half however heavy selling in the second half led the index lower to close near day's low. Nifty closed at 11642 with a loss of 84 points. On the daily chart the index has formed a Bearish candle with a long upper shadow indicating selling at higher levels. The chart pattern suggests that if Nifty breaks and sustains below 11600 levels it would witness profit booking which would lead the index towards 11550-11500 levels. However if index crosses above 11700 level it would witness buying which would take the index towards 11750-11800 levels. Nifty is trading above 20, 50 and 100 day SMAs which are important short term moving averages, indicating positive bias in the short to medium term. Nifty continues to remain in an uptrend in the short and medium term, so buying on dips continues to be our preferred strategy. The daily strength indicator RSI is moving downwards below its reference line while momentum oscillator Stochastic has turned positive indicating positive bias. The trend deciding level for the day is 11690. If NIFTY trades above this level then we may witness a further rally up to 11750-11860-11925 levels. However, if NIFTY trades below 11690 levels then we may see some profit booking initiating in the market, which may correct up to 11580-11515-11405 levels
- 2. STOCKS IDEAS FOR THE DAY Company Name BUY/SELL RANGE Stop Loss Target TCS BUY ABOVE 2205 2175 2235-2250 BHARTIARTL BUY ABOVE 332 329 336-340