Weekly Technical Report :11 February 2019
•
0 likes•21 views

Axis Direct presents daily derivatives report presenting recommendations based on technical analysis. For trading in derivatives visit https://simplehai.axisdirect.in/offerings/products/derivatives

Recommended
Recommended
More Related Content
What's hot
What's hot (20)
Similar to Weekly Technical Report :11 February 2019
Similar to Weekly Technical Report :11 February 2019 (16)
More from Axis Direct
More from Axis Direct (20)
Recently uploaded
Recently uploaded (8)
Weekly Technical Report :11 February 2019
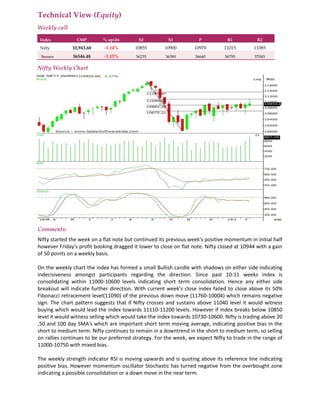
- 1. Technical View (Equity) Weekly call Index CMP % up/dn S2 S1 P R1 R2 Nifty 10,943.60 -1.14% 10855 10900 10970 11015 11085 Sensex 36546.48 -1.15% 36235 36390 36640 36795 37045 Nifty Weekly Chart Comments: Nifty started the week on a flat note but continued its previous week's positive momentum in initial half however Friday's profit booking dragged it lower to close on flat note. Nifty closed at 10944 with a gain of 50 points on a weekly basis. On the weekly chart the index has formed a small Bullish candle with shadows on either side indicating indecisiveness amongst participants regarding the direction. Since past 10-11 weeks index is consolidating within 11000-10600 levels indicating short term consolidation. Hence any either side breakout will indicate further direction. With current week’s close index failed to close above its 50% Fibonacci retracement level(11090) of the previous down move (11760-10004) which remains negative sign. The chart pattern suggests that if Nifty crosses and sustains above 11040 level it would witness buying which would lead the index towards 11110-11200 levels. However if index breaks below 10850 level it would witness selling which would take the index towards 10730-10600. Nifty is trading above 20 ,50 and 100 day SMA's which are important short term moving average, indicating positive bias in the short to medium term. Nifty continues to remain in a downtrend in the short to medium term, so selling on rallies continues to be our preferred strategy. For the week, we expect Nifty to trade in the range of 11000-10750 with mixed bias. The weekly strength indicator RSI is moving upwards and is quoting above its reference line indicating positive bias. However momentum oscillator Stochastic has turned negative from the overbought zone indicating a possible consolidation or a down move in the near term.
- 2. The trend deciding level for the day is 10970. If NIFTY trades above this level then we may witness a further rally up to 11015-11085-11130 levels. However, if NIFTY trades below 10970 levels then we may see some profit booking initiating in the market, which may correct up to 10900-10855-10785 levels Stocks to focus for intraday Long Dlf,Jubliant, Syngen, Kotak Bank Stocks to focus for intraday Short Ujjivan, OrientBank, IbulHsgfin, Pnb, Equitas, M&Mfin, Glenmark