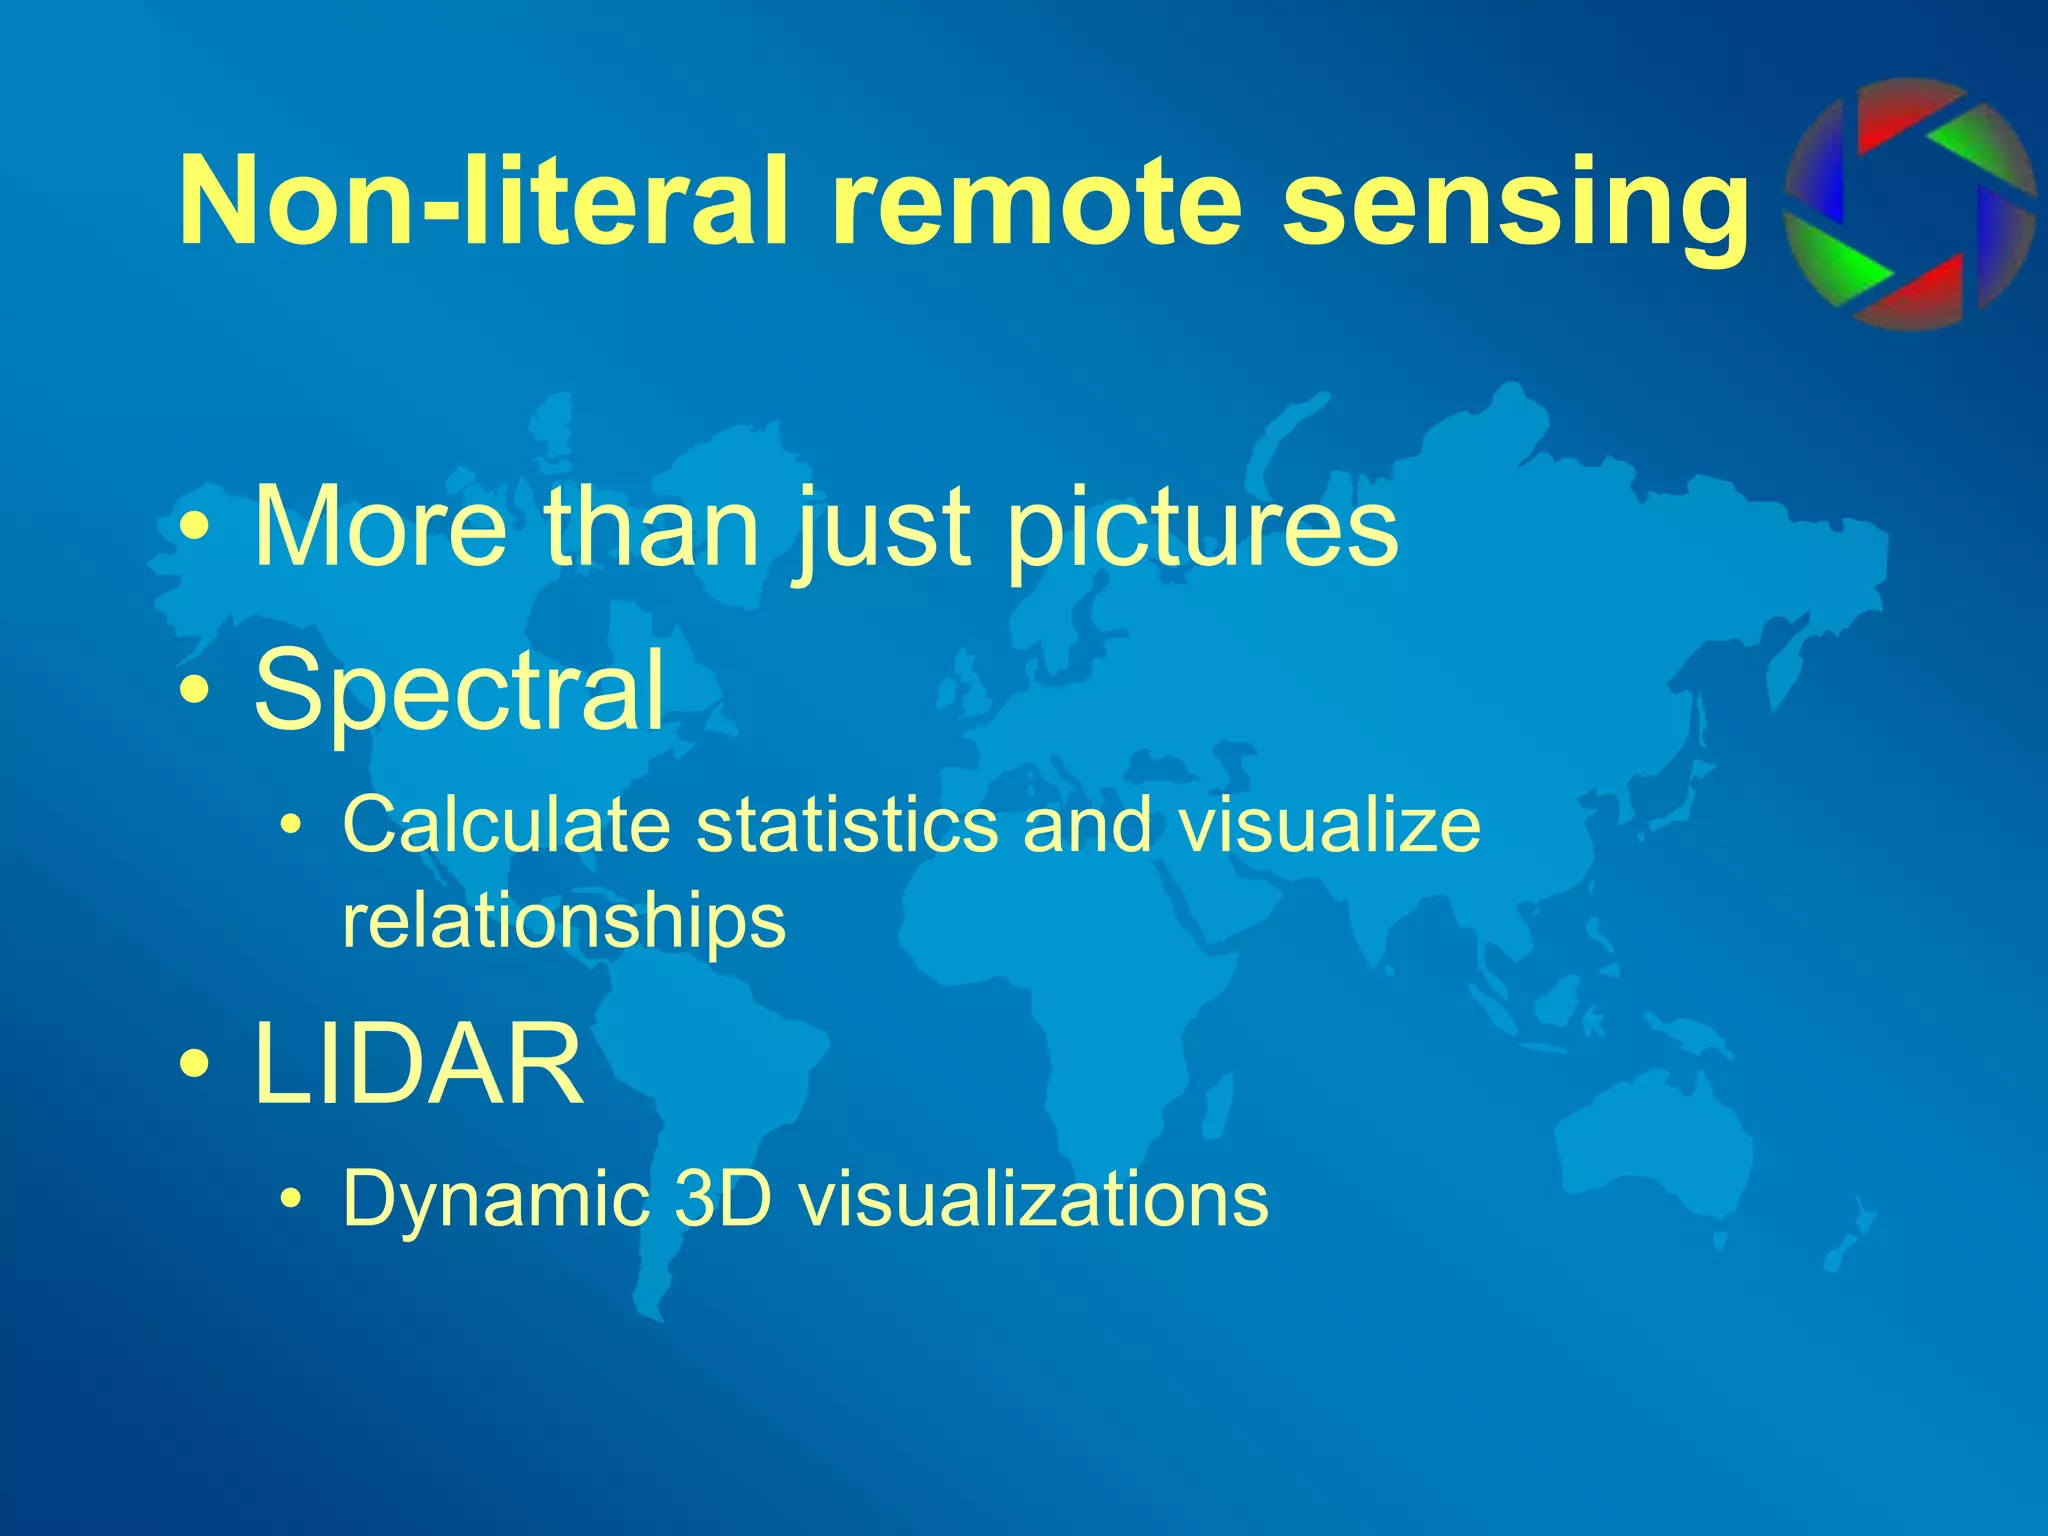
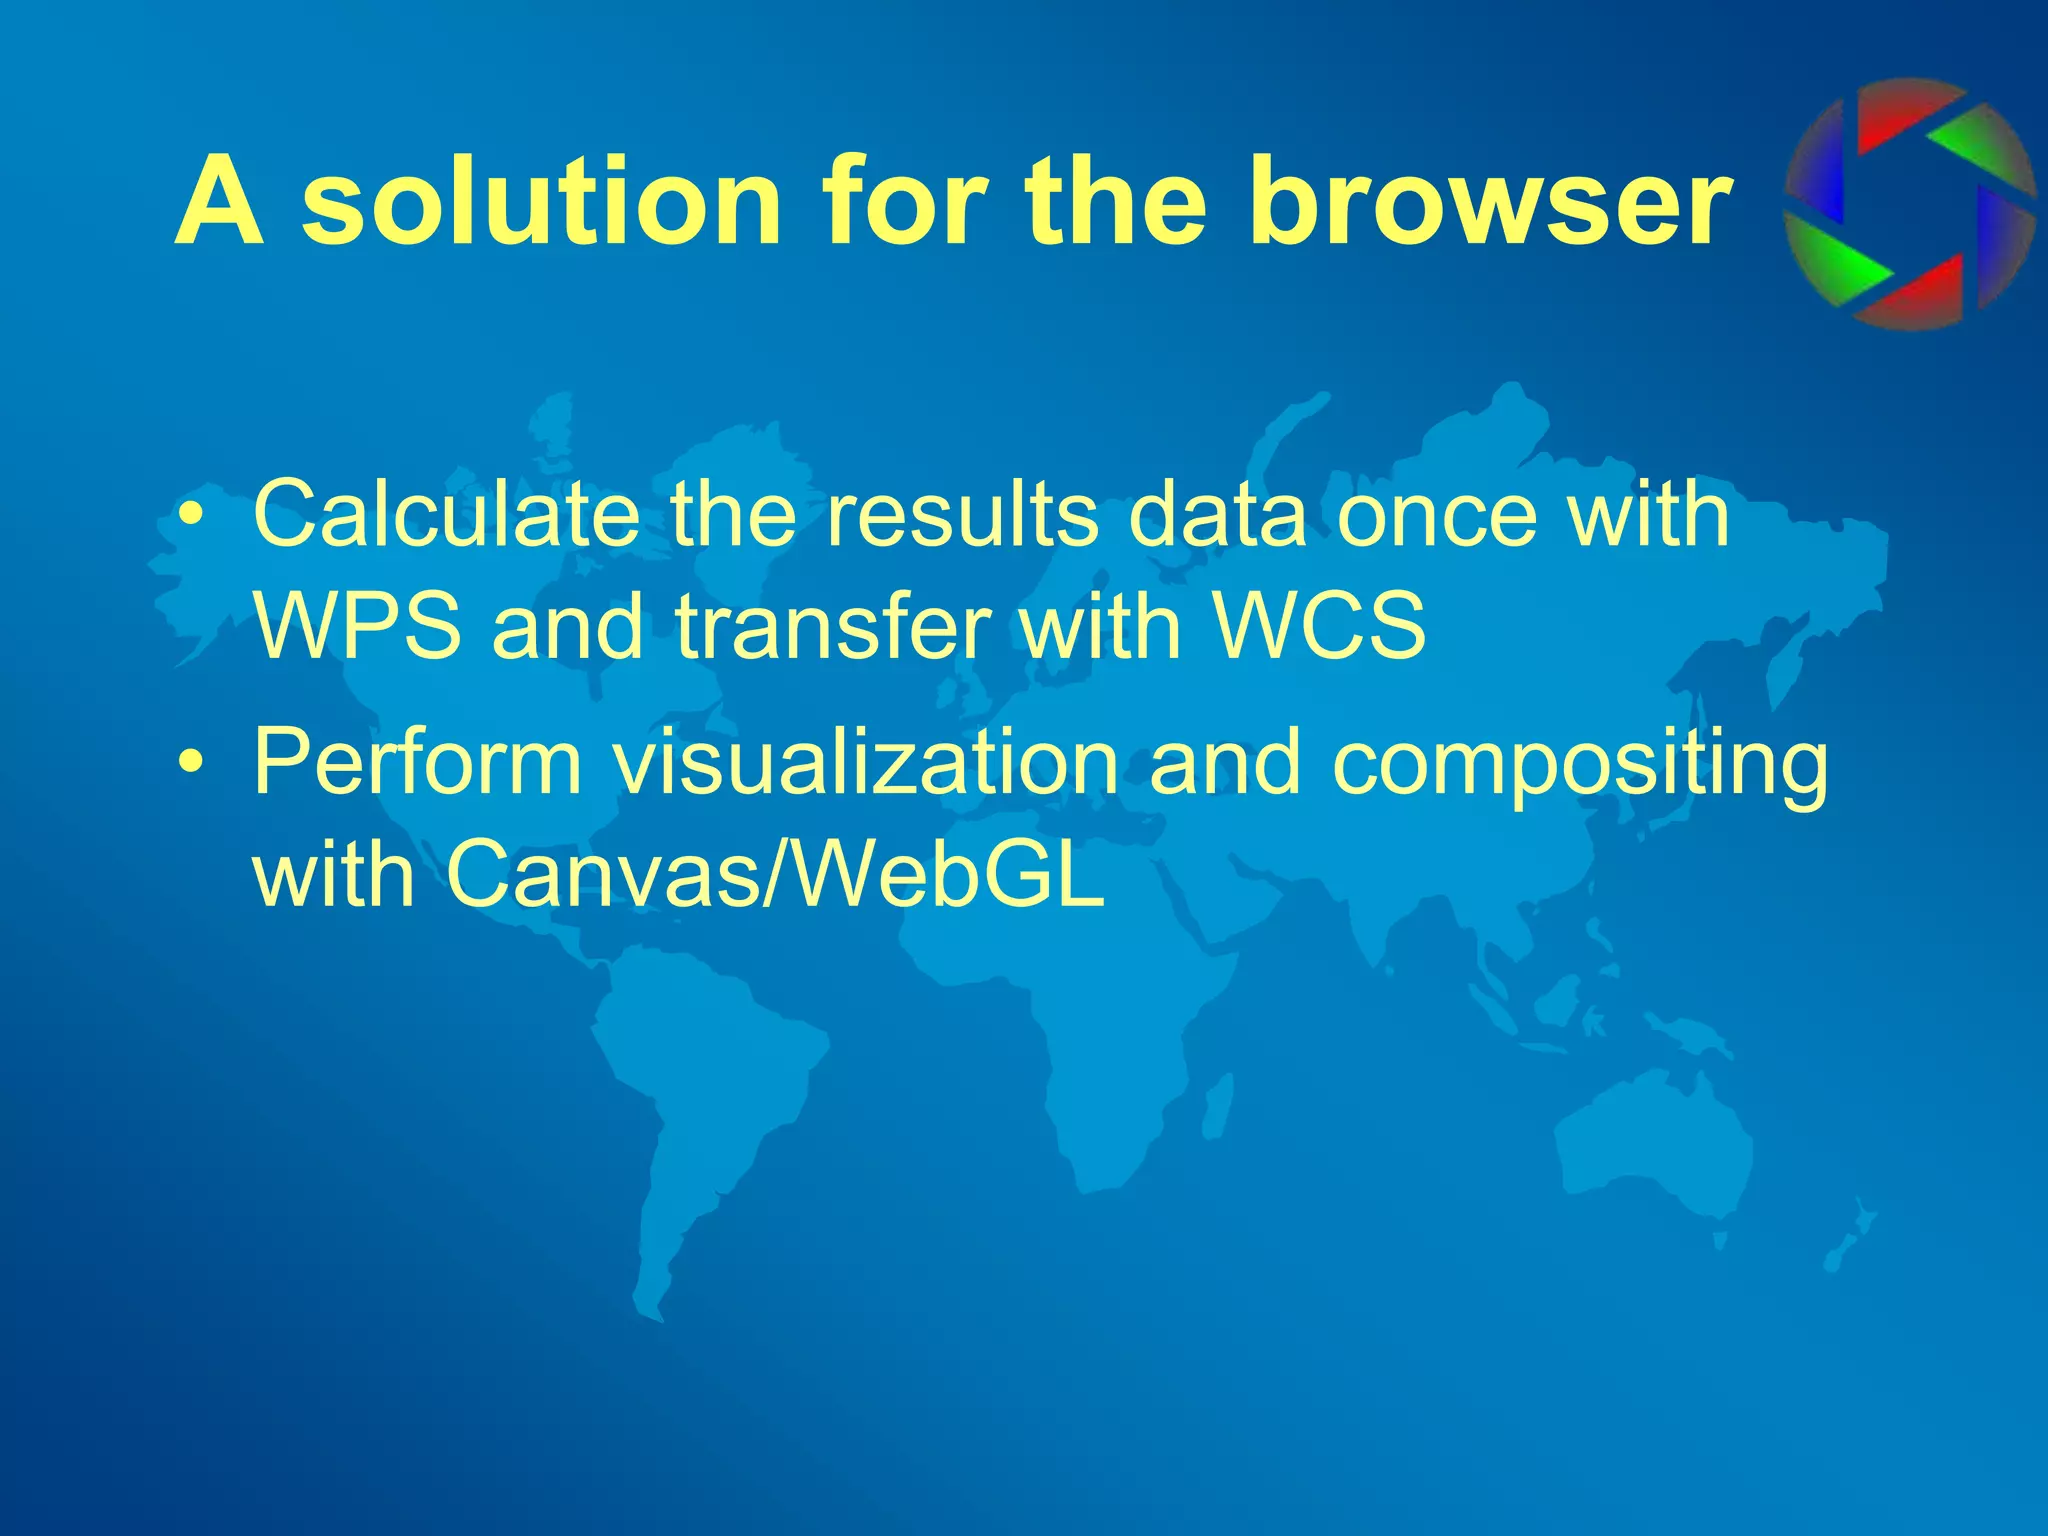
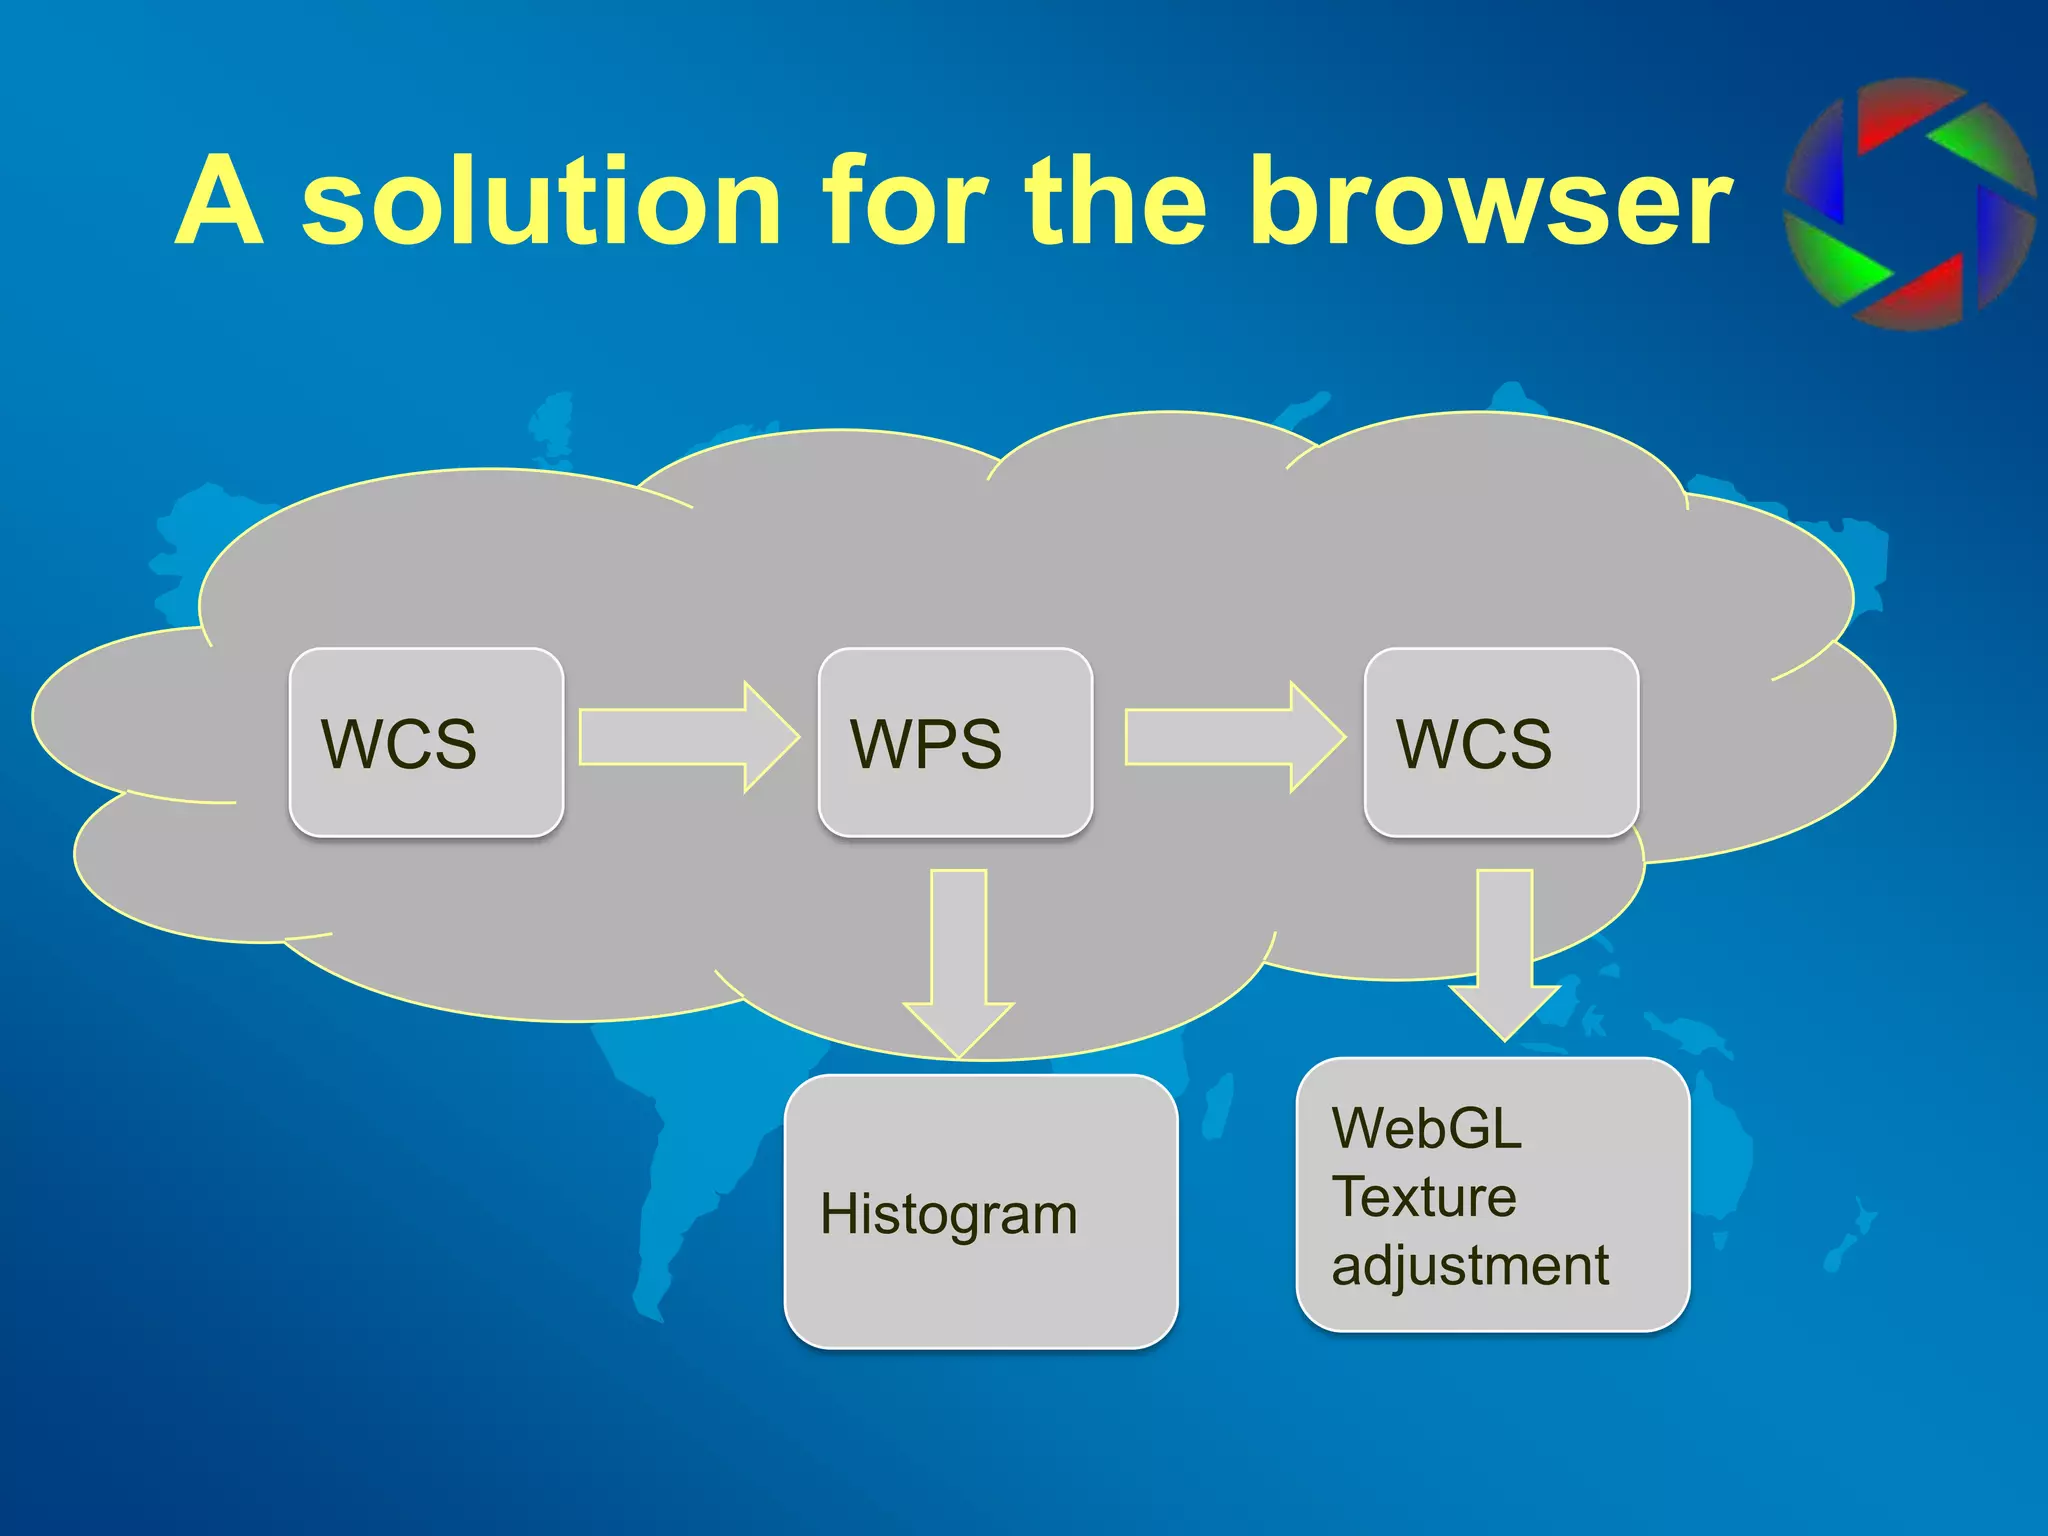
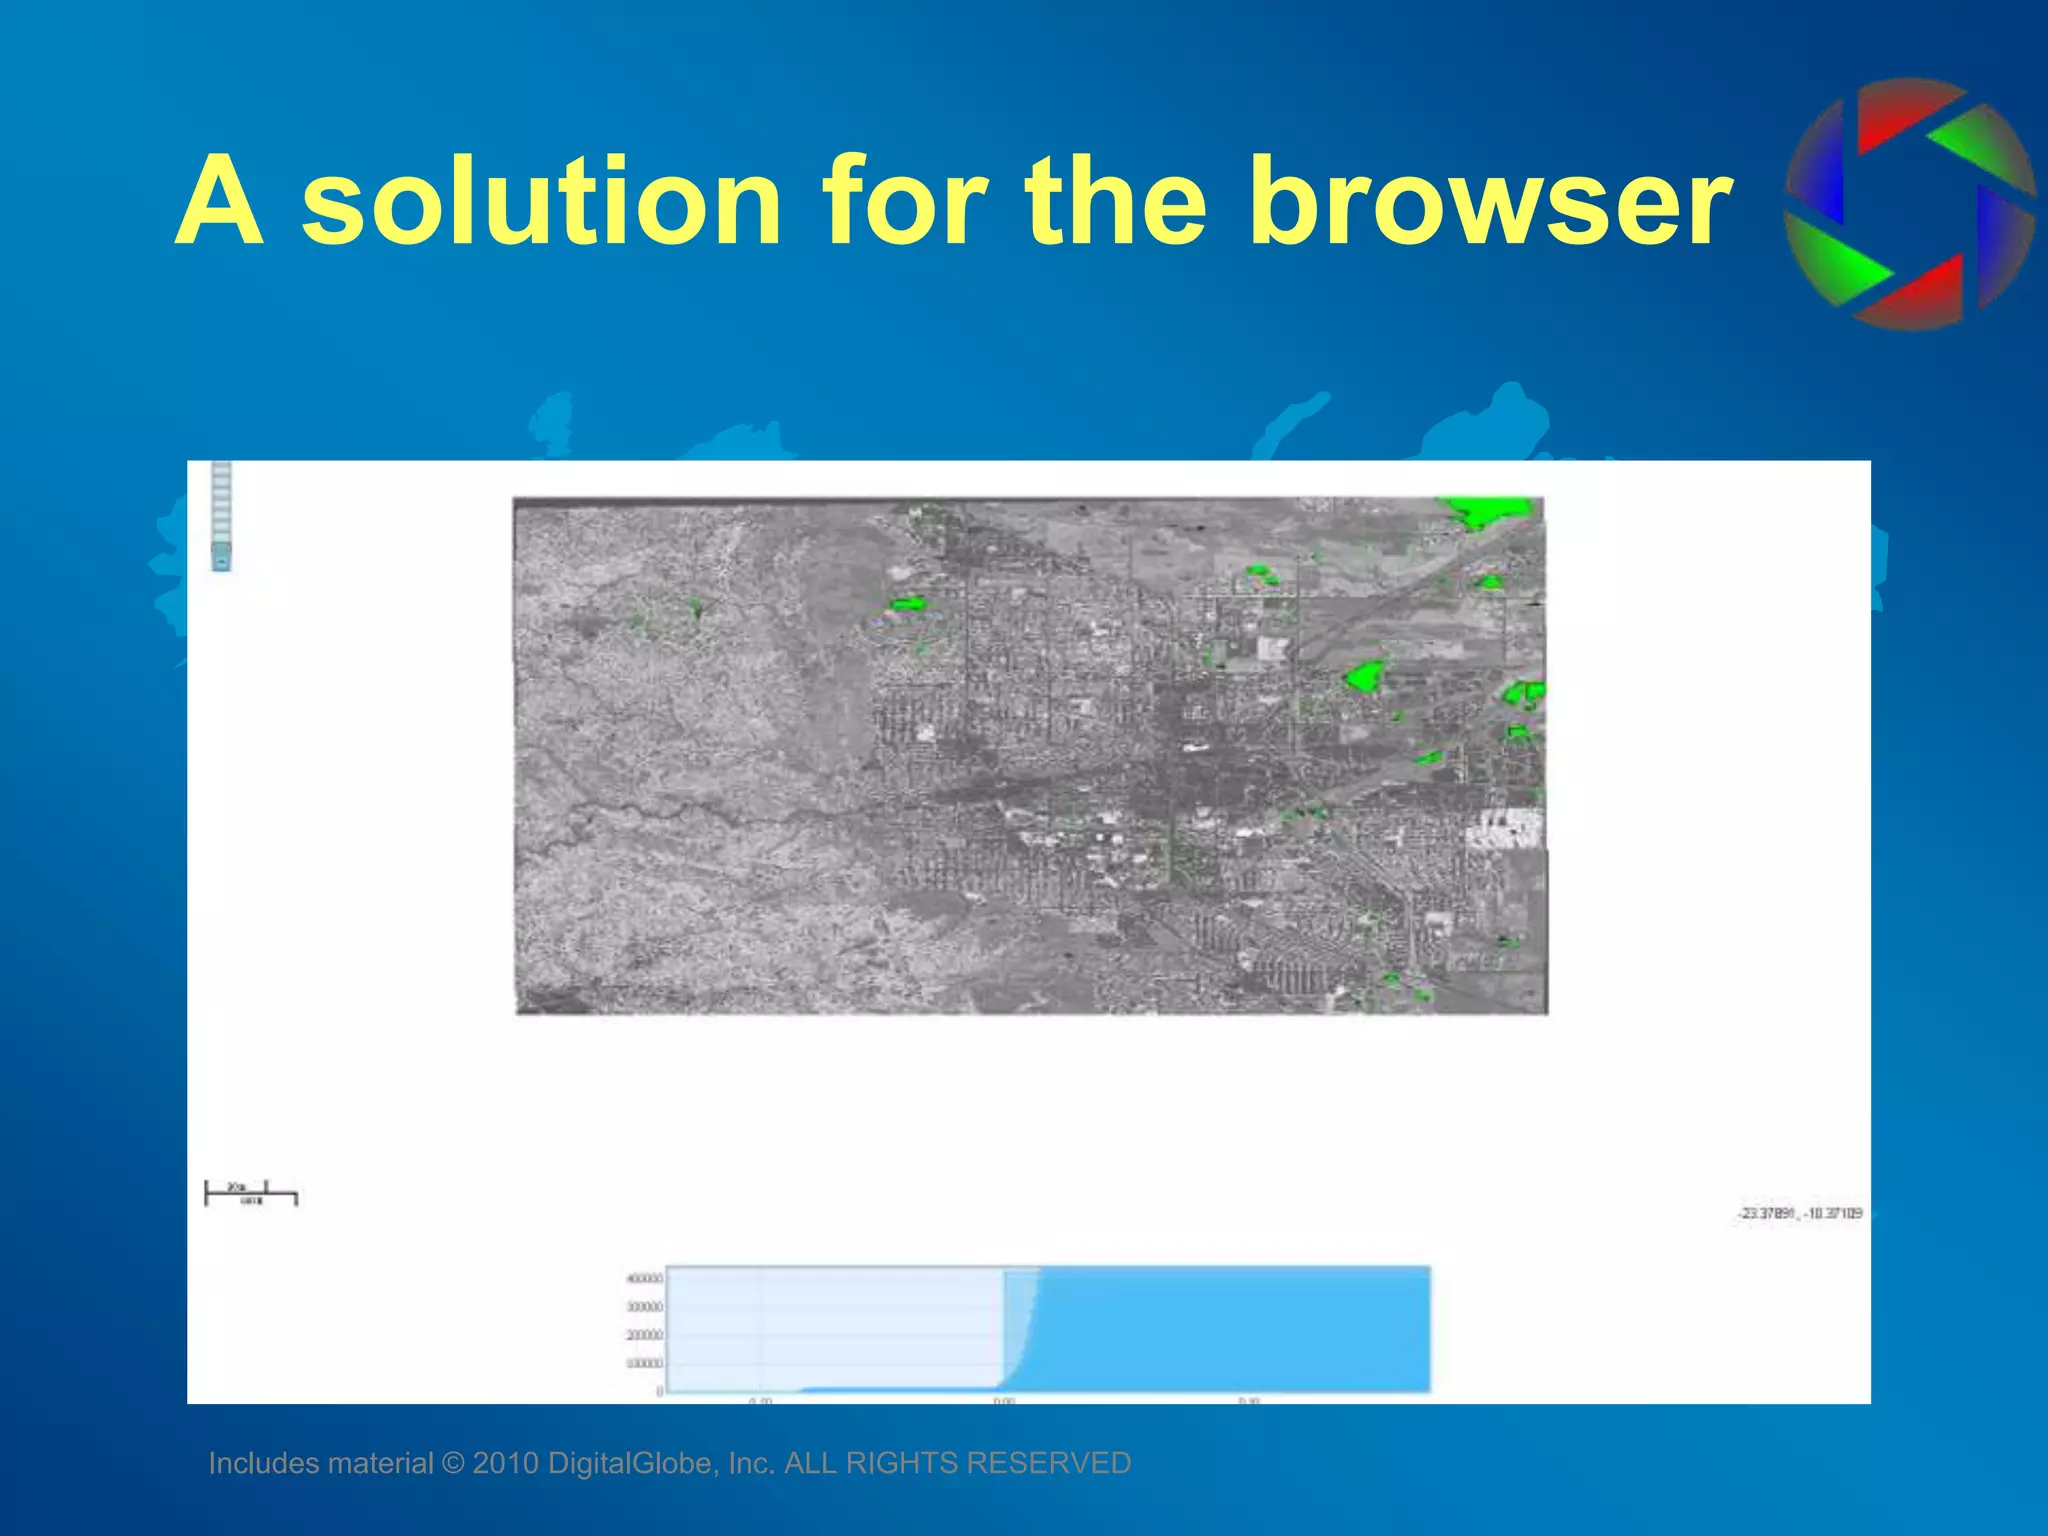
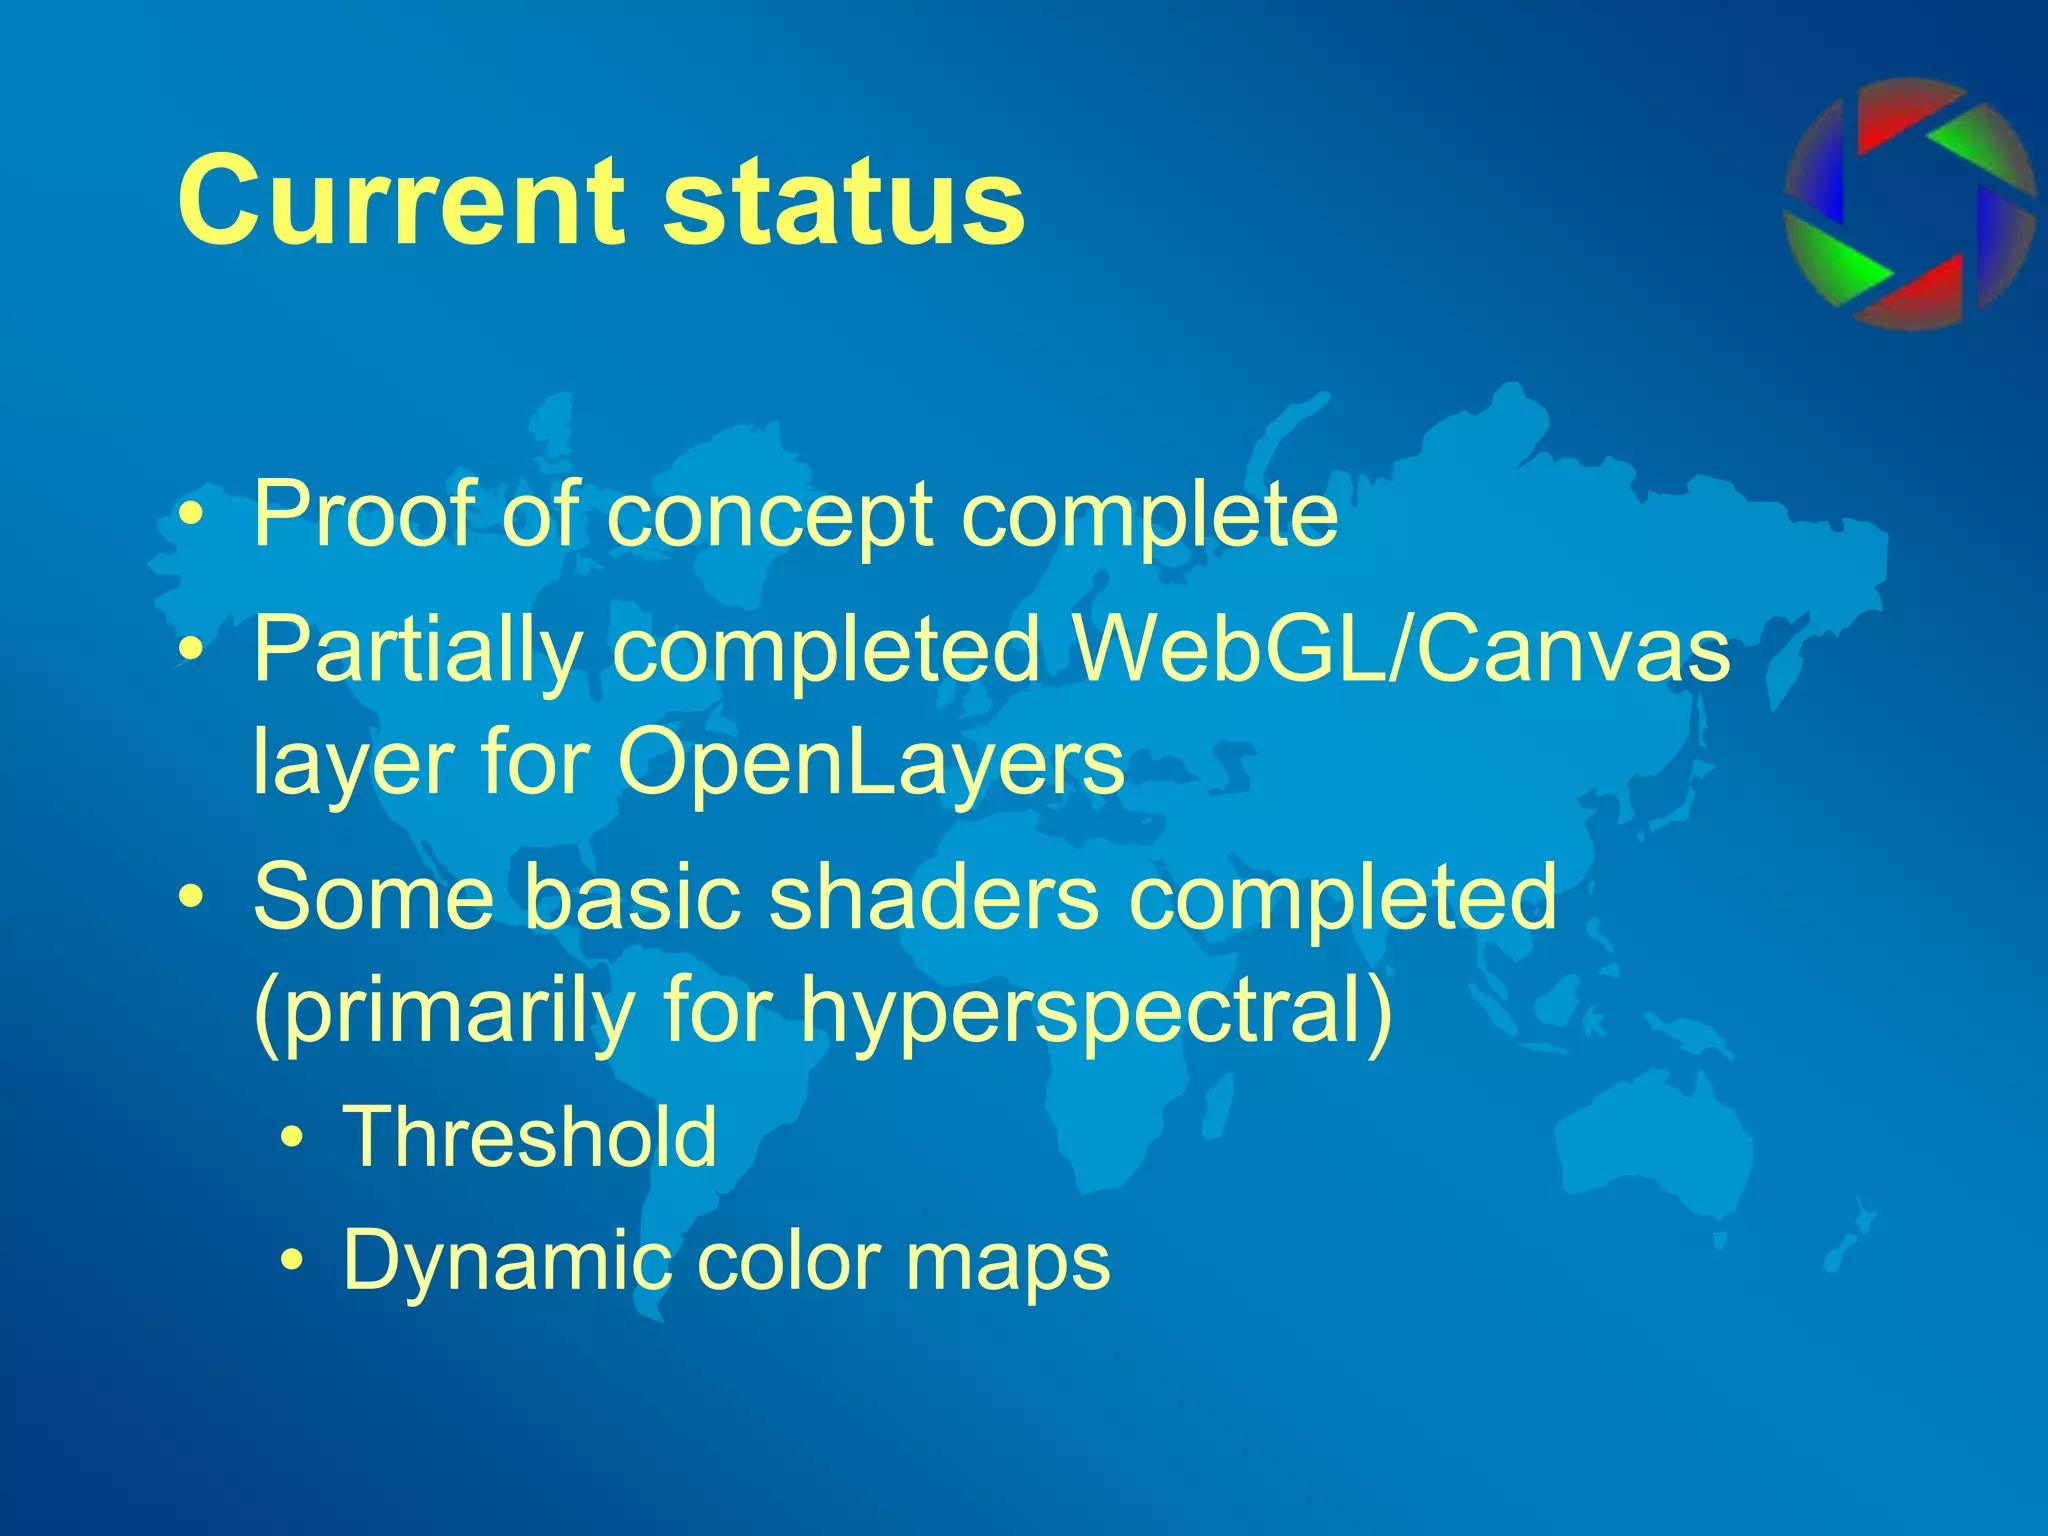
Accelerating remote sensing visualization with WebGLTrevor ClarkeOpticks DeveloperBall Aerospace & Technologies Corp.tclarke@ball.comhttp://opticks.org
Non-literal remote sensingMore than just picturesSpectralCalculate statistics and visualize relationshipsLIDARDynamic 3D visualizations
To the cloudWouldn’t it be cool if we could do this in a web browser?
To the cloudMaybe we canWMS – Context mapsWCS – RAW dataWPS – Process execution
To the cloudDoesn’t help with LIDARSpectral display often need lots of “tweaking” to find proper thresholds, etc.
To the cloudWCSWPSWMSAdjustthreshold
Desktop solutionA typical solution for desktop apps is to calculate the results data once and just change the displayThis is quite fast when all display operations happen in RAM and/or on the video card
A solution for the browserCalculate the results data once with WPS and transfer with WCSPerform visualization and compositing with Canvas/WebGL
A solution for the browserWCSWPSWCSWebGLTextureadjustmentHistogram
A solution for the browserIncludes material © 2010 DigitalGlobe, Inc. ALL RIGHTS RESERVED
Current statusProof of concept completePartially completed WebGL/Canvas layer for OpenLayersSome basic shaders completed (primarily for hyperspectral)ThresholdDynamic color maps
Current statusMultiple server side solutions being testedGeoServer for WMSMapServer for WCS and WPS results52north, PyWPS, and Zoo being evaluated for WPS
FuturePort to mobile platformsLittle to no WebGL support currentlyShaders and data flow are the sameJava (Android) or Objective-C (iOS) instead of JavaScriptgvSIG Mini Maps might be a good starting point
FutureSame technique useful for LIDAR (and other 3D display)Multiple shaders for a variety of display modes available from Opticks (my other project)
Q&APresentation available at http://slideshare.netTrevor ClarkeOpticks DeveloperBall Aerospace & Technologies Corp.tclarke@ball.comhttp://opticks.org

WebGL Lightning Talk FOSS4G 2011

  • 1.
    Accelerating remote sensingvisualization with WebGLTrevor ClarkeOpticks DeveloperBall Aerospace & Technologies Corp.tclarke@ball.comhttp://opticks.org
  • 2.
    Non-literal remote sensingMorethan just picturesSpectralCalculate statistics and visualize relationshipsLIDARDynamic 3D visualizations
  • 3.
    To the cloudWouldn’tit be cool if we could do this in a web browser?
  • 4.
    To the cloudMaybewe canWMS – Context mapsWCS – RAW dataWPS – Process execution
  • 5.
    To the cloudDoesn’thelp with LIDARSpectral display often need lots of “tweaking” to find proper thresholds, etc.
  • 6.
  • 7.
    Desktop solutionA typicalsolution for desktop apps is to calculate the results data once and just change the displayThis is quite fast when all display operations happen in RAM and/or on the video card
  • 8.
    A solution forthe browserCalculate the results data once with WPS and transfer with WCSPerform visualization and compositing with Canvas/WebGL
  • 9.
    A solution forthe browserWCSWPSWCSWebGLTextureadjustmentHistogram
  • 10.
    A solution forthe browserIncludes material © 2010 DigitalGlobe, Inc. ALL RIGHTS RESERVED
  • 11.
    Current statusProof ofconcept completePartially completed WebGL/Canvas layer for OpenLayersSome basic shaders completed (primarily for hyperspectral)ThresholdDynamic color maps
  • 12.
    Current statusMultiple serverside solutions being testedGeoServer for WMSMapServer for WCS and WPS results52north, PyWPS, and Zoo being evaluated for WPS
  • 13.
    FuturePort to mobileplatformsLittle to no WebGL support currentlyShaders and data flow are the sameJava (Android) or Objective-C (iOS) instead of JavaScriptgvSIG Mini Maps might be a good starting point
  • 14.
    FutureSame technique usefulfor LIDAR (and other 3D display)Multiple shaders for a variety of display modes available from Opticks (my other project)
  • 15.
    Q&APresentation available athttp://slideshare.netTrevor ClarkeOpticks DeveloperBall Aerospace & Technologies Corp.tclarke@ball.comhttp://opticks.org

Editor's Notes

  • #3 Briefly compare to more traditional GIS type of exploitationSpectral often involves thresholded displays
  • #5 Existing OGC standards and implementations (open source and commercial). WMS provides rendered “maps”, WCS provides raw imagery, WPS provides a method to execute remote processes and return new data
  • #6 LIDAR discussed briefly, not the primary topic of this talk but applicable to the techniqueNoise in statistics make it difficult to locate notes in common bimodal distributions or other (more random?) distributions present other problemsMethods exist to automatically locate good threshold values but they are not perfectTweaking involves adjustments to threshold which are often easier with “drag and view” feedback loop which require immediate changes in display
  • #7 “Traditional” processing would require recalculating threshold image and resending the new image across the network.Even with fast connections this is not a real-time process, especially with large images.
  • #9 Compositing performed in GLSL shader
  • #10 WMS pushes imagery for background.WCS->WPS->WCS calculates result and pushes 4-byte float data to WebGL textureWCS->WPS->JSON calculates histogram of result and pushes data to JavaScript plotting for histogramClick and visualize on JavaScript histogram changes threshold value and repaints WebGL without requesting new data
  • #12 Tested on Firefox and Chrome
  • #13 Zoo has promise but not quite there.52north is quite powerful and feature rich but learning curve is highPyWPS seems to be a good compromise, and I like Python
  • #14 Proof of concept already ported to Android
  • #15 Single pass shaders: color map, fast clipping, height exaggeration, etc.Multiple pass shaders: dynamic classification methods