Web Mapping usingGeoServer & OpenLayers
• Introduction to Web Mapping
• Modern Web GIS Architecture
• Client–Server–Cloud Model
2.
Introduction to WebMapping
• Web-based visualization of spatial data
• Interactive maps over the internet
• Applications in planning, disaster management,
smart cities
3.
Introduction to WebMapping
What is Web Mapping?
• Web Mapping is the process of creating,
publishing, and interacting with maps on the
internet using web technologies and GIS services.
• Maps are accessed through a web browser
• Users can zoom, pan, query, and analyze spatial
data online
• No need for standalone GIS software on client side
4.
Evolution of WebMapping
• Early static map images (JPEG, PNG)
• Dynamic maps using server-side GIS
• Interactive maps using JavaScript libraries
• Cloud-based and real-time Web GIS systems
Components of Web Mapping
• Client: Web browser (OpenLayers, Leaflet)
• Server: Map server (GeoServer)
• Data: Vector and raster spatial datasets
• Network: Internet / Cloud infrastructure
5.
Characteristics of WebMapping
• Interactive and user-friendly
• Platform independent
• Supports real-time data visualization
• Scalable for large users
• Applications of Web Mapping
• Urban and regional planning
• Disaster management
• Environmental monitoring
• Smart cities and navigation systems
• Land and water resource management
6.
• Advantages ofWeb Mapping
• Easy access to spatial data
• Centralized data management
• Cost-effective and scalable
• Supports decision-making systems
7.
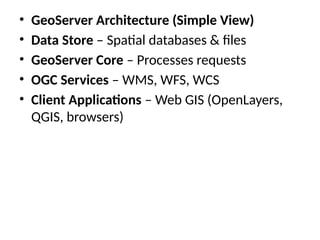
Modern Web GISArchitecture
• Client: Browser & OpenLayers
• Server: GeoServer & Web Server
• Cloud: Storage & Processing
8.
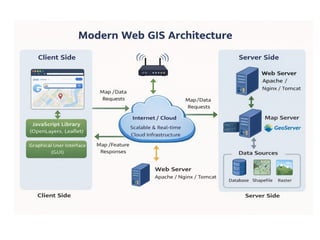
• Modern WebGIS Architecture
Modern Web GIS Architecture defines the
structure and interaction between different
components involved in delivering geospatial
data and services over the web.
9.
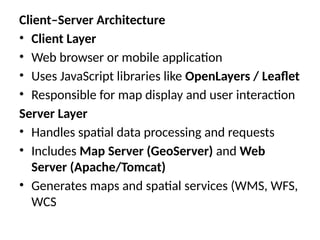
Client–Server Architecture
• ClientLayer
• Web browser or mobile application
• Uses JavaScript libraries like OpenLayers / Leaflet
• Responsible for map display and user interaction
Server Layer
• Handles spatial data processing and requests
• Includes Map Server (GeoServer) and Web
Server (Apache/Tomcat)
• Generates maps and spatial services (WMS, WFS,
WCS
10.
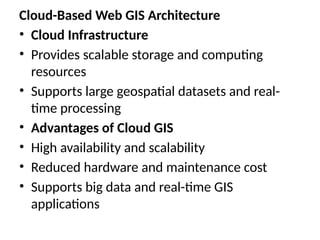
Cloud-Based Web GISArchitecture
• Cloud Infrastructure
• Provides scalable storage and computing
resources
• Supports large geospatial datasets and real-
time processing
• Advantages of Cloud GIS
• High availability and scalability
• Reduced hardware and maintenance cost
• Supports big data and real-time GIS
applications
11.
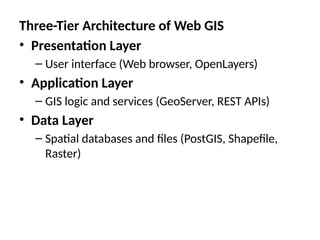
Three-Tier Architecture ofWeb GIS
• Presentation Layer
– User interface (Web browser, OpenLayers)
• Application Layer
– GIS logic and services (GeoServer, REST APIs)
• Data Layer
– Spatial databases and files (PostGIS, Shapefile,
Raster)
12.
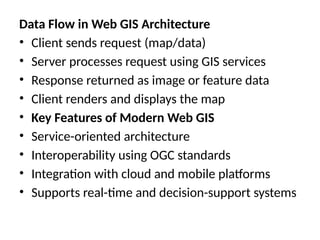
Data Flow inWeb GIS Architecture
• Client sends request (map/data)
• Server processes request using GIS services
• Response returned as image or feature data
• Client renders and displays the map
• Key Features of Modern Web GIS
• Service-oriented architecture
• Interoperability using OGC standards
• Integration with cloud and mobile platforms
• Supports real-time and decision-support systems
13.
• Applications
• Smartcity platforms
• Disaster monitoring systems
• Environmental and watershed management
• Urban planning and land administration
15.
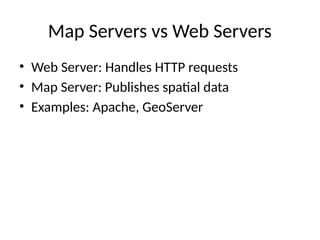
Map Servers vsWeb Servers
• Web Server: Handles HTTP requests
• Map Server: Publishes spatial data
• Examples: Apache, GeoServer
16.
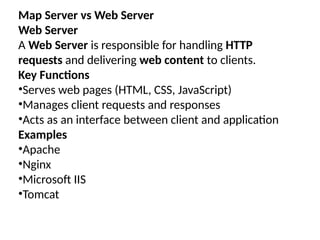
Map Server vsWeb Server
Web Server
A Web Server is responsible for handling HTTP
requests and delivering web content to clients.
Key Functions
•Serves web pages (HTML, CSS, JavaScript)
•Manages client requests and responses
•Acts as an interface between client and application
Examples
•Apache
•Nginx
•Microsoft IIS
•Tomcat
17.
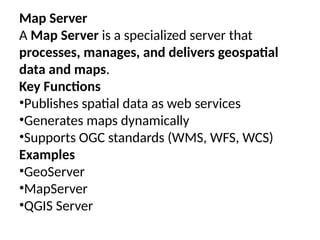
Map Server
A MapServer is a specialized server that
processes, manages, and delivers geospatial
data and maps.
Key Functions
•Publishes spatial data as web services
•Generates maps dynamically
•Supports OGC standards (WMS, WFS, WCS)
Examples
•GeoServer
•MapServer
•QGIS Server
18.
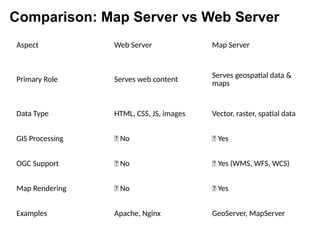
Aspect Web ServerMap Server
Primary Role Serves web content
Serves geospatial data &
maps
Data Type HTML, CSS, JS, images Vector, raster, spatial data
GIS Processing ❌ No ✅ Yes
OGC Support ❌ No ✅ Yes (WMS, WFS, WCS)
Map Rendering ❌ No ✅ Yes
Examples Apache, Nginx GeoServer, MapServer
Comparison: Map Server vs Web Server
19.
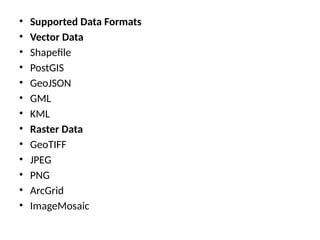
Geographic Data Formats
•Shapefile: Vector format
• Raster Data: Satellite images
• GeoJSON: Web-friendly format
20.
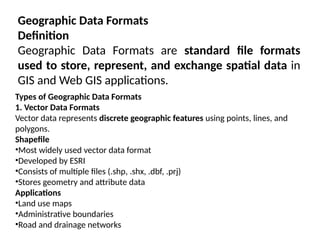
Geographic Data Formats
Definition
GeographicData Formats are standard file formats
used to store, represent, and exchange spatial data in
GIS and Web GIS applications.
Types of Geographic Data Formats
1. Vector Data Formats
Vector data represents discrete geographic features using points, lines, and
polygons.
Shapefile
•Most widely used vector data format
•Developed by ESRI
•Consists of multiple files (.shp, .shx, .dbf, .prj)
•Stores geometry and attribute data
Applications
•Land use maps
•Administrative boundaries
•Road and drainage networks
21.
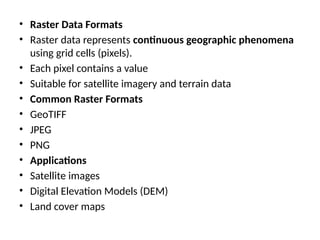
• Raster DataFormats
• Raster data represents continuous geographic phenomena
using grid cells (pixels).
• Each pixel contains a value
• Suitable for satellite imagery and terrain data
• Common Raster Formats
• GeoTIFF
• JPEG
• PNG
• Applications
• Satellite images
• Digital Elevation Models (DEM)
• Land cover maps
22.
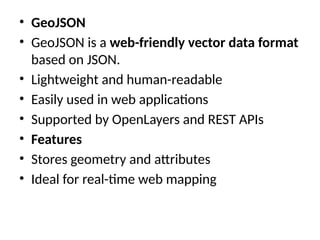
• GeoJSON
• GeoJSONis a web-friendly vector data format
based on JSON.
• Lightweight and human-readable
• Easily used in web applications
• Supported by OpenLayers and REST APIs
• Features
• Stores geometry and attributes
• Ideal for real-time web mapping
23.
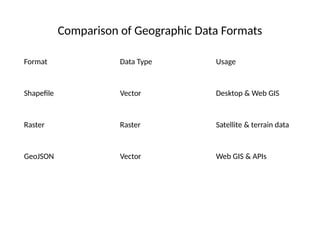
Comparison of GeographicData Formats
Format Data Type Usage
Shapefile Vector Desktop & Web GIS
Raster Raster Satellite & terrain data
GeoJSON Vector Web GIS & APIs
24.
Introduction to OpenLayers
•Open-source JavaScript library
• Creates interactive web maps
• Supports OGC services
25.
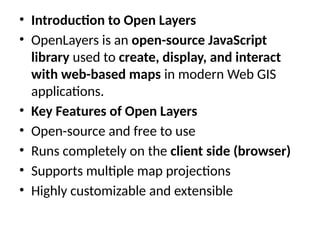
• Introduction toOpen Layers
• OpenLayers is an open-source JavaScript
library used to create, display, and interact
with web-based maps in modern Web GIS
applications.
• Key Features of Open Layers
• Open-source and free to use
• Runs completely on the client side (browser)
• Supports multiple map projections
• Highly customizable and extensible
26.
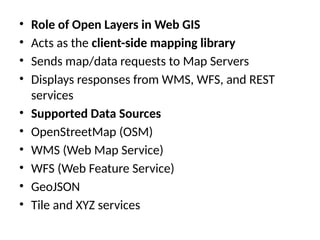
• Role ofOpen Layers in Web GIS
• Acts as the client-side mapping library
• Sends map/data requests to Map Servers
• Displays responses from WMS, WFS, and REST
services
• Supported Data Sources
• OpenStreetMap (OSM)
• WMS (Web Map Service)
• WFS (Web Feature Service)
• GeoJSON
• Tile and XYZ services
27.
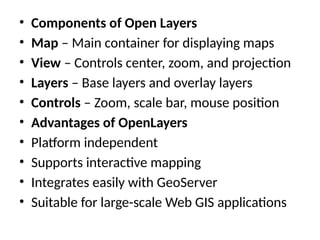
• Components ofOpen Layers
• Map – Main container for displaying maps
• View – Controls center, zoom, and projection
• Layers – Base layers and overlay layers
• Controls – Zoom, scale bar, mouse position
• Advantages of OpenLayers
• Platform independent
• Supports interactive mapping
• Integrates easily with GeoServer
• Suitable for large-scale Web GIS applications
29.
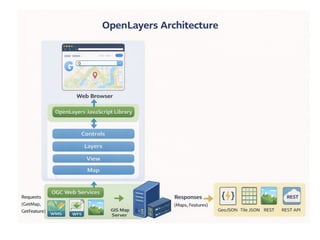
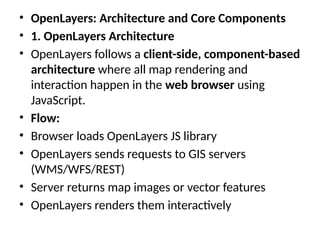
• OpenLayers: Architectureand Core Components
• 1. OpenLayers Architecture
• OpenLayers follows a client-side, component-based
architecture where all map rendering and
interaction happen in the web browser using
JavaScript.
• Flow:
• Browser loads OpenLayers JS library
• OpenLayers sends requests to GIS servers
(WMS/WFS/REST)
• Server returns map images or vector features
• OpenLayers renders them interactively
• Controls inOpen Layers
• What are Controls?
• Controls are UI elements used to interact with the
map.
• Common Controls
• Zoom control
• Scale line
• Mouse position
• Fullscreen
• Purpose
• Improve user interaction
• Enhance map usability
32.
• Overlays inOpen Layers
• What is an Overlay?
• An overlay is used to display information on top of
the map.
• Examples
• Popups
• Tooltips
• Feature information windows
• Purpose
• Display attribute data
• Show location-based information dynamically
33.
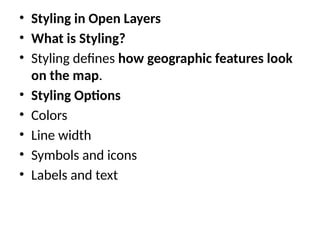
• Styling inOpen Layers
• What is Styling?
• Styling defines how geographic features look
on the map.
• Styling Options
• Colors
• Line width
• Symbols and icons
• Labels and text
34.
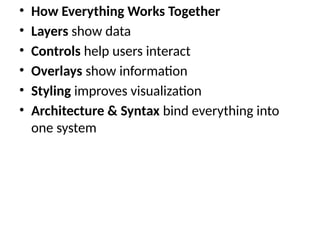
• How EverythingWorks Together
• Layers show data
• Controls help users interact
• Overlays show information
• Styling improves visualization
• Architecture & Syntax bind everything into
one system
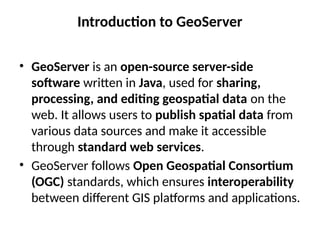
Introduction to GeoServer
•GeoServer is an open-source server-side
software written in Java, used for sharing,
processing, and editing geospatial data on the
web. It allows users to publish spatial data from
various data sources and make it accessible
through standard web services.
• GeoServer follows Open Geospatial Consortium
(OGC) standards, which ensures interoperability
between different GIS platforms and applications.
37.
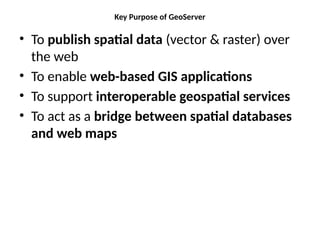
Key Purpose ofGeoServer
• To publish spatial data (vector & raster) over
the web
• To enable web-based GIS applications
• To support interoperable geospatial services
• To act as a bridge between spatial databases
and web maps
38.
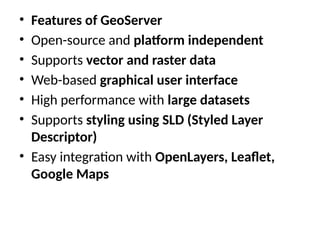
• Features ofGeoServer
• Open-source and platform independent
• Supports vector and raster data
• Web-based graphical user interface
• High performance with large datasets
• Supports styling using SLD (Styled Layer
Descriptor)
• Easy integration with OpenLayers, Leaflet,
Google Maps
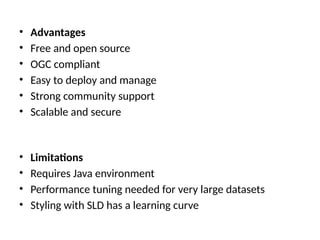
• Advantages
• Freeand open source
• OGC compliant
• Easy to deploy and manage
• Strong community support
• Scalable and secure
• Limitations
• Requires Java environment
• Performance tuning needed for very large datasets
• Styling with SLD has a learning curve
43.
Publishing Data inGeoServer
• Add data stores
• Configure layers & styles
• Publish as WMS/WFS/WCS
44.
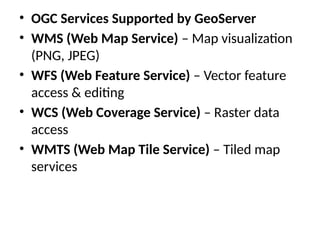
OGC Web Services
•WMS: Map images
• WFS: Vector features
• WCS: Raster data