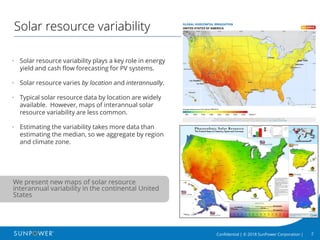
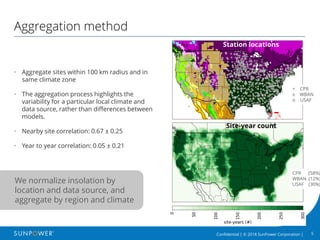
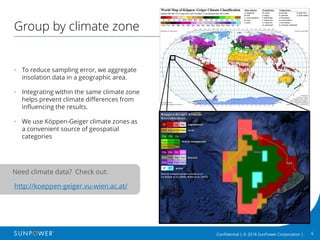
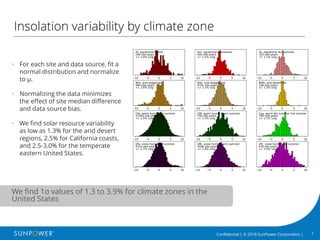
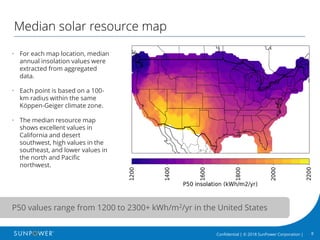
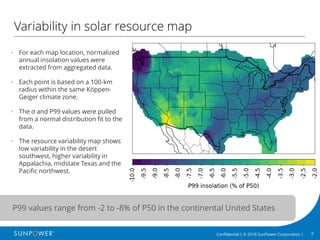
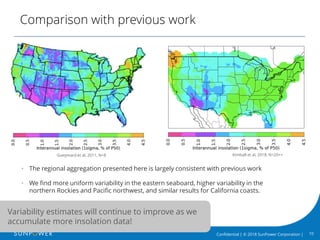
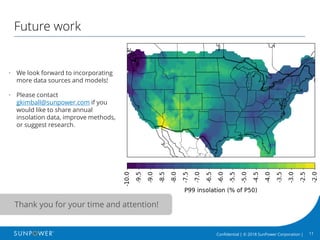
This document presents new maps of solar resource interannual variability in the continental United States. It summarizes that solar resource variability plays a key role in energy yield and cash flow forecasting for PV systems. It then describes how the authors aggregated solar resource data from multiple sources by region and climate zone to reduce sampling errors and present more accurate estimates of interannual variability, given the limited available data. The authors find solar resource variability ranges from 1.3% to 3.9% across different climate zones in the US based on their analysis.