Download to read offline

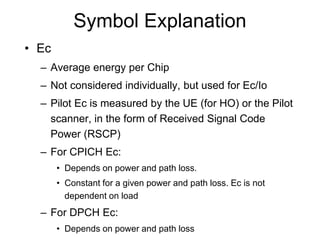
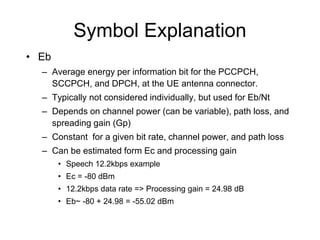
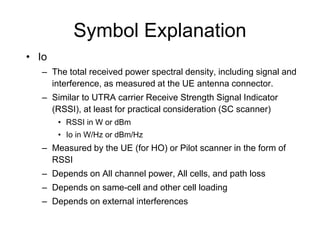
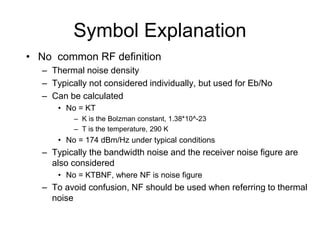
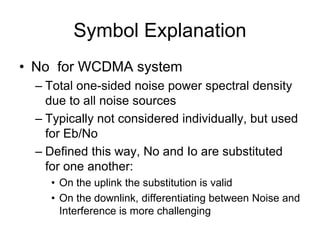
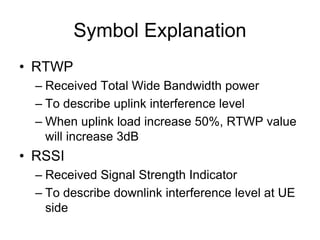
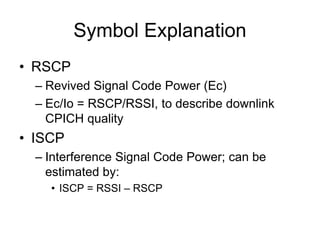
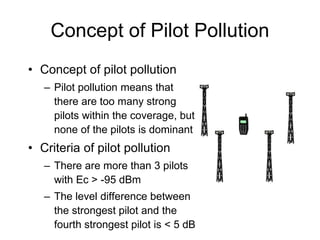
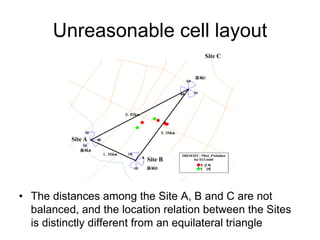
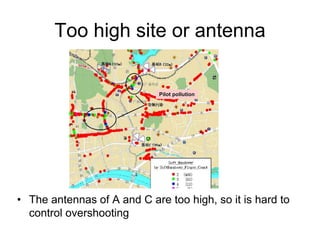
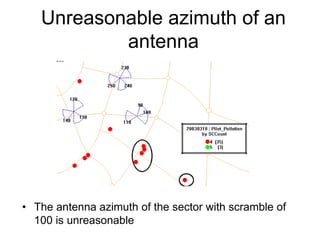
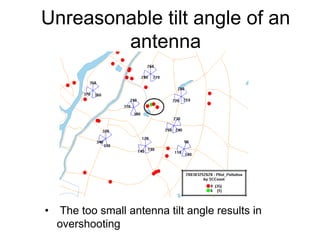
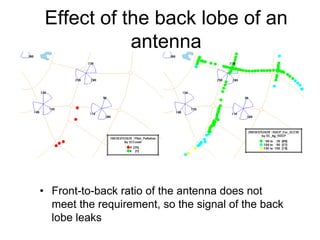

This document defines and explains key symbols and concepts related to UMTS networks. It discusses: 1) Symbols such as Ec, Eb, Io, No, and their meanings in relation to energy, power, interference, and noise. 2) The concept of pilot pollution which occurs when there are too many strong pilot signals within coverage but none is dominant, negatively impacting network performance. 3) Causes of pilot pollution including unreasonable cell layout, antennas being too high, improper antenna azimuth or tilt, and ambient environmental effects. 4) Ways to reduce pilot pollution such as optimizing the network plan, proper site selection, and adjusting antenna parameters and transmit powers.


![[Deck] What's New in Spark-Iceberg Integration via DSV2.pptx](https://cdn.slidesharecdn.com/ss_thumbnails/deckwhatsnewinspark-icebergintegrationviadsv2-260210005337-25955b12-thumbnail.jpg?width=640&height=640&fit=bounds)


