Download to read offline


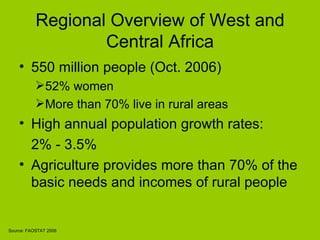
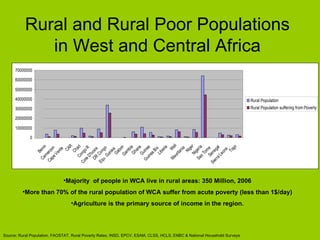
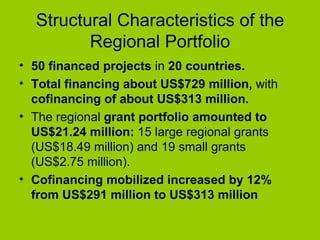
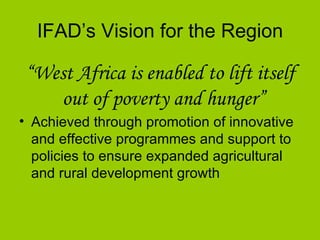
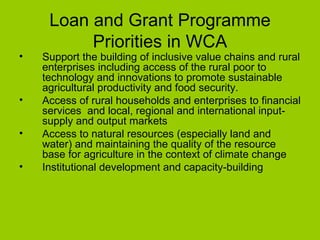


The document summarizes West and Central Africa's regional portfolio and IFAD's management plan for the region. It notes that over 70% of the 550 million people in the region live in rural areas, with most dependent on agriculture. IFAD's 50 projects in the region total $729 million and aim to promote agricultural growth, rural enterprises, access to markets and resources. IFAD's management plan focuses on better country and project design, implementation, knowledge management, and partnerships to achieve its vision of enabling the region to lift itself out of poverty.


