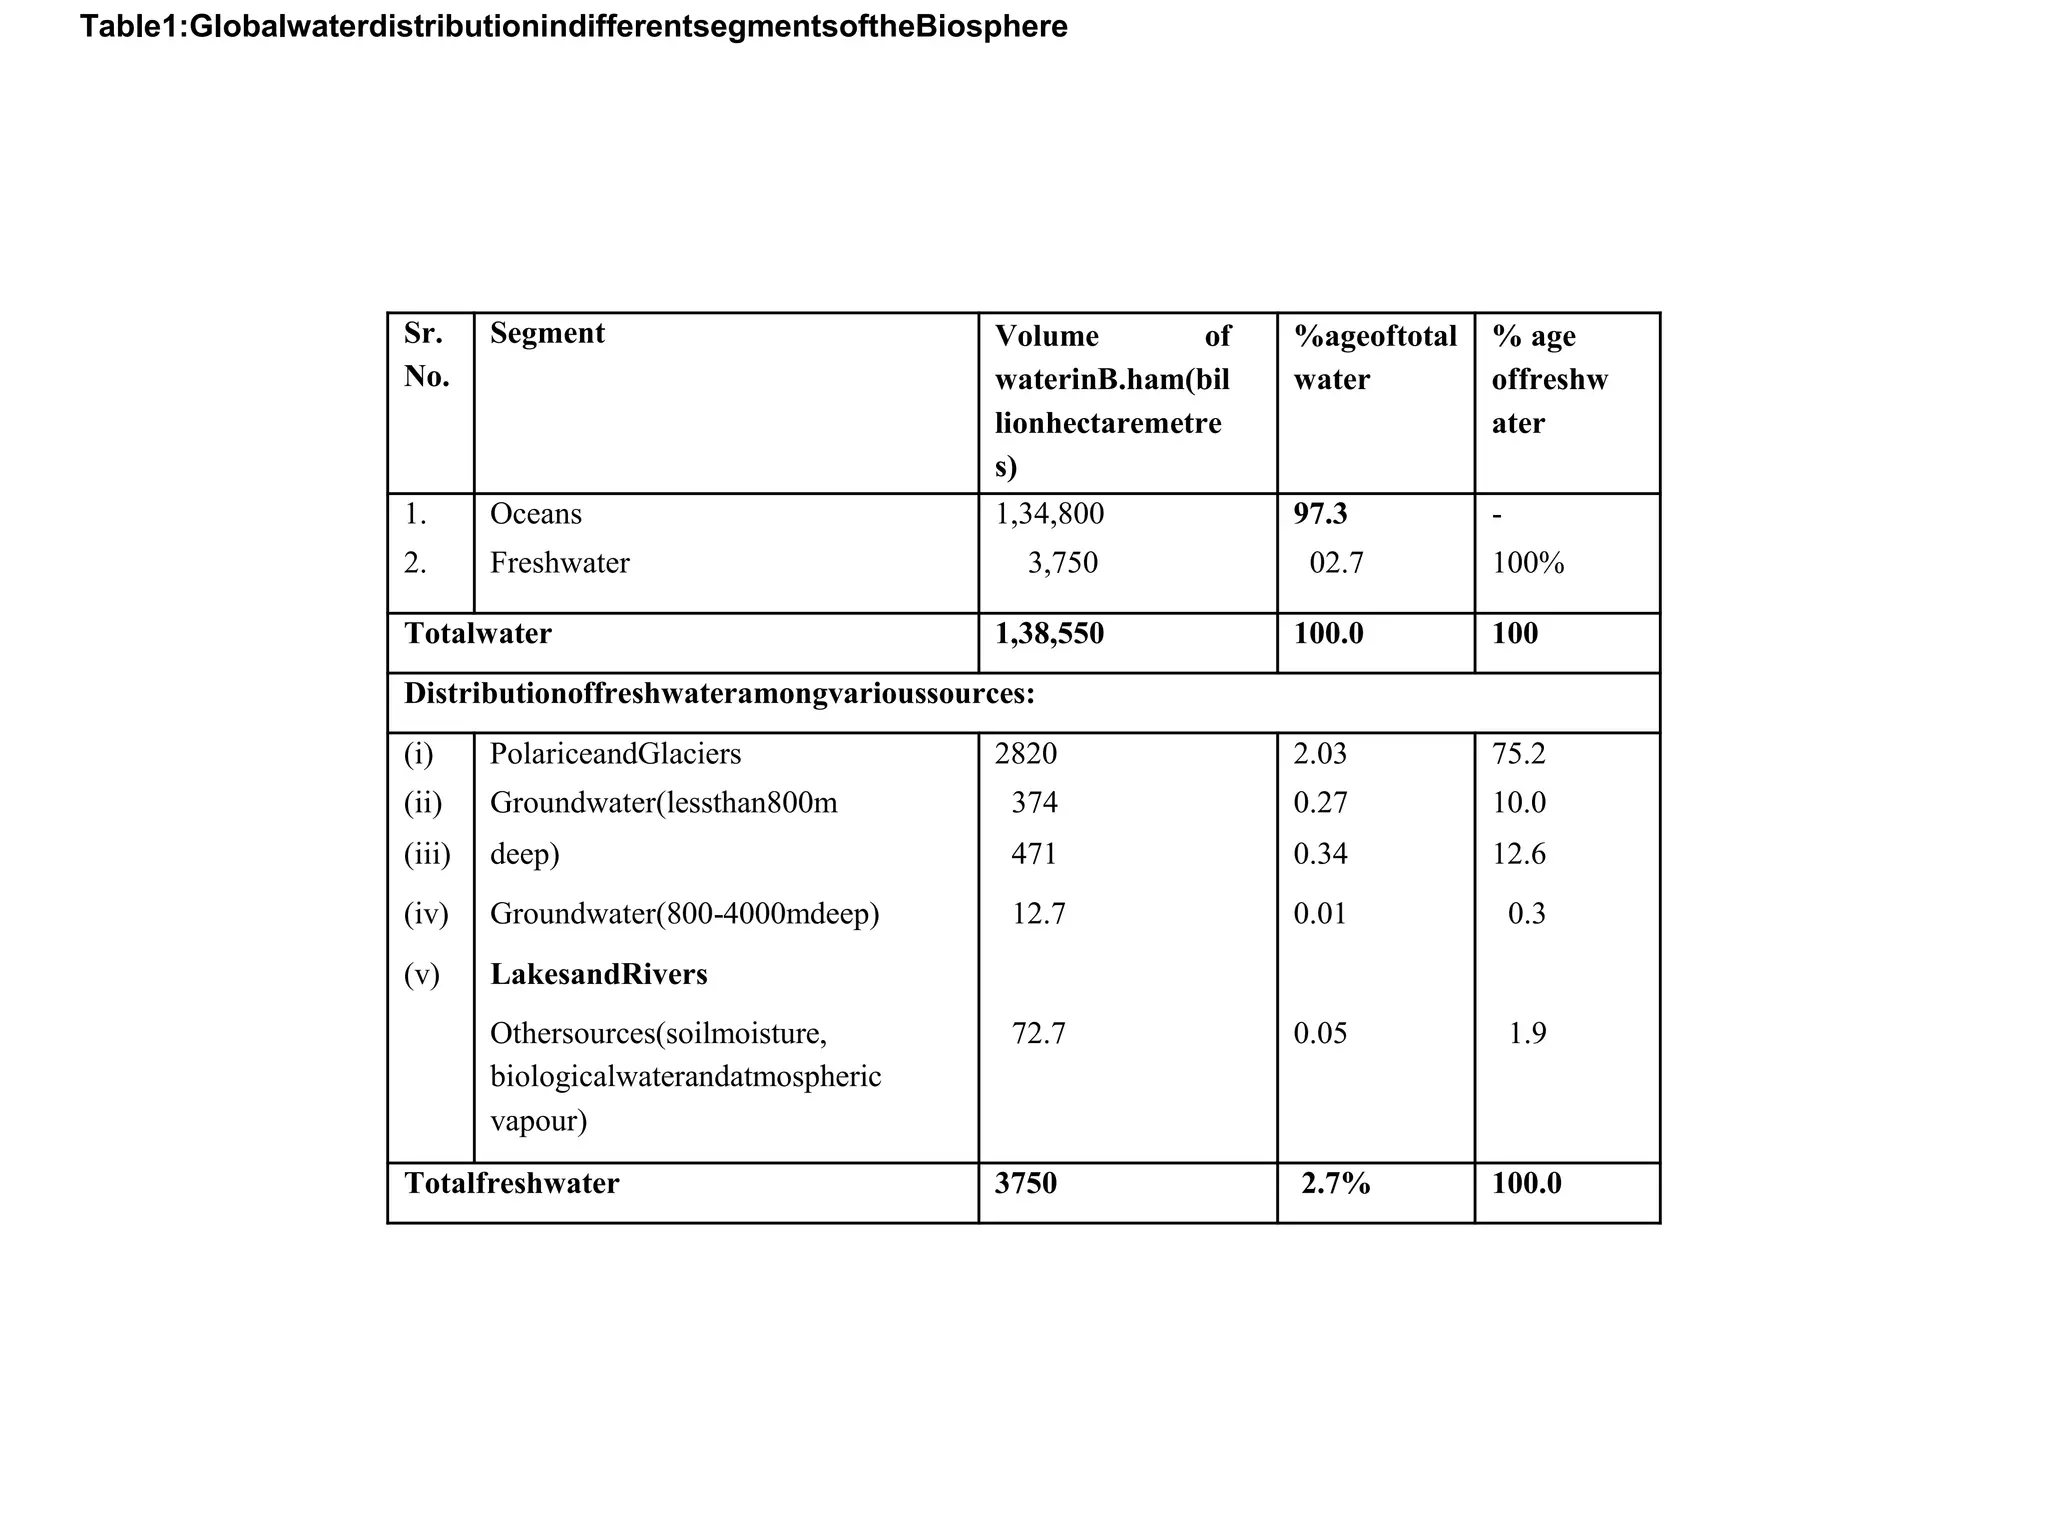
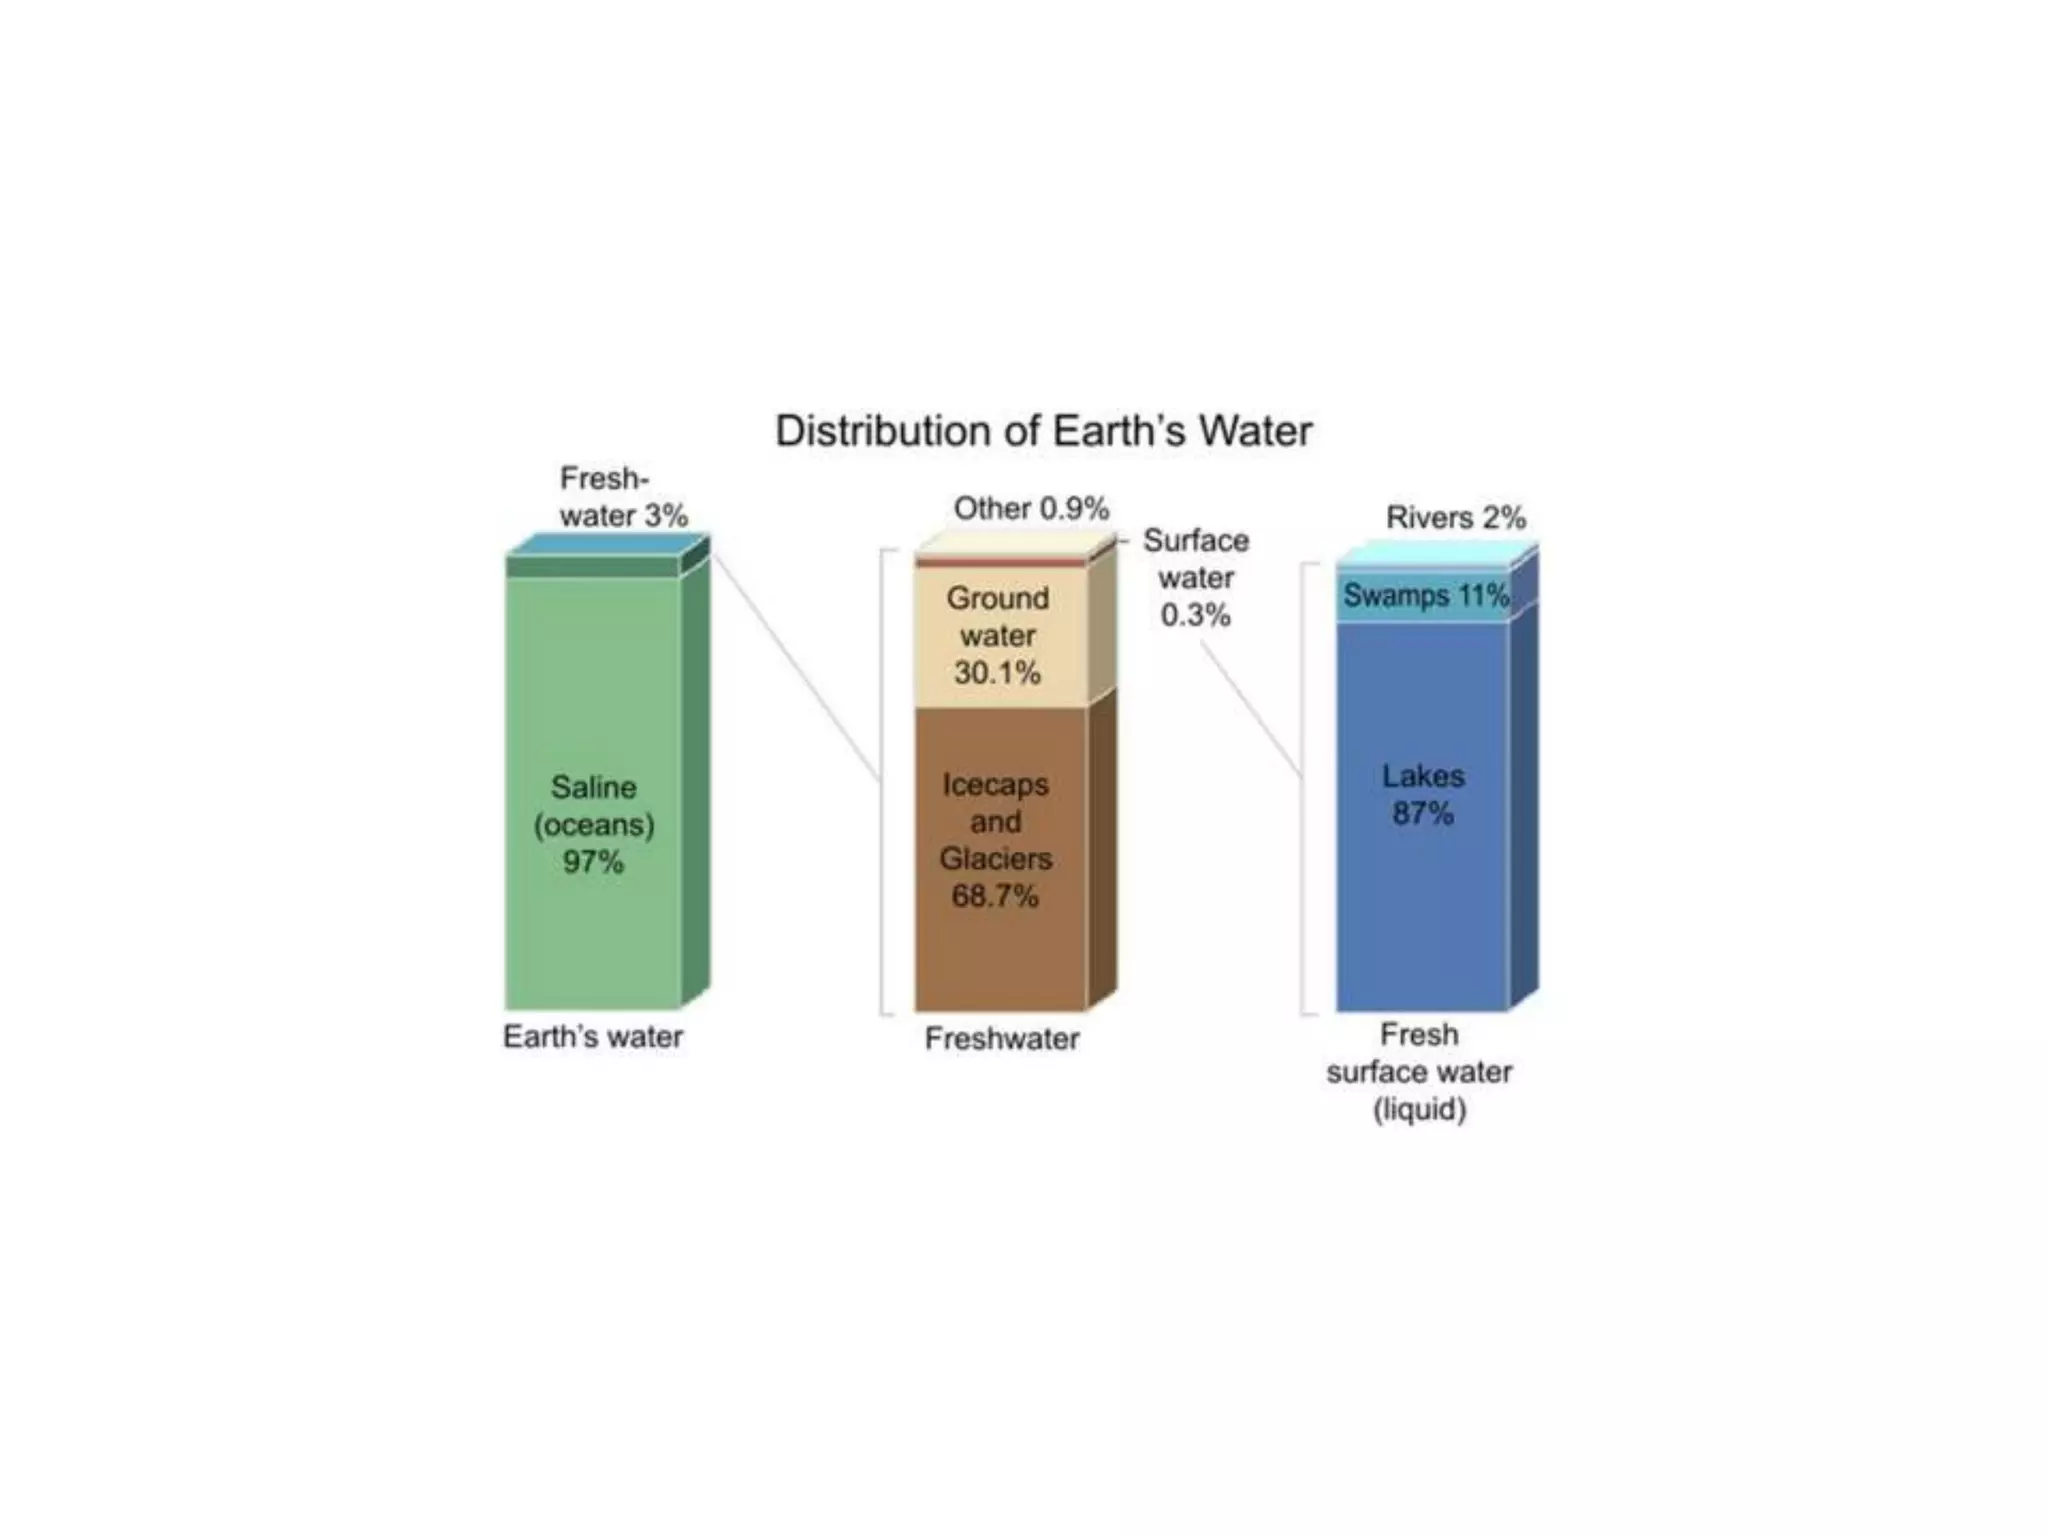
Water resources are natural resources of water that are potentially useful for
humans,[1] for example as a source of drinking water supply or irrigation water.
97% of the water on the Earth is salt water and only three percent is fresh
water; slightly over two thirds of this is frozen in glaciers and polar ice
caps.[2] The remaining unfrozen freshwater is found mainly as groundwater,
with only a small fraction present above ground or in the air.
Natural sources of fresh water include surface water, under river
flow, groundwater
and frozen water. Artificial sources of fresh water can include treated
wastewater
(wastewater reuse) and desalinated seawater. Human uses of water
resources include agricultural
, industrial, household, recreational and environmental activities.
Natural sources of fresh water include surface water, under river
flow, groundwater and frozen water
. Artificial sources of fresh water can include treated wastewater
(wastewater reuse)
and desalinated seawater. Human uses of water resources
include agricultural, industrial,
household, recreational and environmental activities.
Sr.
No.
Segment Volume of
waterinB.ham(bil
lionhectaremetre
s)
%ageoftotal
water
% age
offreshw
ater
1. Oceans 1,34,800 97.3 -
2. Freshwater 3,750 02.7 100%
Totalwater 1,38,550 100.0 100
Distributionoffreshwateramongvarioussources:
(i) PolariceandGlaciers 2820 2.03 75.2
(ii) Groundwater(lessthan800m 374 0.27 10.0
(iii) deep) 471 0.34 12.6
(iv) Groundwater(800-4000mdeep) 12.7 0.01 0.3
(v) LakesandRivers
Othersources(soilmoisture,
biologicalwaterandatmospheric
72.7 0.05 1.9
vapour)
Totalfreshwater 3750 2.7% 100.0
Table1:GlobalwaterdistributionindifferentsegmentsoftheBiosphere
WATERBUDGET:-
Water budgeting is a principal activity for proper management of water
resources. Actually ‘waterbudget’ is an accounting of water inputs, outputs
and storage of water e.g.in lithosphere, atmosphere and oceans. Hence,
Water Budget means – the balance between the available water in the
country and the water under use. Hence, it is balance between the accessible
water and the water under utilization.The solar radiations evaporate water
from oceans and land and transpiration of water from plants introduce
moisture into the atmosphere which returns to earth as precipitation. It is
estimated that about 525100 cubic kms water introduce into the atmosphere
and from this about 21.6% water vapors comes to earth as precipitation over
land surface. The water budget calculation includes the different mechanism
used in water cycle e.g. precipitation, evaporation, evapotranspiration,
surface and subsurface flow. The table presents the Annual water budget of
planet earth.
Sr.No. Particulars Waterincubickms
1 Totalevaporationfromseasurface 4,52,600
2 Totalevaporationfromlandsurface 72,500
3 Totalprecipitationonoceansurface 4,11,600
4 Totalprecipitationonlandsurface 1,13,500
5 Totalsurfaceandgroundwaterflow 41,000
6 Totalevaporationfromlandandseasurface 5,25,100
7 Totalprecipitationonlandandseasurface 5,25,100
Annual water budget of planet earth
It is evident from Table: 2 that world’s oceans impart about 4,52,600 cubic
kms water annually to atmosphere while get only 4,11,600 cubic kms as
precipitation. However, this deficit is balanced by 41,000 cubic kms of surface
and subsurface runoff, which they receive. This excess water ultimately flows
back to oceans under the influence of gravity (Roggers, 1991). Moreover, the
amount of water presents in oceans, on land, groundwater and water present
in atmosphere in vapors form etc. are in a state of dynamic equilibrium.

Water resources .pptx

  • 2.
    Water resources arenatural resources of water that are potentially useful for humans,[1] for example as a source of drinking water supply or irrigation water. 97% of the water on the Earth is salt water and only three percent is fresh water; slightly over two thirds of this is frozen in glaciers and polar ice caps.[2] The remaining unfrozen freshwater is found mainly as groundwater, with only a small fraction present above ground or in the air.
  • 3.
    Natural sources offresh water include surface water, under river flow, groundwater and frozen water. Artificial sources of fresh water can include treated wastewater (wastewater reuse) and desalinated seawater. Human uses of water resources include agricultural , industrial, household, recreational and environmental activities.
  • 4.
    Natural sources offresh water include surface water, under river flow, groundwater and frozen water . Artificial sources of fresh water can include treated wastewater (wastewater reuse) and desalinated seawater. Human uses of water resources include agricultural, industrial, household, recreational and environmental activities.
  • 5.
    Sr. No. Segment Volume of waterinB.ham(bil lionhectaremetre s) %ageoftotal water %age offreshw ater 1. Oceans 1,34,800 97.3 - 2. Freshwater 3,750 02.7 100% Totalwater 1,38,550 100.0 100 Distributionoffreshwateramongvarioussources: (i) PolariceandGlaciers 2820 2.03 75.2 (ii) Groundwater(lessthan800m 374 0.27 10.0 (iii) deep) 471 0.34 12.6 (iv) Groundwater(800-4000mdeep) 12.7 0.01 0.3 (v) LakesandRivers Othersources(soilmoisture, biologicalwaterandatmospheric 72.7 0.05 1.9 vapour) Totalfreshwater 3750 2.7% 100.0 Table1:GlobalwaterdistributionindifferentsegmentsoftheBiosphere
  • 6.
    WATERBUDGET:- Water budgeting isa principal activity for proper management of water resources. Actually ‘waterbudget’ is an accounting of water inputs, outputs and storage of water e.g.in lithosphere, atmosphere and oceans. Hence, Water Budget means – the balance between the available water in the country and the water under use. Hence, it is balance between the accessible water and the water under utilization.The solar radiations evaporate water from oceans and land and transpiration of water from plants introduce moisture into the atmosphere which returns to earth as precipitation. It is estimated that about 525100 cubic kms water introduce into the atmosphere and from this about 21.6% water vapors comes to earth as precipitation over land surface. The water budget calculation includes the different mechanism used in water cycle e.g. precipitation, evaporation, evapotranspiration, surface and subsurface flow. The table presents the Annual water budget of planet earth.
  • 7.
    Sr.No. Particulars Waterincubickms 1Totalevaporationfromseasurface 4,52,600 2 Totalevaporationfromlandsurface 72,500 3 Totalprecipitationonoceansurface 4,11,600 4 Totalprecipitationonlandsurface 1,13,500 5 Totalsurfaceandgroundwaterflow 41,000 6 Totalevaporationfromlandandseasurface 5,25,100 7 Totalprecipitationonlandandseasurface 5,25,100 Annual water budget of planet earth
  • 8.
    It is evidentfrom Table: 2 that world’s oceans impart about 4,52,600 cubic kms water annually to atmosphere while get only 4,11,600 cubic kms as precipitation. However, this deficit is balanced by 41,000 cubic kms of surface and subsurface runoff, which they receive. This excess water ultimately flows back to oceans under the influence of gravity (Roggers, 1991). Moreover, the amount of water presents in oceans, on land, groundwater and water present in atmosphere in vapors form etc. are in a state of dynamic equilibrium.