SlideShare a Scribd company logo
Sustainable Strategies for Energy
and Stormwater Management
Motivation
Washington, D.C. has an ambitious goal to
become the healthiest, greenest, and most
livable city in the United States by 2032.
Among their many sustainability goals,
reducing building energy consumption
and effectively managing stormwater can
have immediate benefits to the climate and
the local environment. Therefore, the
District aims to retrofit 100% of existing
commercial and multi-family buildings to
net-zero energy standards, and to capture
rainwater on-site across 75% of the
District’s landscape.
Achieving these goals requires a
combination of policy, planning, and
design innovations. The DowntownDC
Business Improvement District (BID),
Interface Engineering Consultants, and the
Department of Energy and Environment
(DOEE) need a data-rich City Model that
captures the energy and water flows within
the District to help them measure and
predict sustainability benefits.
“We want to use the model to test multiple
'what-if' scenarios for policy changes,
technology adoption, or behavior change,"
explains Bill Updike, Chief, Green Building &
Climate Branch, DOEE. "For example, how
much energy will lighting retrofits save and
which buildings should we target? How
much stormwater runoff could we reduce
with city-wide green infrastructure?”
To test strategies for the District to meet
their goals, the BID partnered with
Autodesk and used the Downtown
ecoDistrict as a lab for sustainable
development.
Investing in Green Infrastructure
When it rains in cities, stormwater washes
contaminants from the streets into either
the combined sewer system or directly into
local water bodies. However green
infrastructure, which retains and filters
stormwater on-site, can dramatically
reduce pollution from the runoff. To
accelerate adoption of this approach, DOEE
started the first market for Stormwater
Retention Credits. Owners gain credits for
installing green infrastructure and sell the
credits to developers who need them to
comply with regulations.
To demonstrate these benefits to
stakeholders, engineers can use Autodesk’s
Green Stormwater Infrastructure (GSI) tool
to design and analyze on-site retention.
The software automatically calculates
stormwater metrics needed for code
compliance and the dollar value of
stormwater credits attained. Using the re-
design of the historic Franklin Park as an
example, GSI showed how rain gardens,
bioswales, etc. can reduce runoff volumes,
and how many credits are generated.
Analyzing the impacts of district-scale
green infrastructure in the BID helps the
District meet their city-wide sustainability
goals. First, GSI determined that the
ecoDistrict must manage 2.5 million cubic
feet of stormwater during a typical storm.
Then it simulated how green infrastructure
could manage the stormwater on-site. One
analysis showed that a 35% reduction in
runoff may be achievable by converting
45% of hard surfaces to natural cover and
adding green roofs to 30% of the BID's
buildings.
Figure 1: 3D model of Washington, D.C. created in the cloud using Autodesk Infraworks® 360.
Autodesk Sustainability Solutions for Cities Washington, D.C.
ORGANIZATIONS
SOFTWARE
Autodesk® InfraWorks® 360
Green Stormwater Infrastructure Extension
for InfraWorks® 360
Autodesk® Rapid Energy Modeling
for Existing Buildings
Autodesk® Green Building Studio®
AutoCASE®
DowntownDC Business Improvement District (BID)
D.C. Department of Energy and Environment
(DOEE)
Interface Engineering Consultants
Dewberry Engineering Consultants
Key Findings
• Tools for planning district-scale
green stormwater infrastructure can
help achieve Sustainable DC goal to
capture rainwater using 75% of
landscape.
• District-scale Rapid Energy Modeling
identifies which buildings in
DowntownDC ecoDistrict to target
for energy incentives.
• Automated triple bottom line
analysis shows how combining
underground parking with
stormwater storage in the National
Mall can reduce traffic congestion
and flooding.
Figure 2: DowntownDC ecoDistrict was used as a lab
to test the impacts of city-wide green infrastructure
and energy retrofits
Autodesk Sustainability Solutions empower
Washington, D.C. to implement ambitious energy
and stormwater management goals
Figure 4: AutoCASE shows the triple bottom line benefits of underground stormwater cisterns and parking
spaces, which reduce flooding and congestion at the National Mall
Conclusions
Washington, D.C. has set aggressive goals
to reduce their environmental footprint,
combat climate change, and improve the
quality of life for their citizens. Policy-
makers and engineers are increasingly
relying on data, analysis, and simulation
to make critical infrastructure decisions
that will have long term economic, social
and environmental implications.
With the aid of Autodesk’s InfraWorks®
360 and a suite of sustainability analysis
tools, the District was able to play out
scenarios for how to attain these agenda-
setting goals, carving a path for smarter
use of technology that other cities can
adopt.
District-scale Rapid Energy Modeling
shows retrofit potential
According to the U.S. Energy Information
Administration, the commercial building
sector in the District accounts for 66% of
end use energy consumption. While
DOEE gathers annual data through its
landmark energy and water
benchmarking law, there are no clear
strategies on which buildings should be
retrofitted first, and the law only applies
to buildings that are greater than 50,000
square feet.
The Downtown ecoDistrict applied Rapid
Energy Modeling for Existing Buildings
(REM), Autodesk’s virtual energy
assessment tool, to quickly identify which
buildings need retrofits. REM used
satellite images and weather data to
generate energy simulations for 40
buildings (25 Offices, 5 Multifamily, 5
Hotels, and 5 Schools). In only 5-8 minutes
per building, REM analysis showed which
building systems likely consume the most
energy, and how performance upgrades
can save on energy costs.
The sample of 25 offices showed that
glazing, lighting efficiency, and plug loads
are most sensitive to energy consump-
tion, and are good candidates for retrofit.
Figure 3 shows how policy-makers can set
retrofit targets to estimate potential
energy cost savings from improved
building systems.
District-scale REM analysis allows policy-
makers to predict the impacts of energy
retrofits, create data-driven policy
measures, and develop investment
strategies.
Figure 3: REM analysis shows which building systems to
retrofit and potential cost savings
Solving flooding and congestion in the
National Mall
Washington, D.C. residents are all too
familiar with flooding and congestion in
the National Mall. Tour buses that idle
along the streets cause traffic problems,
pollute the air, and limit parking. In 2006 a
major storm flooded many prominent
museums and caused damages that cost
millions to repair. To solve these problems
and improve the experience of the
National Mall, Dewberry engineering
consultants proposed a multipurpose
infrastructure solution.
In crafting their unconventional design
Dewberry used AutoCASE®, a triple
bottom line analysis tool from Autodesk
partner Impact Infrastructure, to justify a
project that meets the triple bottom line.
This entailed green space on the surface
level, moving parking below ground, and
storing stormwater in an underground
irrigation cistern (shown in Figure 4).
AutoCASE showed how a comprehensive
design with higher upfront costs was
more attractive once the full range of
social, environmental, and economic
benefits were taken into consideration.
“We want to use the model to test multiple 'what-if' scenarios for policy
changes, technology adoption, or behavior change," explains Bill Updike, Chief,
Green Building & Climate Branch, DOEE. "For example, how much energy will
lighting retrofits save and which buildings should we target? How much
stormwater runoff could we reduce with city-wide green infrastructure?”
Bill Updike, Chief, Green Building & Climate Branch, Department of Energy and Environment
These results are based on third party data, have not been fully validated and may contain material errors. Autodesk makes no representations or warranties,
including with respect to their reliability, accuracy, completeness or validity. If you use these results, you agree to waive, release and hold harmless Autodesk and its
suppliers and licensors from any and all liability related to such use. YOUR USE OF THESE RESULTS IS AT YOUR OWN RISK. Autodesk, the Autodesk logo, InfraWorks
360, Green Building Studio, Green Stormwater Infrastructure Extension for InfraWorks 360 are registered trademarks or trademarks of Autodesk, Inc., and/or its
subsidiaries and/or affiliates in the USA and/or other countries. All other brand names, product names, or trademarks belong to their respective holders. Autodesk
reserves the right to alter product and services offerings, and specifications and pricing at any time without notice, and is not responsible for typographical or
graphical errors that may appear in this document. © 2015 Autodesk, Inc. All rights reserved.
Autodesk Sustainability Solutions for Cities Washington, D.C.

More Related Content

What's hot

Net zero energy and beyond
Net zero energy and beyondNet zero energy and beyond
Net zero energy and beyondJim Schwartz
 
1 s2.0-s1876610217308007-main
1 s2.0-s1876610217308007-main1 s2.0-s1876610217308007-main
1 s2.0-s1876610217308007-mainANANDU KB
 
Johnson Controls - Building Efficiency Fact Sheet
Johnson Controls - Building Efficiency Fact SheetJohnson Controls - Building Efficiency Fact Sheet
Johnson Controls - Building Efficiency Fact SheetJohnsonControls
 
Toward Energy Management 4.0 – Delivering An Enterprise-wide Energy Managemen...
Toward Energy Management 4.0 – Delivering An Enterprise-wide Energy Managemen...Toward Energy Management 4.0 – Delivering An Enterprise-wide Energy Managemen...
Toward Energy Management 4.0 – Delivering An Enterprise-wide Energy Managemen...Yokogawa1
 
Smart City - Cornerstone of Efficiency - V2
Smart City - Cornerstone of Efficiency - V2Smart City - Cornerstone of Efficiency - V2
Smart City - Cornerstone of Efficiency - V2Schneider Electric India
 
Vinod Khosla: “Smart Grid” or “Smart Hype” — An Analytical Perspective From a...
Vinod Khosla: “Smart Grid” or “Smart Hype” — An Analytical Perspective From a...Vinod Khosla: “Smart Grid” or “Smart Hype” — An Analytical Perspective From a...
Vinod Khosla: “Smart Grid” or “Smart Hype” — An Analytical Perspective From a...VentureBeat
 
Revue de presse IoT / Data du 13/03/2017
Revue de presse IoT / Data du 13/03/2017Revue de presse IoT / Data du 13/03/2017
Revue de presse IoT / Data du 13/03/2017Romain Bochet
 
Caba Green Buildings Conf 2006
Caba Green Buildings Conf 2006Caba Green Buildings Conf 2006
Caba Green Buildings Conf 2006CABA
 
Pecha kucha
Pecha kuchaPecha kucha
Pecha kuchadualldmu
 
Rauluk Testimony Final no pics
Rauluk Testimony Final no picsRauluk Testimony Final no pics
Rauluk Testimony Final no picsValerie Rauluk
 
Miller_Sept27_2016AI
Miller_Sept27_2016AIMiller_Sept27_2016AI
Miller_Sept27_2016AICarol Miller
 
2013 07-22-delhi rooftop-presentation
2013 07-22-delhi rooftop-presentation2013 07-22-delhi rooftop-presentation
2013 07-22-delhi rooftop-presentationTobias Engelmeier
 
SustainableUX 2017 Presentation Seyi Fabode
SustainableUX 2017 Presentation Seyi FabodeSustainableUX 2017 Presentation Seyi Fabode
SustainableUX 2017 Presentation Seyi FabodeSeyi Fabode
 
The Future of Industrial Activity in Space
The Future of Industrial Activity in SpaceThe Future of Industrial Activity in Space
The Future of Industrial Activity in SpaceWorldFuture2015
 

What's hot (18)

R bull open2 change
R bull open2 changeR bull open2 change
R bull open2 change
 
Net zero energy and beyond
Net zero energy and beyondNet zero energy and beyond
Net zero energy and beyond
 
1 s2.0-s1876610217308007-main
1 s2.0-s1876610217308007-main1 s2.0-s1876610217308007-main
1 s2.0-s1876610217308007-main
 
Johnson Controls - Building Efficiency Fact Sheet
Johnson Controls - Building Efficiency Fact SheetJohnson Controls - Building Efficiency Fact Sheet
Johnson Controls - Building Efficiency Fact Sheet
 
H Y E H O P E Generator
H Y E  H O P E  GeneratorH Y E  H O P E  Generator
H Y E H O P E Generator
 
Toward Energy Management 4.0 – Delivering An Enterprise-wide Energy Managemen...
Toward Energy Management 4.0 – Delivering An Enterprise-wide Energy Managemen...Toward Energy Management 4.0 – Delivering An Enterprise-wide Energy Managemen...
Toward Energy Management 4.0 – Delivering An Enterprise-wide Energy Managemen...
 
Smart City - Cornerstone of Efficiency - V2
Smart City - Cornerstone of Efficiency - V2Smart City - Cornerstone of Efficiency - V2
Smart City - Cornerstone of Efficiency - V2
 
Vinod Khosla: “Smart Grid” or “Smart Hype” — An Analytical Perspective From a...
Vinod Khosla: “Smart Grid” or “Smart Hype” — An Analytical Perspective From a...Vinod Khosla: “Smart Grid” or “Smart Hype” — An Analytical Perspective From a...
Vinod Khosla: “Smart Grid” or “Smart Hype” — An Analytical Perspective From a...
 
Revue de presse IoT / Data du 13/03/2017
Revue de presse IoT / Data du 13/03/2017Revue de presse IoT / Data du 13/03/2017
Revue de presse IoT / Data du 13/03/2017
 
Caba Green Buildings Conf 2006
Caba Green Buildings Conf 2006Caba Green Buildings Conf 2006
Caba Green Buildings Conf 2006
 
Green computing
Green computingGreen computing
Green computing
 
Pecha kucha
Pecha kuchaPecha kucha
Pecha kucha
 
Rauluk Testimony Final no pics
Rauluk Testimony Final no picsRauluk Testimony Final no pics
Rauluk Testimony Final no pics
 
Miller_Sept27_2016AI
Miller_Sept27_2016AIMiller_Sept27_2016AI
Miller_Sept27_2016AI
 
2013 07-22-delhi rooftop-presentation
2013 07-22-delhi rooftop-presentation2013 07-22-delhi rooftop-presentation
2013 07-22-delhi rooftop-presentation
 
SustainableUX 2017 Presentation Seyi Fabode
SustainableUX 2017 Presentation Seyi FabodeSustainableUX 2017 Presentation Seyi Fabode
SustainableUX 2017 Presentation Seyi Fabode
 
The Future of Industrial Activity in Space
The Future of Industrial Activity in SpaceThe Future of Industrial Activity in Space
The Future of Industrial Activity in Space
 
EnerG
EnerGEnerG
EnerG
 

Similar to Washington DC Case Study

03_2019 Green Building Report.pptx
03_2019 Green Building Report.pptx03_2019 Green Building Report.pptx
03_2019 Green Building Report.pptxAnkitaNarwade2
 
Cost Effectiveness of LID Implementation
Cost Effectiveness of LID ImplementationCost Effectiveness of LID Implementation
Cost Effectiveness of LID ImplementationRobert Muir
 
Comparison between SAM and RETScreen
Comparison between SAM and RETScreenComparison between SAM and RETScreen
Comparison between SAM and RETScreenAnkit Thiranh
 
Green Collar Workforce Development Slide Show
Green Collar Workforce Development Slide ShowGreen Collar Workforce Development Slide Show
Green Collar Workforce Development Slide ShowBob Moreo
 
Webinar: Reduce Your Building Operating Costs with Energy Data
Webinar: Reduce Your Building Operating Costs with Energy DataWebinar: Reduce Your Building Operating Costs with Energy Data
Webinar: Reduce Your Building Operating Costs with Energy DataUrjanet
 
The Planet needs Smarter Buildings
The Planet needs Smarter BuildingsThe Planet needs Smarter Buildings
The Planet needs Smarter BuildingsMurray Guy
 
How can Digital Twins support Manufacturers on the path to Net-Zero?
How can Digital Twins support Manufacturers on the path to Net-Zero?How can Digital Twins support Manufacturers on the path to Net-Zero?
How can Digital Twins support Manufacturers on the path to Net-Zero?IES VE
 
The Effect of Building Direction and Natural Airing on Yearly Power Utilization
The Effect of Building Direction and Natural Airing on Yearly Power UtilizationThe Effect of Building Direction and Natural Airing on Yearly Power Utilization
The Effect of Building Direction and Natural Airing on Yearly Power UtilizationYogeshIJTSRD
 
Decarbonisation Futures: Innovation Pathways to Net Zero Emissions
Decarbonisation Futures: Innovation Pathways to Net Zero EmissionsDecarbonisation Futures: Innovation Pathways to Net Zero Emissions
Decarbonisation Futures: Innovation Pathways to Net Zero EmissionsIEA-ETSAP
 
Unleashing local dispatchable solar
Unleashing local dispatchable solarUnleashing local dispatchable solar
Unleashing local dispatchable solarClean Coalition
 
ENERGY ANALYSIS OF SMITHA MEMORIAL CANCER, THODUPUZHA CENTER USING BIM TECHNO...
ENERGY ANALYSIS OF SMITHA MEMORIAL CANCER, THODUPUZHA CENTER USING BIM TECHNO...ENERGY ANALYSIS OF SMITHA MEMORIAL CANCER, THODUPUZHA CENTER USING BIM TECHNO...
ENERGY ANALYSIS OF SMITHA MEMORIAL CANCER, THODUPUZHA CENTER USING BIM TECHNO...IRJET Journal
 
Tech + Built Environment Trends 22
Tech + Built Environment Trends 22Tech + Built Environment Trends 22
Tech + Built Environment Trends 22Matthew Marson
 
Energy Management for the Information Age
Energy Management for the Information AgeEnergy Management for the Information Age
Energy Management for the Information AgeDr. Robert L. Straitt
 
A Review Paper on Retrofitting of Institutional Building into Green Building ...
A Review Paper on Retrofitting of Institutional Building into Green Building ...A Review Paper on Retrofitting of Institutional Building into Green Building ...
A Review Paper on Retrofitting of Institutional Building into Green Building ...IRJET Journal
 
The Importance of Energy Efficiency in Climate Action Plans
The Importance of Energy Efficiency in Climate Action PlansThe Importance of Energy Efficiency in Climate Action Plans
The Importance of Energy Efficiency in Climate Action PlansCenter for Sustainable Energy
 
The Significance of Green Data Centres for Development
The Significance of Green Data Centres for DevelopmentThe Significance of Green Data Centres for Development
The Significance of Green Data Centres for DevelopmentAbdulghanyMohamed1
 

Similar to Washington DC Case Study (20)

03_2019 Green Building Report.pptx
03_2019 Green Building Report.pptx03_2019 Green Building Report.pptx
03_2019 Green Building Report.pptx
 
Cost Effectiveness of LID Implementation
Cost Effectiveness of LID ImplementationCost Effectiveness of LID Implementation
Cost Effectiveness of LID Implementation
 
Comparison between SAM and RETScreen
Comparison between SAM and RETScreenComparison between SAM and RETScreen
Comparison between SAM and RETScreen
 
Green Collar Workforce Development Slide Show
Green Collar Workforce Development Slide ShowGreen Collar Workforce Development Slide Show
Green Collar Workforce Development Slide Show
 
Webinar: Reduce Your Building Operating Costs with Energy Data
Webinar: Reduce Your Building Operating Costs with Energy DataWebinar: Reduce Your Building Operating Costs with Energy Data
Webinar: Reduce Your Building Operating Costs with Energy Data
 
The Planet needs Smarter Buildings
The Planet needs Smarter BuildingsThe Planet needs Smarter Buildings
The Planet needs Smarter Buildings
 
How can Digital Twins support Manufacturers on the path to Net-Zero?
How can Digital Twins support Manufacturers on the path to Net-Zero?How can Digital Twins support Manufacturers on the path to Net-Zero?
How can Digital Twins support Manufacturers on the path to Net-Zero?
 
Tralli
TralliTralli
Tralli
 
The Effect of Building Direction and Natural Airing on Yearly Power Utilization
The Effect of Building Direction and Natural Airing on Yearly Power UtilizationThe Effect of Building Direction and Natural Airing on Yearly Power Utilization
The Effect of Building Direction and Natural Airing on Yearly Power Utilization
 
Decarbonisation Futures: Innovation Pathways to Net Zero Emissions
Decarbonisation Futures: Innovation Pathways to Net Zero EmissionsDecarbonisation Futures: Innovation Pathways to Net Zero Emissions
Decarbonisation Futures: Innovation Pathways to Net Zero Emissions
 
Unleashing local dispatchable solar
Unleashing local dispatchable solarUnleashing local dispatchable solar
Unleashing local dispatchable solar
 
4.2_Microgrid Design Toolkit_Eddy_EPRI/SNL Microgrid
4.2_Microgrid Design Toolkit_Eddy_EPRI/SNL Microgrid4.2_Microgrid Design Toolkit_Eddy_EPRI/SNL Microgrid
4.2_Microgrid Design Toolkit_Eddy_EPRI/SNL Microgrid
 
ENERGY ANALYSIS OF SMITHA MEMORIAL CANCER, THODUPUZHA CENTER USING BIM TECHNO...
ENERGY ANALYSIS OF SMITHA MEMORIAL CANCER, THODUPUZHA CENTER USING BIM TECHNO...ENERGY ANALYSIS OF SMITHA MEMORIAL CANCER, THODUPUZHA CENTER USING BIM TECHNO...
ENERGY ANALYSIS OF SMITHA MEMORIAL CANCER, THODUPUZHA CENTER USING BIM TECHNO...
 
Tech + Built Environment Trends 22
Tech + Built Environment Trends 22Tech + Built Environment Trends 22
Tech + Built Environment Trends 22
 
Presentation.pptx
Presentation.pptxPresentation.pptx
Presentation.pptx
 
Energy Management for the Information Age
Energy Management for the Information AgeEnergy Management for the Information Age
Energy Management for the Information Age
 
Green Computing
Green ComputingGreen Computing
Green Computing
 
A Review Paper on Retrofitting of Institutional Building into Green Building ...
A Review Paper on Retrofitting of Institutional Building into Green Building ...A Review Paper on Retrofitting of Institutional Building into Green Building ...
A Review Paper on Retrofitting of Institutional Building into Green Building ...
 
The Importance of Energy Efficiency in Climate Action Plans
The Importance of Energy Efficiency in Climate Action PlansThe Importance of Energy Efficiency in Climate Action Plans
The Importance of Energy Efficiency in Climate Action Plans
 
The Significance of Green Data Centres for Development
The Significance of Green Data Centres for DevelopmentThe Significance of Green Data Centres for Development
The Significance of Green Data Centres for Development
 

Washington DC Case Study

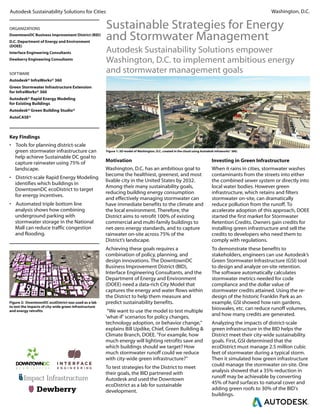
  • 1. Sustainable Strategies for Energy and Stormwater Management Motivation Washington, D.C. has an ambitious goal to become the healthiest, greenest, and most livable city in the United States by 2032. Among their many sustainability goals, reducing building energy consumption and effectively managing stormwater can have immediate benefits to the climate and the local environment. Therefore, the District aims to retrofit 100% of existing commercial and multi-family buildings to net-zero energy standards, and to capture rainwater on-site across 75% of the District’s landscape. Achieving these goals requires a combination of policy, planning, and design innovations. The DowntownDC Business Improvement District (BID), Interface Engineering Consultants, and the Department of Energy and Environment (DOEE) need a data-rich City Model that captures the energy and water flows within the District to help them measure and predict sustainability benefits. “We want to use the model to test multiple 'what-if' scenarios for policy changes, technology adoption, or behavior change," explains Bill Updike, Chief, Green Building & Climate Branch, DOEE. "For example, how much energy will lighting retrofits save and which buildings should we target? How much stormwater runoff could we reduce with city-wide green infrastructure?” To test strategies for the District to meet their goals, the BID partnered with Autodesk and used the Downtown ecoDistrict as a lab for sustainable development. Investing in Green Infrastructure When it rains in cities, stormwater washes contaminants from the streets into either the combined sewer system or directly into local water bodies. However green infrastructure, which retains and filters stormwater on-site, can dramatically reduce pollution from the runoff. To accelerate adoption of this approach, DOEE started the first market for Stormwater Retention Credits. Owners gain credits for installing green infrastructure and sell the credits to developers who need them to comply with regulations. To demonstrate these benefits to stakeholders, engineers can use Autodesk’s Green Stormwater Infrastructure (GSI) tool to design and analyze on-site retention. The software automatically calculates stormwater metrics needed for code compliance and the dollar value of stormwater credits attained. Using the re- design of the historic Franklin Park as an example, GSI showed how rain gardens, bioswales, etc. can reduce runoff volumes, and how many credits are generated. Analyzing the impacts of district-scale green infrastructure in the BID helps the District meet their city-wide sustainability goals. First, GSI determined that the ecoDistrict must manage 2.5 million cubic feet of stormwater during a typical storm. Then it simulated how green infrastructure could manage the stormwater on-site. One analysis showed that a 35% reduction in runoff may be achievable by converting 45% of hard surfaces to natural cover and adding green roofs to 30% of the BID's buildings. Figure 1: 3D model of Washington, D.C. created in the cloud using Autodesk Infraworks® 360. Autodesk Sustainability Solutions for Cities Washington, D.C. ORGANIZATIONS SOFTWARE Autodesk® InfraWorks® 360 Green Stormwater Infrastructure Extension for InfraWorks® 360 Autodesk® Rapid Energy Modeling for Existing Buildings Autodesk® Green Building Studio® AutoCASE® DowntownDC Business Improvement District (BID) D.C. Department of Energy and Environment (DOEE) Interface Engineering Consultants Dewberry Engineering Consultants Key Findings • Tools for planning district-scale green stormwater infrastructure can help achieve Sustainable DC goal to capture rainwater using 75% of landscape. • District-scale Rapid Energy Modeling identifies which buildings in DowntownDC ecoDistrict to target for energy incentives. • Automated triple bottom line analysis shows how combining underground parking with stormwater storage in the National Mall can reduce traffic congestion and flooding. Figure 2: DowntownDC ecoDistrict was used as a lab to test the impacts of city-wide green infrastructure and energy retrofits Autodesk Sustainability Solutions empower Washington, D.C. to implement ambitious energy and stormwater management goals
  • 2. Figure 4: AutoCASE shows the triple bottom line benefits of underground stormwater cisterns and parking spaces, which reduce flooding and congestion at the National Mall Conclusions Washington, D.C. has set aggressive goals to reduce their environmental footprint, combat climate change, and improve the quality of life for their citizens. Policy- makers and engineers are increasingly relying on data, analysis, and simulation to make critical infrastructure decisions that will have long term economic, social and environmental implications. With the aid of Autodesk’s InfraWorks® 360 and a suite of sustainability analysis tools, the District was able to play out scenarios for how to attain these agenda- setting goals, carving a path for smarter use of technology that other cities can adopt. District-scale Rapid Energy Modeling shows retrofit potential According to the U.S. Energy Information Administration, the commercial building sector in the District accounts for 66% of end use energy consumption. While DOEE gathers annual data through its landmark energy and water benchmarking law, there are no clear strategies on which buildings should be retrofitted first, and the law only applies to buildings that are greater than 50,000 square feet. The Downtown ecoDistrict applied Rapid Energy Modeling for Existing Buildings (REM), Autodesk’s virtual energy assessment tool, to quickly identify which buildings need retrofits. REM used satellite images and weather data to generate energy simulations for 40 buildings (25 Offices, 5 Multifamily, 5 Hotels, and 5 Schools). In only 5-8 minutes per building, REM analysis showed which building systems likely consume the most energy, and how performance upgrades can save on energy costs. The sample of 25 offices showed that glazing, lighting efficiency, and plug loads are most sensitive to energy consump- tion, and are good candidates for retrofit. Figure 3 shows how policy-makers can set retrofit targets to estimate potential energy cost savings from improved building systems. District-scale REM analysis allows policy- makers to predict the impacts of energy retrofits, create data-driven policy measures, and develop investment strategies. Figure 3: REM analysis shows which building systems to retrofit and potential cost savings Solving flooding and congestion in the National Mall Washington, D.C. residents are all too familiar with flooding and congestion in the National Mall. Tour buses that idle along the streets cause traffic problems, pollute the air, and limit parking. In 2006 a major storm flooded many prominent museums and caused damages that cost millions to repair. To solve these problems and improve the experience of the National Mall, Dewberry engineering consultants proposed a multipurpose infrastructure solution. In crafting their unconventional design Dewberry used AutoCASE®, a triple bottom line analysis tool from Autodesk partner Impact Infrastructure, to justify a project that meets the triple bottom line. This entailed green space on the surface level, moving parking below ground, and storing stormwater in an underground irrigation cistern (shown in Figure 4). AutoCASE showed how a comprehensive design with higher upfront costs was more attractive once the full range of social, environmental, and economic benefits were taken into consideration. “We want to use the model to test multiple 'what-if' scenarios for policy changes, technology adoption, or behavior change," explains Bill Updike, Chief, Green Building & Climate Branch, DOEE. "For example, how much energy will lighting retrofits save and which buildings should we target? How much stormwater runoff could we reduce with city-wide green infrastructure?” Bill Updike, Chief, Green Building & Climate Branch, Department of Energy and Environment These results are based on third party data, have not been fully validated and may contain material errors. Autodesk makes no representations or warranties, including with respect to their reliability, accuracy, completeness or validity. If you use these results, you agree to waive, release and hold harmless Autodesk and its suppliers and licensors from any and all liability related to such use. YOUR USE OF THESE RESULTS IS AT YOUR OWN RISK. Autodesk, the Autodesk logo, InfraWorks 360, Green Building Studio, Green Stormwater Infrastructure Extension for InfraWorks 360 are registered trademarks or trademarks of Autodesk, Inc., and/or its subsidiaries and/or affiliates in the USA and/or other countries. All other brand names, product names, or trademarks belong to their respective holders. Autodesk reserves the right to alter product and services offerings, and specifications and pricing at any time without notice, and is not responsible for typographical or graphical errors that may appear in this document. © 2015 Autodesk, Inc. All rights reserved. Autodesk Sustainability Solutions for Cities Washington, D.C.