Download to read offline
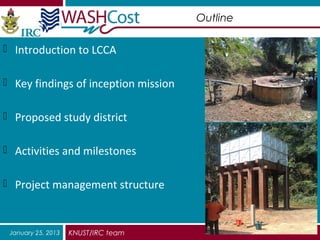
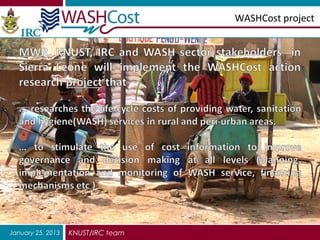

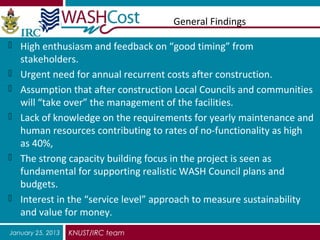
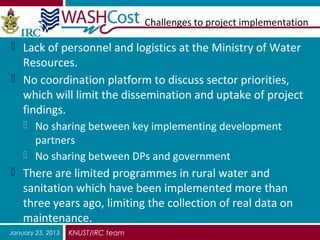
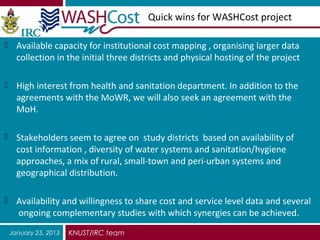
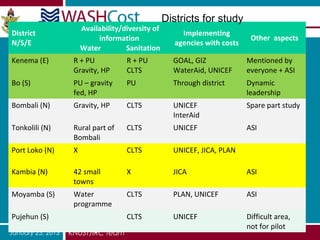
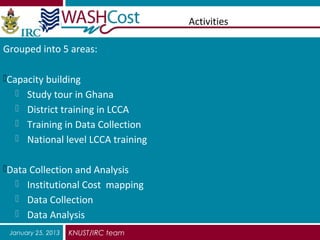

The document discusses a proposed study on life-cycle costs for water, sanitation, and hygiene (WASH) services in Ghana. It outlines key findings from an inception mission, including a lack of focus on annual recurrent costs and capacity building needs. The proposed study would examine costs and service levels in selected districts. Challenges include limited data on long-term maintenance and a lack of coordination between implementing partners. Potential quick wins are institutional support for cost mapping and data collection in initial study districts.