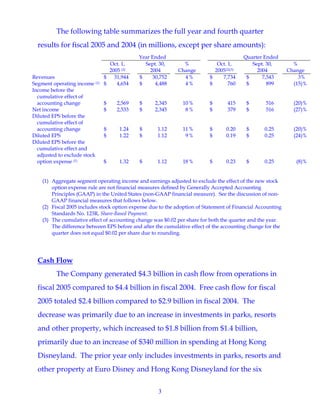
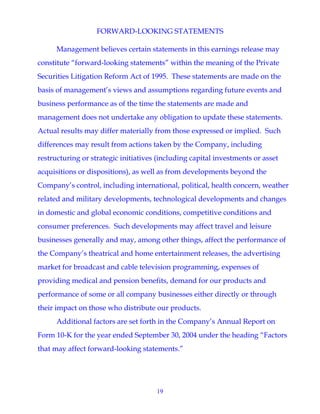
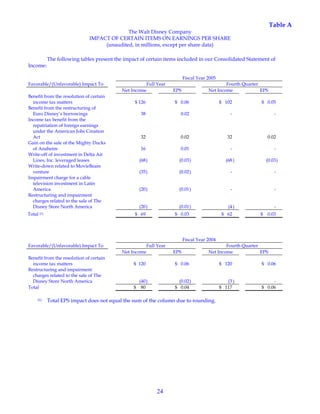
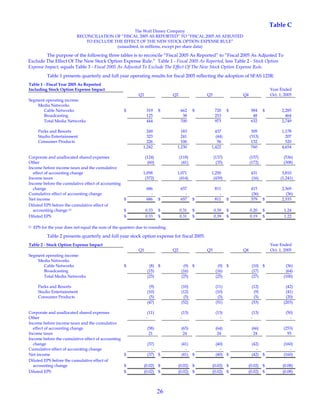
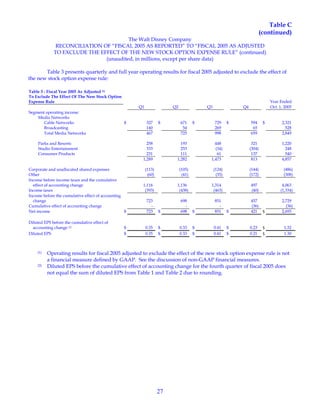
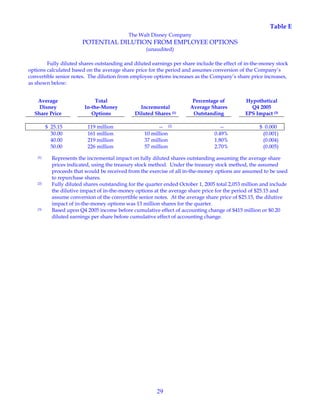
- The Walt Disney Company reported earnings for the fourth quarter and fiscal year 2005, with diluted EPS of $1.24 for the year and $0.20 for the quarter.
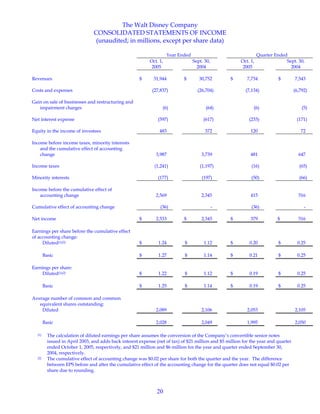
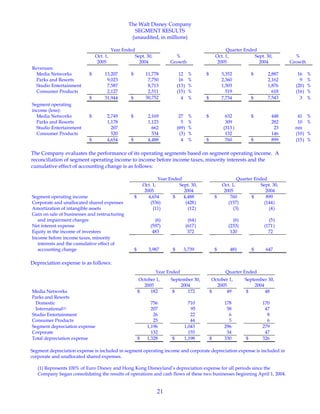
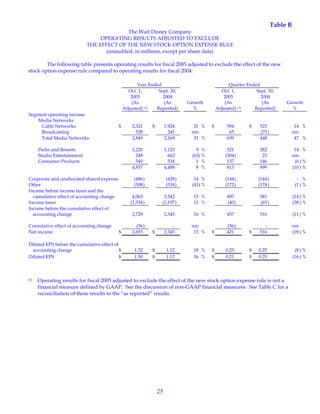
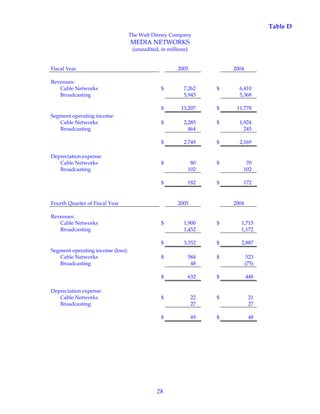
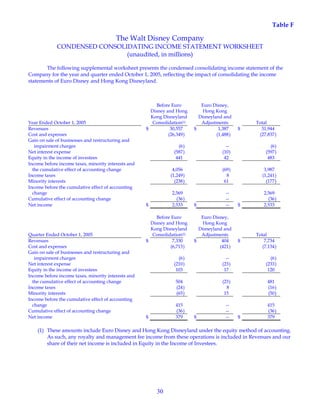
- Revenues increased 4% to $31.9 billion for the fiscal year and 3% to $7.7 billion for the fourth quarter. Segment operating income increased 4% to $4.7 billion for the fiscal year but decreased 15% to $760 million for the fourth quarter.
- Robert Iger, President and CEO, said the company's strategy of achieving growth through creative content, global expansion, and new technology is working, and Disney is well positioned to take advantage of changes in the media landscape.