Download to read offline
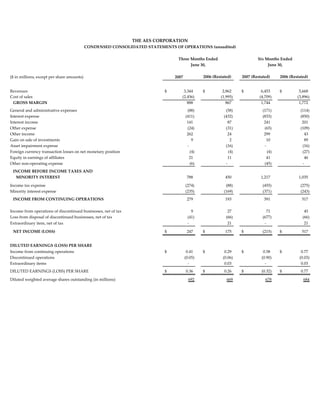
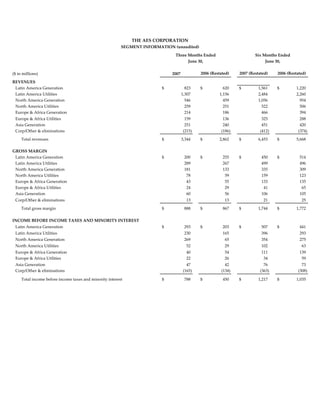
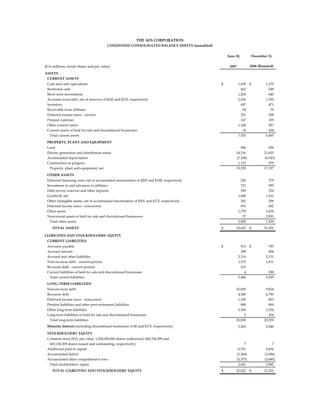
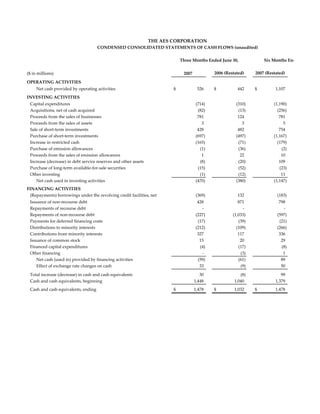
The AES Corporation reported strong financial results for the second quarter of 2007, with revenues increasing 17% to $3.3 billion compared to the second quarter of 2006. Net income increased to $247 million compared to $175 million in the second quarter of 2006. The company continued expanding its alternative energy business, acquiring wind farm projects in the US and China and completing construction of a 233 MW wind farm in Texas.


