Download to read offline

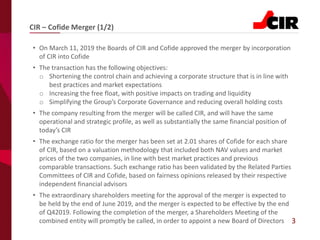


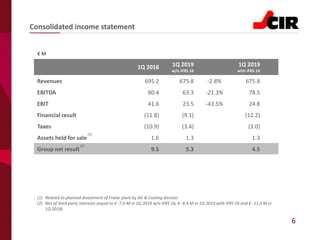


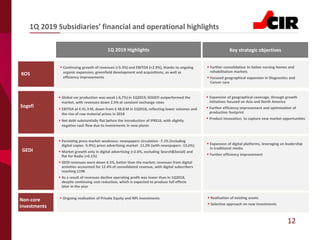


The document provides an overview of CIR S.p.A.'s results for the first quarter of 2019 and plans going forward. Some key points: - CIR and Cofide approved a merger that is expected to be completed by the end of 2019 to simplify the corporate structure. - Consolidated revenues were €675.8 million, down 2.8% year-over-year. Net income was €4.5 million compared to €9.5 million in Q1 2018. - KOS Group saw a 5.3% increase in revenues driven by organic growth and acquisitions. Sogefi revenues declined due to weaker automotive production, while GEDI revenues fell 6.


