Download free for 30 days
Sign in
Upload
Language (EN)
Support
Business
Mobile
Social Media
Marketing
Technology
Art & Photos
Career
Design
Education
Presentations & Public Speaking
Government & Nonprofit
Healthcare
Internet
Law
Leadership & Management
Automotive
Engineering
Software
Recruiting & HR
Retail
Sales
Services
Science
Small Business & Entrepreneurship
Food
Environment
Economy & Finance
Data & Analytics
Investor Relations
Sports
Spiritual
News & Politics
Travel
Self Improvement
Real Estate
Entertainment & Humor
Health & Medicine
Devices & Hardware
Lifestyle
Change Language
Language
English
Español
Português
Français
Deutsche
Cancel
Save
Submit search
EN
Uploaded by
finance7
543 views
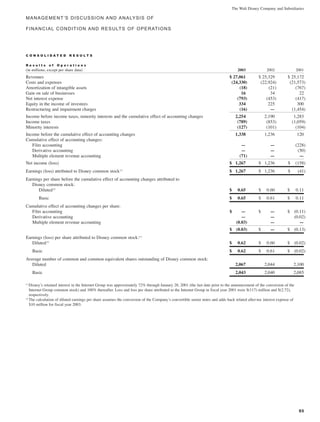
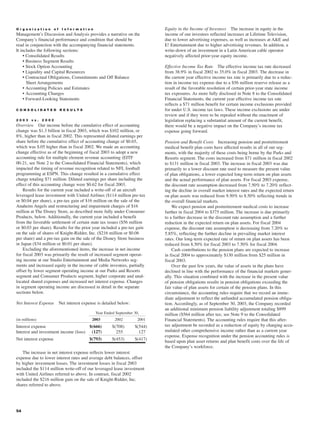
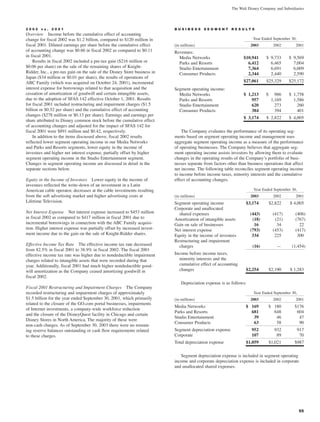
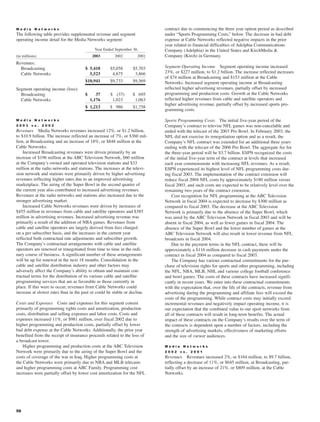
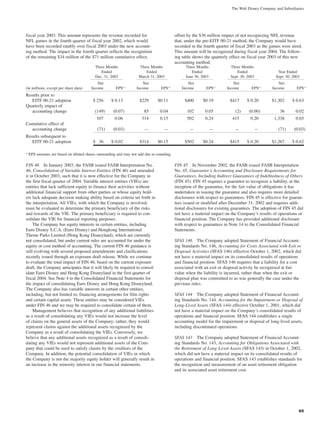
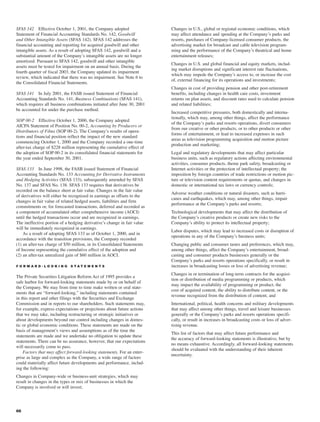
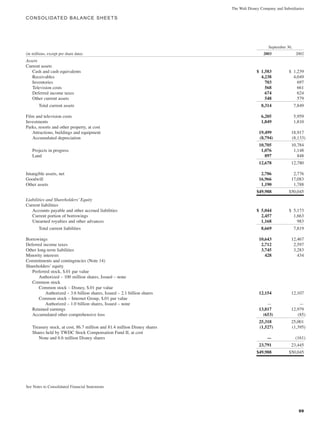
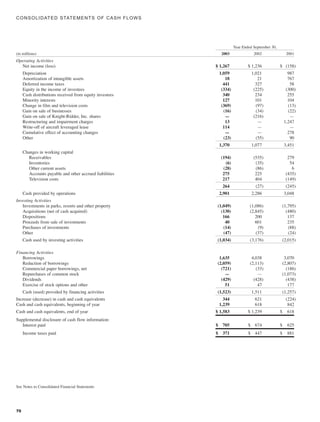
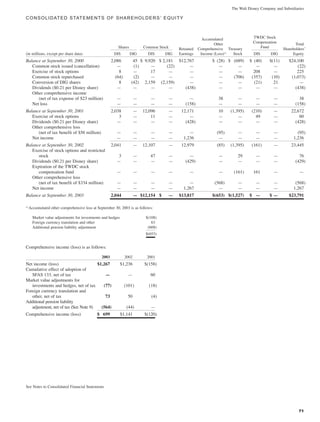
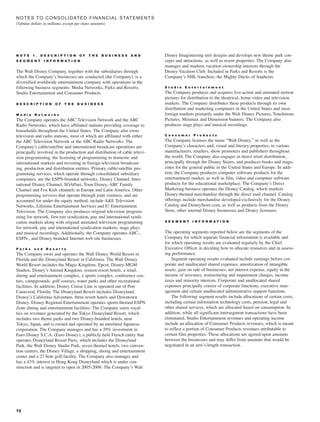
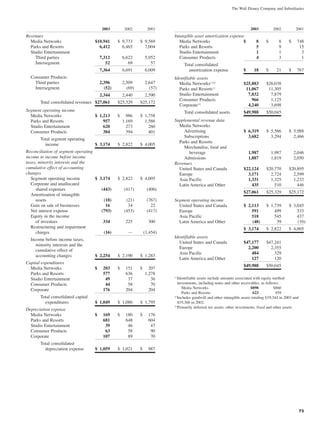
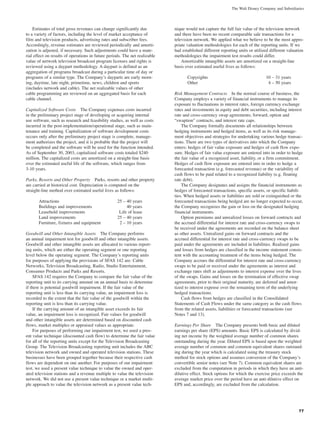
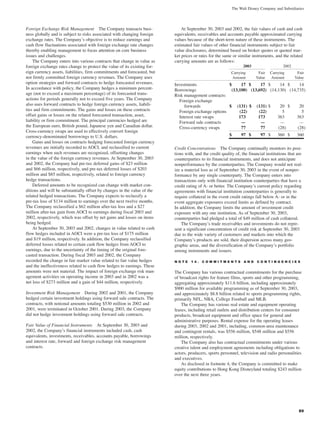
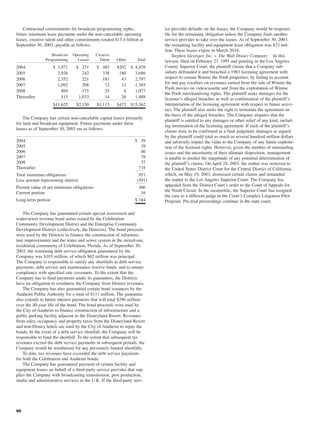
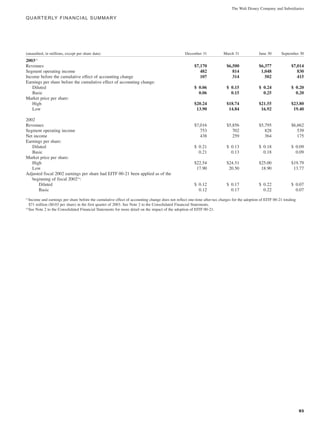
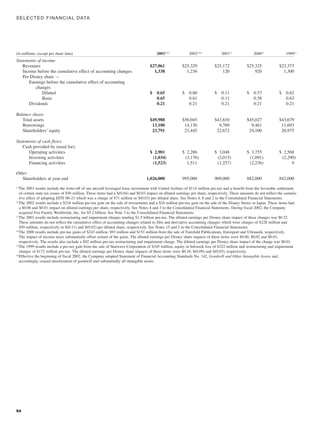
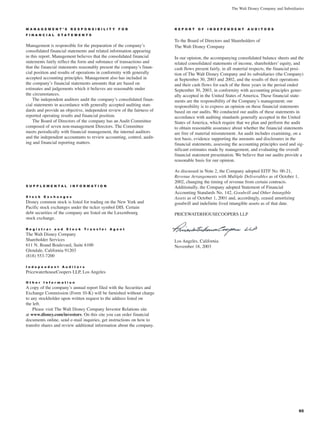
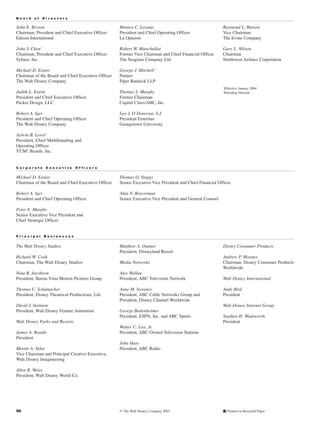
walt disney Annual Report 2003
Economy & Finance
◦
Read more
0
Save
Share
Embed
Embed presentation
Download
Downloaded 29 times
1
/ 100
2
/ 100
3
/ 100
4
/ 100
5
/ 100
6
/ 100
7
/ 100
8
/ 100
9
/ 100
10
/ 100
11
/ 100
12
/ 100
13
/ 100
14
/ 100
15
/ 100
16
/ 100
17
/ 100
18
/ 100
19
/ 100
20
/ 100
21
/ 100
22
/ 100
23
/ 100
24
/ 100
25
/ 100
26
/ 100
27
/ 100
28
/ 100
29
/ 100
30
/ 100
31
/ 100
32
/ 100
33
/ 100
34
/ 100
35
/ 100
36
/ 100
37
/ 100
38
/ 100
39
/ 100
40
/ 100
41
/ 100
42
/ 100
43
/ 100
44
/ 100
45
/ 100
46
/ 100
47
/ 100
48
/ 100
49
/ 100
50
/ 100
51
/ 100
52
/ 100
53
/ 100
54
/ 100
55
/ 100
56
/ 100
57
/ 100
58
/ 100
59
/ 100
60
/ 100
61
/ 100
62
/ 100
63
/ 100
64
/ 100
65
/ 100
66
/ 100
67
/ 100
68
/ 100
69
/ 100
70
/ 100
71
/ 100
72
/ 100
73
/ 100
74
/ 100
75
/ 100
76
/ 100
77
/ 100
78
/ 100
79
/ 100
80
/ 100
81
/ 100
82
/ 100
83
/ 100
84
/ 100
85
/ 100
86
/ 100
87
/ 100
88
/ 100
89
/ 100
90
/ 100
91
/ 100
92
/ 100
93
/ 100
94
/ 100
95
/ 100
96
/ 100
97
/ 100
98
/ 100
99
/ 100
100
/ 100
More Related Content
PDF
walt disney 2008 Annual Report
by
finance7
PDF
walt disney Annual Report 2007
by
finance7
PDF
sysco Return on Total Capital
by
finance7
PDF
sysco Annual Reports2002
by
finance7
PDF
sysco Annual Reports2001
by
finance7
PDF
sysco Annual Reports2002
by
finance7
PDF
sysco Annual Reports2003
by
finance7
PDF
sysco Annual Reports2004
by
finance7
walt disney 2008 Annual Report
by
finance7
walt disney Annual Report 2007
by
finance7
sysco Return on Total Capital
by
finance7
sysco Annual Reports2002
by
finance7
sysco Annual Reports2001
by
finance7
sysco Annual Reports2002
by
finance7
sysco Annual Reports2003
by
finance7
sysco Annual Reports2004
by
finance7
More from finance7
PDF
sysco Annual Reports2005
by
finance7
PDF
sysco Annual Reports2006
by
finance7
PDF
sysco Annual Reports2008
by
finance7
PDF
Summary of Reconciling Items 2001
by
finance7
PDF
Regional Operating Income Bridge 2001
by
finance7
PDF
Net Income and EPS Bridge 2001
by
finance7
PDF
Summary of Reconciling Items 2002
by
finance7
PDF
Regional Operating Income Bridge 2002
by
finance7
PDF
Net Income and EPS Bridge 2002
by
finance7
PDF
Summary of Reconciling Items 2003
by
finance7
PDF
Regional Operating Income Bridge 2003
by
finance7
PDF
Net Income and EPS Bridge 2003
by
finance7
PDF
Summary of Reconciling Items 2004
by
finance7
PDF
Regional Operating Income Bridge 2004
by
finance7
PDF
Net Income and EPS Bridge 2004
by
finance7
PDF
Summary of Reconciling Items 2005
by
finance7
PDF
Regional Operating Income Bridge 2005
by
finance7
PDF
Net Income and EPS Bridge 2005
by
finance7
PDF
Procedures for Shareowner Nominations of Candidates
by
finance7
PDF
Policies on Board Communications with Shareowners
by
finance7
sysco Annual Reports2005
by
finance7
sysco Annual Reports2006
by
finance7
sysco Annual Reports2008
by
finance7
Summary of Reconciling Items 2001
by
finance7
Regional Operating Income Bridge 2001
by
finance7
Net Income and EPS Bridge 2001
by
finance7
Summary of Reconciling Items 2002
by
finance7
Regional Operating Income Bridge 2002
by
finance7
Net Income and EPS Bridge 2002
by
finance7
Summary of Reconciling Items 2003
by
finance7
Regional Operating Income Bridge 2003
by
finance7
Net Income and EPS Bridge 2003
by
finance7
Summary of Reconciling Items 2004
by
finance7
Regional Operating Income Bridge 2004
by
finance7
Net Income and EPS Bridge 2004
by
finance7
Summary of Reconciling Items 2005
by
finance7
Regional Operating Income Bridge 2005
by
finance7
Net Income and EPS Bridge 2005
by
finance7
Procedures for Shareowner Nominations of Candidates
by
finance7
Policies on Board Communications with Shareowners
by
finance7
Recently uploaded
PDF
Coinbase Account Verification: How It Works & Why It Matters
by
jhdhj3989
DOCX
How Can You Ensure the Legitimacy of Instagram Accounts_.docx
by
Business
PPTX
Sustainable Alpha Can ESG Portfolios Outperform Conventional Portfolios in Em...
by
Razan Shahwan
PDF
Labor Shortages and Security Risks Were the Top Obstacles for Business in Dec...
by
Інститут економічних досліджень та політичних консультацій
DOCX
A Study of Instagram Accounts in Digital Media and Communication Systems
by
jhdhj3989
PDF
Geography Presentation about Economic activities of Ethiopia
by
buraboy711
PPTX
Banking theory law & Practice Unit I.pptx
by
manikandansMani2
PDF
Mercosur: Opportunity for Greek economy - International New York Times
by
Antonis Zairis
PPTX
Awareness of digital currency[1] (1).pptx
by
vasanthimummana333
DOCX
SQHWYD Market Analysis: Crypto & Commodity Liquidity Cycles
by
SQHWYD
PPTX
Forks in the curve: whether and how to respond to monetary policy divergence
by
ResolutionFoundation
PDF
"Excel Tips 11 to 20: Advanced Techniques to Master Excel Like a Pro" PART 2
by
CA Suvidha Chaplot
PDF
Buy Verified PayPal Account Online_ A Comprehensive ....pdf
by
Business
PDF
How to Safely Buy Twitter Accounts A Complete Guide in 2026
by
alivatopusa
DOCX
Top 20 Websites to Purchase Used Proton Mail Accounts in the USA.docx
by
Business
PDF
Payeer Verification Guide for Freelancers & Online Sellers.pdf
by
jhdhj3989
PDF
Introduction to Globalization - Key Features and Drivers
by
EuniceBotero1
PDF
Celestin Pepin - The Limitations of Behavioral Finance
by
Celestin Pepin
PDF
How to Securely Purchase Verified PayPal Accounts in 2026
by
jaxsonzoi897
PDF
"India's Path to Viksit Bharat: A Vision of Progress, Prosperity, and Sustain...
by
CA Suvidha Chaplot
Coinbase Account Verification: How It Works & Why It Matters
by
jhdhj3989
How Can You Ensure the Legitimacy of Instagram Accounts_.docx
by
Business
Sustainable Alpha Can ESG Portfolios Outperform Conventional Portfolios in Em...
by
Razan Shahwan
Labor Shortages and Security Risks Were the Top Obstacles for Business in Dec...
by
Інститут економічних досліджень та політичних консультацій
A Study of Instagram Accounts in Digital Media and Communication Systems
by
jhdhj3989
Geography Presentation about Economic activities of Ethiopia
by
buraboy711
Banking theory law & Practice Unit I.pptx
by
manikandansMani2
Mercosur: Opportunity for Greek economy - International New York Times
by
Antonis Zairis
Awareness of digital currency[1] (1).pptx
by
vasanthimummana333
SQHWYD Market Analysis: Crypto & Commodity Liquidity Cycles
by
SQHWYD
Forks in the curve: whether and how to respond to monetary policy divergence
by
ResolutionFoundation
"Excel Tips 11 to 20: Advanced Techniques to Master Excel Like a Pro" PART 2
by
CA Suvidha Chaplot
Buy Verified PayPal Account Online_ A Comprehensive ....pdf
by
Business
How to Safely Buy Twitter Accounts A Complete Guide in 2026
by
alivatopusa
Top 20 Websites to Purchase Used Proton Mail Accounts in the USA.docx
by
Business
Payeer Verification Guide for Freelancers & Online Sellers.pdf
by
jhdhj3989
Introduction to Globalization - Key Features and Drivers
by
EuniceBotero1
Celestin Pepin - The Limitations of Behavioral Finance
by
Celestin Pepin
How to Securely Purchase Verified PayPal Accounts in 2026
by
jaxsonzoi897
"India's Path to Viksit Bharat: A Vision of Progress, Prosperity, and Sustain...
by
CA Suvidha Chaplot
Download


![Awareness of digital currency[1] (1).pptx](https://cdn.slidesharecdn.com/ss_thumbnails/awarenessofdigitalcurrency11-260125155504-b1badee4-thumbnail.jpg?width=640&height=640&fit=bounds)


