Download to read offline


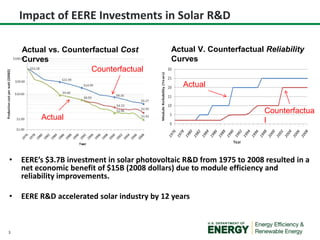
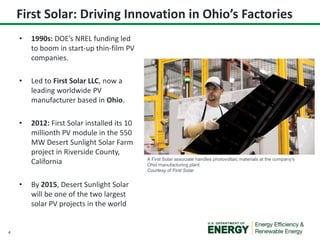
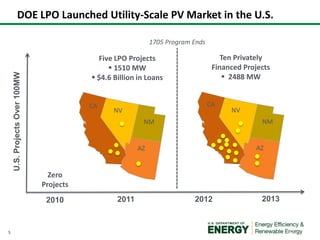
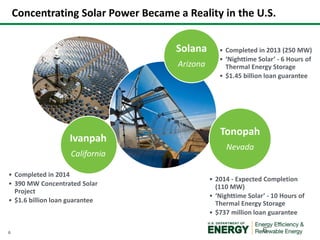
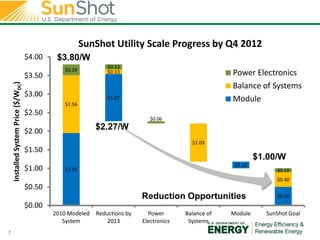
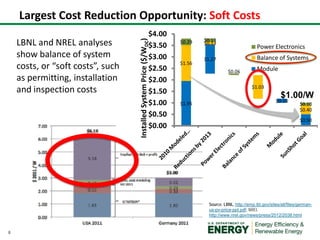
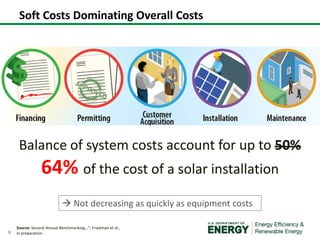
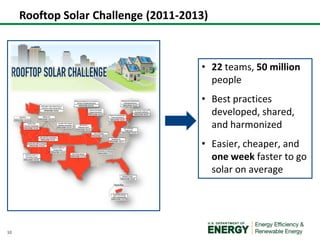
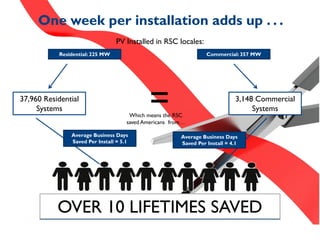


The document outlines the significant economic impact and advancements in the solar industry due to EERE's $3.7 billion investment in solar photovoltaic R&D from 1975 to 2008, yielding a net benefit of $15 billion. It highlights the creation of successful companies like First Solar, major utility-scale projects, and the focus on reducing soft costs that account for a significant portion of solar installation expenses. Additionally, it discusses initiatives like the Rooftop Solar Challenge aimed at accelerating solar deployment.