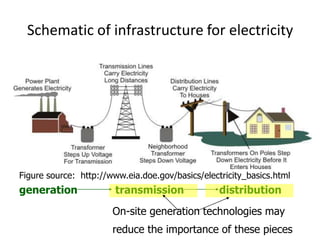
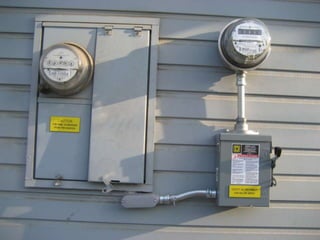
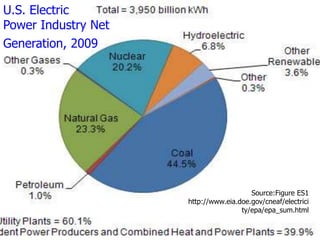
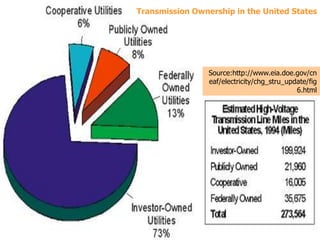
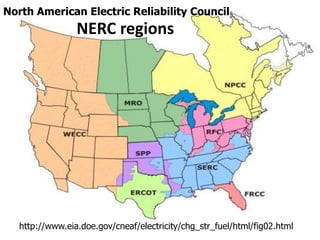
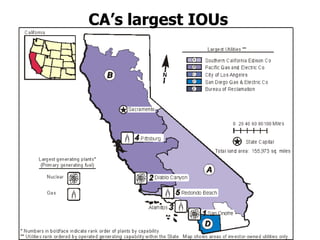
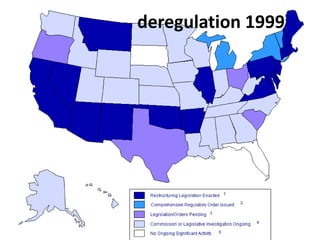
URP 337 Planning public infrastructureWeek 62 May 2011
Sometimes energy-related infrastructure represents a landuseEnergyUtilitiesWhy else should planners care?
Energy UtilitiesAs consumer advocates.
Yucca Mountain Nevada will it not be used to store nuclear waste.  Where will it go? As advocates for the environment.
As advocates for those with less privilege.
http://www.eia.doe.gov/emeu/aer/pecss_diagram.html
(Especially in fuel storage)Infrastructure for the provision of energy has many planning dimensionsConsider gasoline…
Photo in Longstreth, fig 10:  Foy’s service station, 211 N Figueroa, Los Angeles, 1928.
Big oil and the monkey wrench entrepreneurPhoto in Longstreth, fig 30:  Texaco “type C,” probably west coast, 1937.
Gasoline distribution todayPhoto from Violence Policy Center, “Sitting Ducks: The Threat to the Chemical and Refinery Industry From 50 Caliber Sniper Rifles.”:  http://www.vpc.org/studies/ducktwo.htm
Gasoline distribution:  NJ tank farmPhoto from SPROL:  “worst places in the world”http://www.sprol.com/
LA tank farm
Tank farmSource:  image provided by Chevron.  Downloaded from:http://tonto.eia.doe.gov/kids/energy.cfm?page=oil_home-basics
Source:  image provided by Argonne National Laboratory.  Downloaded from:http://www.energy.ca.gov/2009_energypolicy/documents/2009-08-24_workshop/presentations/08_CEC_Schremp_Imports_and_Pipeline_Exports.pdfSource
Petroleum pipelines to and from CAhttp://www.energy.ca.gov/reports/2003-09-09_600-03-014F.PDFhttp://www.energy.ca.gov/fuels/pipeline/documents/Fig1_Major_Refined_Pipeline.PDF
Natural gas, too
U.S. Natural Gas Supply Basins Relative to Major Natural Gas Pipeline Transportation Corridors, 2008
Major Changes in Natural Gas Pipeline Transportation Capacity, 1998-2008http://www.eia.doe.gov/pub/oil_gas/natural_gas/analysis_publications/ngpipeline/comparemapm.pps
“Electricity is special because it  cannot be stored”neither can fire!Electricity(it still involves land uses)
 Recall:  Three sorts of “snapshots” for analyzing  infrastructure “events”:  Micro economics, in this case looking at potentials for monopolies.  Also looking at notion of “non-redeployable investment.”Inventory of stakeholders and their interests and for institutional change.A look at the technological landscape and its inter-relationships with environmental goals and price elasticities of fuels.
Recall:Three questions to guide inquiries of infrastructure:  By what process(es) was it constituted and is it sustained?Where do opportunities for change lie within those processes?Is a better infrastructure outcome imaginable?  If so, can it be realized by exploiting the opportunities for change that have been identified?
By what process(es) was it constituted and is it sustained?
dateline 1922
Schematic of infrastructure for electricityFigure source:  http://www.eia.doe.gov/basics/electricity_basics.htmlgenerationtransmissiondistributionnatural monopoliesderegulation was limited to
Schematic of infrastructure for electricityFigure source:  http://www.eia.doe.gov/basics/electricity_basics.htmlgenerationtransmissiondistributionOn-site generation technologies may reduce the importance of these pieces
 Energy supplyStructure of industryThree components:GenerationTransmissionDistributionLegislation
ghu took outghu put innet purchase
Generationgeneric thermal generatorwww.eia.doe.gov/cneaf/electricity/chg_stru_update/fig3a.htmlSchematic of Gas Turbinewww.eia.doe.gov/cneaf/electricity/chg_stru_update/fig3b.htmlSchematic of Combined Cyclewww.eia.doe.gov/cneaf/electricity/chg_stru_update/fig3b.htmlCogeneration Schematicwww.eia.doe.gov/cneaf/electricity/chg_stru_update/fig3b.html
U.S. Electric Power Industry Net Generation, 2009Source:Figure ES1 http://www.eia.doe.gov/cneaf/electricity/epa/epa_sum.html
Source:http://www.eia.doe.gov/cneaf/electricity/chg_stru_update/fig5.htmlsee also:http://www.eia.doe.gov/state/large icons ~ 10 GW of capacity, not individual plants, in a regional area for each fuel source. smaller icons ~ 5 GW capacity. http://www.eia.doe.gov/state/state-energy-profiles.cfm?sid=CA
Transmission Ownership in the United StatesSource:http://www.eia.doe.gov/cneaf/electricity/chg_stru_update/fig6.html
North American Electric Reliability CouncilNERC regionshttp://www.eia.doe.gov/cneaf/electricity/chg_str_fuel/html/fig02.html
Geographic reliabilityIOU=Investor owned utilityFeds=Fed gov’tOther=municipal utilities & moreCo-ops=non-profit cooperative utilities
Comparison of 750 kWh per month bill (CA avg)Does municipal vs IOU make a difference?
CA’s largest IOUs
CA has relatively clean energySource:  Environmental Integrity Project (May 2005).  Dirty Kilowatts: America’s most polluting power plants.   http://www.environmentalintegrity.org/
California’s energy is clean because relatively little coal is used in its generation
No CA plants are on this graphSource:  Environmental Integrity Project (March 2010).  Dirty Kilowatts: America’s most polluting power plants.   http://www.environmentalintegrity.org/news_reports/documents/DirtyKilowatts-Top50MercuryPowerPlantReport.pdf
notes on COAL for twenty-something Californians
TVA Coal-fired power plant accident, 22 Dec 2008 atTennessee’s Kingston Fossil PlantNASA imageshttp://earthobservatory.nasa.gov/NaturalHazards/view.php?id=36352American News Project Videohttp://www.environmentalintegrity.org/index.phpEPA cleanup web sitehttp://www.epakingstontva.com/nature_extent.aspx
Energy utilitiesDeliver energy to customers in homes, offices, shops, etcSell electricity, natural gas, oil, coal, and other energy sourcesInclude public and private sector suppliersprivate sector suppliers include investor-owned as well as privately held
Distribution of consumption by sector, 2008/9Data source: http://www.eia.doe.gov/cneaf/electricity/epa/epat7p2.htmlhttp://www.eia.doe.gov/cneaf/electricity/st_profiles/california.html
Revenue by Sector1993-2004 in $millionsData source: http://www.eia.doe.gov/cneaf/electricity/
Energy Consumption by Sectorin quadrillion Btu
Source:Statistical Abstract of the U.S., 1997, Table 921.
Electric generation capacity, selected sourcesstotalin gigawattssources
residential price per kWh  in 2005.Source:  http://www.eia.doe.gov/cneaf/electricity/epa/fig7p5.html
residential price per kWh  in 2006.Source:  http://www.eia.doe.gov/cneaf/electricity/epa/fig7p5.html
residential price per kWh  in 2008.Source:  http://www.eia.doe.gov/cneaf/electricity/epa/fig7p5.html
residential price per kWh  in 2009.Source:  http://www.eia.doe.gov/cneaf/electricity/epa/fig7p5.html
Average Retail Price of Electricity to Ultimate Customers by End-Use Sector , 1997-2007 (current dollars)Data source: http://www.eia.doe.gov/cneaf/electricity/epa/epat7p4.html
 Regulation: PUHCAlimits the geographic spread (therefore, size) of utility holding companies, the kinds of business they may enter, the number of holding companies over a utility in a corporate heirarchy, and their capital structure; (2) controls the amount of debt (thus, cost of  capital), dividends, loans and guarantees based on utility subsidiaries (so the parents can’t loot or bankrupt the utility subsidiary), and the securities that parent companies may issue; Weakened by EPA of 2005
 Regulation: PUHCA(3) regulates self-dealing among affiliate companies and cross-subsidies of unregulated businesses by regulated businesses; (4) controls acquisitions of other utilities and other businesses; and, (5) limits common ownership of both electric and natural gas utilities.Weakened by EPA of 2005Lynn Hargis (September 2003) PUHCA FOR DUMMIES: An Electricity Blackout and Energy Bill Primer
deregulation 1999
Status of State Electric Industry Restructuring Activity-- as of February 2010 --Interactive version:http://www.eia.doe.gov/cneaf/electricity/page/restructuring/restructure_elect.html
Sept. 14, 2000Sue:  This is the time of year when government affairs has to prove how valuable it is to Ken Lay and Jeff Skilling . . . . Do you know when you started overscheduling load and making buckets of money on that?"Susan J. Mara, Enron's California director of regulatory affairs until December 2001 Overscheduling load — a tactic that Enron traders famously dubbed "Fat Boy" — involved purposely overstating how much electricity would be needed in the future, creating the appearance of power shortages and leading to inflated prices.
Sept. 14, 2000Tim:  "Well he [Jeffrey S. Richter] makes … between one and two [million] a day, which never shows up on any curve shift…. He steals money from California to the tune of about a million — "Timothy N. BeldenEnron's West Coast trading chief Unknown voice:  “Could you rephrase that?"Tim:  "OK…he, um, he arbitrages the California market to the tune of a million bucks or two a day."
Consolidation of industryBetween 1986-1998, 39 electric IOUs merged with other utilities in the industry.
Diversification of industry
Employment in industry
 LegislationThe Public Utility Regulatory Policies Act of 1978 (PURPA) stipulated that electric utilities had to interconnect with and buy, at the utilities' avoided cost, capacity and energy offered  by any nonutility facility meeting certain  criteria established by the Federal Energy Regulatory Commission (FERC). Repealed by EPA of 2005
 LegislationIn 1996, FERC issued Order 888 which opened transmission access to non- utilities, thereby establishing wholesale competition, and Order 889 which requires utilities to establish electronic systems to share information about available transmission capacity.
 Order 888 on stranded costsRecovery of stranded costs is perhaps the most contentious issue confronting regulators in promoting competition.  Stranded costs (or assets) are costs that have been prudently incurred by utilities to serve their customers but cannot be recovered if the consumers choose other electricity suppliers.One study has estimated current stranded assets at $88 billion, and estimates of projected stranded costs range from $10 billion to $500 billion.
 LegislationThe Energy Policy Act of 1992 (EPACT) opened access to transmission networks and exempted certain nonutilities from the restrictions of the Public Utility Holding Company Act of 1935 (PUHCA)Energy Policy Act of 2005 (555 pages) CBO Summary of the Energy Policy Act of 2005
OIL/GASLeft open the possibility of opening the Arctic National Wildlife Refuge in Alaska to oil and gas drilling.
Suspended federal royalty payments five years for drilling in Gulf of Mexico deep water of more than 400 meters.
Requires the designation of corridors for oil, gas, and hydrogen pipelines and electricity transmission and distribution corridors on Federal land in certain contiguous Western States and on Federal land in States other than the contiguous Western States (ie. the East and HI and AK)   Photo source:  U.S. Fish and Wildlife Service.  See http://www.savearcticrefuge.org/sections/photo.html
FUEL/TRANSPORTATIONLimits product liability for makers of methyl tertiary butyl ether (MTBE), a fuel additive and suspected carcinogen that has fouled groundwater in cities across the nation.
Bans MTBE use by 2014 and gives more than $3.8 billion in transition aid for MTBE makers to switch to other products.

W6energy

  • 1.
    URP 337 Planningpublic infrastructureWeek 62 May 2011
  • 4.
    Sometimes energy-related infrastructurerepresents a landuseEnergyUtilitiesWhy else should planners care?
  • 5.
  • 6.
    Yucca Mountain Nevadawill it not be used to store nuclear waste. Where will it go? As advocates for the environment.
  • 7.
    As advocates forthose with less privilege.
  • 8.
  • 9.
    (Especially in fuelstorage)Infrastructure for the provision of energy has many planning dimensionsConsider gasoline…
  • 10.
    Photo in Longstreth,fig 10: Foy’s service station, 211 N Figueroa, Los Angeles, 1928.
  • 11.
    Big oil andthe monkey wrench entrepreneurPhoto in Longstreth, fig 30: Texaco “type C,” probably west coast, 1937.
  • 12.
    Gasoline distribution todayPhotofrom Violence Policy Center, “Sitting Ducks: The Threat to the Chemical and Refinery Industry From 50 Caliber Sniper Rifles.”: http://www.vpc.org/studies/ducktwo.htm
  • 13.
    Gasoline distribution: NJ tank farmPhoto from SPROL: “worst places in the world”http://www.sprol.com/
  • 14.
  • 15.
    Tank farmSource: image provided by Chevron. Downloaded from:http://tonto.eia.doe.gov/kids/energy.cfm?page=oil_home-basics
  • 16.
    Source: imageprovided by Argonne National Laboratory. Downloaded from:http://www.energy.ca.gov/2009_energypolicy/documents/2009-08-24_workshop/presentations/08_CEC_Schremp_Imports_and_Pipeline_Exports.pdfSource
  • 17.
    Petroleum pipelines toand from CAhttp://www.energy.ca.gov/reports/2003-09-09_600-03-014F.PDFhttp://www.energy.ca.gov/fuels/pipeline/documents/Fig1_Major_Refined_Pipeline.PDF
  • 18.
  • 19.
    U.S. Natural GasSupply Basins Relative to Major Natural Gas Pipeline Transportation Corridors, 2008
  • 20.
    Major Changes inNatural Gas Pipeline Transportation Capacity, 1998-2008http://www.eia.doe.gov/pub/oil_gas/natural_gas/analysis_publications/ngpipeline/comparemapm.pps
  • 21.
    “Electricity is specialbecause it cannot be stored”neither can fire!Electricity(it still involves land uses)
  • 22.
    Recall: Three sorts of “snapshots” for analyzing infrastructure “events”: Micro economics, in this case looking at potentials for monopolies. Also looking at notion of “non-redeployable investment.”Inventory of stakeholders and their interests and for institutional change.A look at the technological landscape and its inter-relationships with environmental goals and price elasticities of fuels.
  • 23.
    Recall:Three questions toguide inquiries of infrastructure: By what process(es) was it constituted and is it sustained?Where do opportunities for change lie within those processes?Is a better infrastructure outcome imaginable? If so, can it be realized by exploiting the opportunities for change that have been identified?
  • 24.
    By what process(es)was it constituted and is it sustained?
  • 25.
  • 27.
    Schematic of infrastructurefor electricityFigure source: http://www.eia.doe.gov/basics/electricity_basics.htmlgenerationtransmissiondistributionnatural monopoliesderegulation was limited to
  • 28.
    Schematic of infrastructurefor electricityFigure source: http://www.eia.doe.gov/basics/electricity_basics.htmlgenerationtransmissiondistributionOn-site generation technologies may reduce the importance of these pieces
  • 29.
    Energy supplyStructureof industryThree components:GenerationTransmissionDistributionLegislation
  • 35.
    ghu took outghuput innet purchase
  • 36.
    Generationgeneric thermal generatorwww.eia.doe.gov/cneaf/electricity/chg_stru_update/fig3a.htmlSchematicof Gas Turbinewww.eia.doe.gov/cneaf/electricity/chg_stru_update/fig3b.htmlSchematic of Combined Cyclewww.eia.doe.gov/cneaf/electricity/chg_stru_update/fig3b.htmlCogeneration Schematicwww.eia.doe.gov/cneaf/electricity/chg_stru_update/fig3b.html
  • 37.
    U.S. Electric PowerIndustry Net Generation, 2009Source:Figure ES1 http://www.eia.doe.gov/cneaf/electricity/epa/epa_sum.html
  • 38.
    Source:http://www.eia.doe.gov/cneaf/electricity/chg_stru_update/fig5.htmlsee also:http://www.eia.doe.gov/state/large icons~ 10 GW of capacity, not individual plants, in a regional area for each fuel source. smaller icons ~ 5 GW capacity. http://www.eia.doe.gov/state/state-energy-profiles.cfm?sid=CA
  • 39.
    Transmission Ownership inthe United StatesSource:http://www.eia.doe.gov/cneaf/electricity/chg_stru_update/fig6.html
  • 40.
    North American ElectricReliability CouncilNERC regionshttp://www.eia.doe.gov/cneaf/electricity/chg_str_fuel/html/fig02.html
  • 41.
    Geographic reliabilityIOU=Investor ownedutilityFeds=Fed gov’tOther=municipal utilities & moreCo-ops=non-profit cooperative utilities
  • 42.
    Comparison of 750kWh per month bill (CA avg)Does municipal vs IOU make a difference?
  • 43.
  • 45.
    CA has relativelyclean energySource: Environmental Integrity Project (May 2005). Dirty Kilowatts: America’s most polluting power plants. http://www.environmentalintegrity.org/
  • 46.
    California’s energy isclean because relatively little coal is used in its generation
  • 47.
    No CA plantsare on this graphSource: Environmental Integrity Project (March 2010). Dirty Kilowatts: America’s most polluting power plants. http://www.environmentalintegrity.org/news_reports/documents/DirtyKilowatts-Top50MercuryPowerPlantReport.pdf
  • 48.
    notes on COALfor twenty-something Californians
  • 51.
    TVA Coal-fired powerplant accident, 22 Dec 2008 atTennessee’s Kingston Fossil PlantNASA imageshttp://earthobservatory.nasa.gov/NaturalHazards/view.php?id=36352American News Project Videohttp://www.environmentalintegrity.org/index.phpEPA cleanup web sitehttp://www.epakingstontva.com/nature_extent.aspx
  • 52.
    Energy utilitiesDeliver energyto customers in homes, offices, shops, etcSell electricity, natural gas, oil, coal, and other energy sourcesInclude public and private sector suppliersprivate sector suppliers include investor-owned as well as privately held
  • 53.
    Distribution of consumptionby sector, 2008/9Data source: http://www.eia.doe.gov/cneaf/electricity/epa/epat7p2.htmlhttp://www.eia.doe.gov/cneaf/electricity/st_profiles/california.html
  • 54.
    Revenue by Sector1993-2004in $millionsData source: http://www.eia.doe.gov/cneaf/electricity/
  • 55.
    Energy Consumption bySectorin quadrillion Btu
  • 56.
    Source:Statistical Abstract ofthe U.S., 1997, Table 921.
  • 57.
    Electric generation capacity,selected sourcesstotalin gigawattssources
  • 59.
    residential price perkWh in 2005.Source: http://www.eia.doe.gov/cneaf/electricity/epa/fig7p5.html
  • 60.
    residential price perkWh in 2006.Source: http://www.eia.doe.gov/cneaf/electricity/epa/fig7p5.html
  • 61.
    residential price perkWh in 2008.Source: http://www.eia.doe.gov/cneaf/electricity/epa/fig7p5.html
  • 62.
    residential price perkWh in 2009.Source: http://www.eia.doe.gov/cneaf/electricity/epa/fig7p5.html
  • 63.
    Average Retail Priceof Electricity to Ultimate Customers by End-Use Sector , 1997-2007 (current dollars)Data source: http://www.eia.doe.gov/cneaf/electricity/epa/epat7p4.html
  • 64.
    Regulation: PUHCAlimitsthe geographic spread (therefore, size) of utility holding companies, the kinds of business they may enter, the number of holding companies over a utility in a corporate heirarchy, and their capital structure; (2) controls the amount of debt (thus, cost of capital), dividends, loans and guarantees based on utility subsidiaries (so the parents can’t loot or bankrupt the utility subsidiary), and the securities that parent companies may issue; Weakened by EPA of 2005
  • 65.
    Regulation: PUHCA(3)regulates self-dealing among affiliate companies and cross-subsidies of unregulated businesses by regulated businesses; (4) controls acquisitions of other utilities and other businesses; and, (5) limits common ownership of both electric and natural gas utilities.Weakened by EPA of 2005Lynn Hargis (September 2003) PUHCA FOR DUMMIES: An Electricity Blackout and Energy Bill Primer
  • 66.
  • 67.
    Status of StateElectric Industry Restructuring Activity-- as of February 2010 --Interactive version:http://www.eia.doe.gov/cneaf/electricity/page/restructuring/restructure_elect.html
  • 68.
    Sept. 14, 2000Sue: This is the time of year when government affairs has to prove how valuable it is to Ken Lay and Jeff Skilling . . . . Do you know when you started overscheduling load and making buckets of money on that?"Susan J. Mara, Enron's California director of regulatory affairs until December 2001 Overscheduling load — a tactic that Enron traders famously dubbed "Fat Boy" — involved purposely overstating how much electricity would be needed in the future, creating the appearance of power shortages and leading to inflated prices.
  • 69.
    Sept. 14, 2000Tim: "Well he [Jeffrey S. Richter] makes … between one and two [million] a day, which never shows up on any curve shift…. He steals money from California to the tune of about a million — "Timothy N. BeldenEnron's West Coast trading chief Unknown voice: “Could you rephrase that?"Tim: "OK…he, um, he arbitrages the California market to the tune of a million bucks or two a day."
  • 70.
    Consolidation of industryBetween1986-1998, 39 electric IOUs merged with other utilities in the industry.
  • 71.
  • 72.
  • 73.
    LegislationThe PublicUtility Regulatory Policies Act of 1978 (PURPA) stipulated that electric utilities had to interconnect with and buy, at the utilities' avoided cost, capacity and energy offered by any nonutility facility meeting certain criteria established by the Federal Energy Regulatory Commission (FERC). Repealed by EPA of 2005
  • 74.
    LegislationIn 1996,FERC issued Order 888 which opened transmission access to non- utilities, thereby establishing wholesale competition, and Order 889 which requires utilities to establish electronic systems to share information about available transmission capacity.
  • 75.
    Order 888on stranded costsRecovery of stranded costs is perhaps the most contentious issue confronting regulators in promoting competition. Stranded costs (or assets) are costs that have been prudently incurred by utilities to serve their customers but cannot be recovered if the consumers choose other electricity suppliers.One study has estimated current stranded assets at $88 billion, and estimates of projected stranded costs range from $10 billion to $500 billion.
  • 76.
    LegislationThe EnergyPolicy Act of 1992 (EPACT) opened access to transmission networks and exempted certain nonutilities from the restrictions of the Public Utility Holding Company Act of 1935 (PUHCA)Energy Policy Act of 2005 (555 pages) CBO Summary of the Energy Policy Act of 2005
  • 77.
    OIL/GASLeft open thepossibility of opening the Arctic National Wildlife Refuge in Alaska to oil and gas drilling.
  • 78.
    Suspended federal royaltypayments five years for drilling in Gulf of Mexico deep water of more than 400 meters.
  • 79.
    Requires the designationof corridors for oil, gas, and hydrogen pipelines and electricity transmission and distribution corridors on Federal land in certain contiguous Western States and on Federal land in States other than the contiguous Western States (ie. the East and HI and AK)   Photo source: U.S. Fish and Wildlife Service. See http://www.savearcticrefuge.org/sections/photo.html
  • 80.
    FUEL/TRANSPORTATIONLimits product liabilityfor makers of methyl tertiary butyl ether (MTBE), a fuel additive and suspected carcinogen that has fouled groundwater in cities across the nation.
  • 81.
    Bans MTBE useby 2014 and gives more than $3.8 billion in transition aid for MTBE makers to switch to other products.