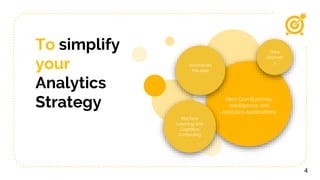
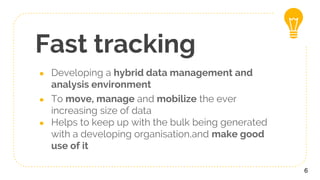
An analysis:
Simplify Your
Analytics Strategy
by Narendra Mulani
Often,
Data+Analytics
=
confusion
2
Companies often get
entangled in their complicated
web of data because they try to
chase every relevant pattern and
insight.
3
To simplify
your
Analytics
Strategy
4
Next Gen Business
Intelligence and
Analytics Applications
Accelerate
the data
Machine
Learning and
Cognitive
Computing
Data
discover
y
Accelerate data
Fast data = fast insight = fast outcomes
1
Fast tracking
● Developing a hybrid data management and
analysis environment
● To move, manage and mobilize the ever
increasing size of data
● Helps to keep up with the bulk being generated
with a developing organisation,and make good
use of it
6
Intelligence and
applications
Simplifying advanced analytics by user friendly interfaces
2
● Technology used to break down high
complexity data into user friendly
applications and appealing visuals
● Enables managers and executives to use,
interact and interpret the data
● Easy to gain insights from data presented in
convenient format that allows us to adjust
ranges, modify scale, change parameters etc.
8
MANAGERIAL
RELEVANCE
In context to India
9
Using interactive
technology in companies
 The burden no longer resides only on
the shoulders of the technology team.
The work load of discovering patterns
is distributed and delegated to the
entire team through the user friendly
and interactive technology, which
permits them to play around with data
too.
 This effectively allows a larger
audience to look at the same data
from multiple perspectives and gain
varied insights
Increases the involvement of the team
in decision making process, thus
imparting a feeling of responsibility
and accountability to the team and
company
10
Fast tracking data
anaysis
 Investing in the right
technology to create a
conducive environment
for handling big data and
analysis can save a great
deal of time, and effort
 The initial inhibition with
bulky data is removed by
using management tools
that tame the large
amount of data that is
dealt with by a company
on a day to day basis
11
 This gives the team
more time to focus
their attention to
important questions
and narrow down
onto relevant
details
12
Thanks!
Credits
Special thanks to all the people who made and
released these awesome resources for free:
● Presentation template by SlidesCarnival
● Photographs by Unsplash
13
Presentation design
This presentation uses the following typographies:
● Titles: Raleway ExtraBold
● Body copy: Raleway Light
You can download the fonts at
https://www.fontsquirrel.com/fonts/raleway
You don’t need to keep this slide in your presentation. It’s only here to serve you as a design
guide if you need to create new slides or download the fonts to edit the presentation in
PowerPoint®
14
SlidesCarnival icons are editable
shapes.
This means that you can:
● Resize them without losing
quality.
● Change fill color and
opacity.
● Change line color, width
and style.
Isn’t that nice? :)
Examples:
15

W4 d5

  • 1.
    An analysis: Simplify Your AnalyticsStrategy by Narendra Mulani
  • 2.
  • 3.
    Companies often get entangledin their complicated web of data because they try to chase every relevant pattern and insight. 3
  • 4.
    To simplify your Analytics Strategy 4 Next GenBusiness Intelligence and Analytics Applications Accelerate the data Machine Learning and Cognitive Computing Data discover y
  • 5.
    Accelerate data Fast data= fast insight = fast outcomes 1
  • 6.
    Fast tracking ● Developinga hybrid data management and analysis environment ● To move, manage and mobilize the ever increasing size of data ● Helps to keep up with the bulk being generated with a developing organisation,and make good use of it 6
  • 7.
    Intelligence and applications Simplifying advancedanalytics by user friendly interfaces 2
  • 8.
    ● Technology usedto break down high complexity data into user friendly applications and appealing visuals ● Enables managers and executives to use, interact and interpret the data ● Easy to gain insights from data presented in convenient format that allows us to adjust ranges, modify scale, change parameters etc. 8
  • 9.
  • 10.
    Using interactive technology incompanies  The burden no longer resides only on the shoulders of the technology team. The work load of discovering patterns is distributed and delegated to the entire team through the user friendly and interactive technology, which permits them to play around with data too.  This effectively allows a larger audience to look at the same data from multiple perspectives and gain varied insights Increases the involvement of the team in decision making process, thus imparting a feeling of responsibility and accountability to the team and company 10
  • 11.
    Fast tracking data anaysis Investing in the right technology to create a conducive environment for handling big data and analysis can save a great deal of time, and effort  The initial inhibition with bulky data is removed by using management tools that tame the large amount of data that is dealt with by a company on a day to day basis 11  This gives the team more time to focus their attention to important questions and narrow down onto relevant details
  • 12.
  • 13.
    Credits Special thanks toall the people who made and released these awesome resources for free: ● Presentation template by SlidesCarnival ● Photographs by Unsplash 13
  • 14.
    Presentation design This presentationuses the following typographies: ● Titles: Raleway ExtraBold ● Body copy: Raleway Light You can download the fonts at https://www.fontsquirrel.com/fonts/raleway You don’t need to keep this slide in your presentation. It’s only here to serve you as a design guide if you need to create new slides or download the fonts to edit the presentation in PowerPoint® 14
  • 15.
    SlidesCarnival icons areeditable shapes. This means that you can: ● Resize them without losing quality. ● Change fill color and opacity. ● Change line color, width and style. Isn’t that nice? :) Examples: 15