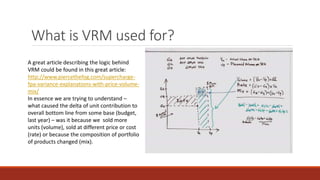
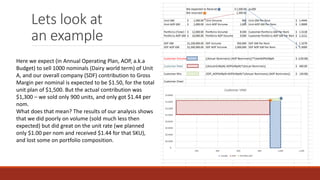
Volume Revenue Mix
(VRM) model
AS IMPLEMENTED IN SAPUTO INC.
What is VRM used for?
A great article describing the logic behind
VRM could be found in this great article:
http://www.piercethefog.com/supercharge-
fpa-variance-explanations-with-price-volume-
mix/
In essence we are trying to understand –
what caused the delta of unit contribution to
overall bottom line from some base (budget,
last year) – was it because we sold more
units (volume), sold at different price or cost
(rate) or because the composition of portfolio
of products changed (mix).
Lets look at
an example
Here we expect (in Annual Operating Plan, AOP, a.k.a
Budget) to sell 1000 nominals (Dairy world term) of Unit
A, and our overall company (SDF) contribution to Gross
Margin per nominal is expected to be $1.50, for the total
unit plan of $1,500. But the actual contribution was
$1,300 – we sold only 900 units, and only got $1.44 per
nom.
What does that mean? The results of our analysis shows
that we did poorly on volume (sold much less then
expected) but did great on the unit rate (we planned
only $1.00 per nom and received $1.44 for that SKU),
and lost some on portfolio composition.
Why is this important?
Well, the idea is that we would like to understand what caused deviations. If (for example) we
have determined that the volume variations were caused by factors outside of sales manager’s
control, then this manager should get praise for keeping his profitability up in such adverse
conditions. We can also run several VRMs – and try to isolate the rate changes that are caused
by volatile market from the ones that are caused by predictable and controllable moves.
Such alteration of accounting data gives meaning to numbers, and allows us to set up KPIs to
quickly flag areas that require attention, or justify review of portfolio composition or pricing
changes.
How did we implement it?
We are calculating VRM on a SQL server for
each combination of item-customer per
month and adding it to the Business
intelligence data cube, that allows our users
free navigation and data analytics on
Customer groups, product categories, sales
channels, time series, etc. Our customers can
either use canned reports or use MS Excel
Pivot tables to build their own analytics on the
fly
This is what KPIs look like

VRM

  • 1.
    Volume Revenue Mix (VRM)model AS IMPLEMENTED IN SAPUTO INC.
  • 2.
    What is VRMused for? A great article describing the logic behind VRM could be found in this great article: http://www.piercethefog.com/supercharge- fpa-variance-explanations-with-price-volume- mix/ In essence we are trying to understand – what caused the delta of unit contribution to overall bottom line from some base (budget, last year) – was it because we sold more units (volume), sold at different price or cost (rate) or because the composition of portfolio of products changed (mix).
  • 3.
    Lets look at anexample Here we expect (in Annual Operating Plan, AOP, a.k.a Budget) to sell 1000 nominals (Dairy world term) of Unit A, and our overall company (SDF) contribution to Gross Margin per nominal is expected to be $1.50, for the total unit plan of $1,500. But the actual contribution was $1,300 – we sold only 900 units, and only got $1.44 per nom. What does that mean? The results of our analysis shows that we did poorly on volume (sold much less then expected) but did great on the unit rate (we planned only $1.00 per nom and received $1.44 for that SKU), and lost some on portfolio composition.
  • 4.
    Why is thisimportant? Well, the idea is that we would like to understand what caused deviations. If (for example) we have determined that the volume variations were caused by factors outside of sales manager’s control, then this manager should get praise for keeping his profitability up in such adverse conditions. We can also run several VRMs – and try to isolate the rate changes that are caused by volatile market from the ones that are caused by predictable and controllable moves. Such alteration of accounting data gives meaning to numbers, and allows us to set up KPIs to quickly flag areas that require attention, or justify review of portfolio composition or pricing changes.
  • 5.
    How did weimplement it? We are calculating VRM on a SQL server for each combination of item-customer per month and adding it to the Business intelligence data cube, that allows our users free navigation and data analytics on Customer groups, product categories, sales channels, time series, etc. Our customers can either use canned reports or use MS Excel Pivot tables to build their own analytics on the fly
  • 6.
    This is whatKPIs look like