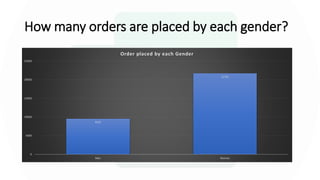
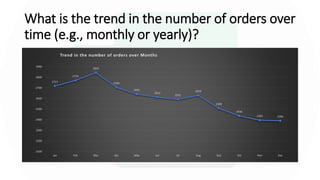
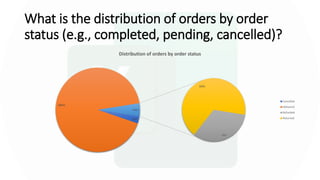
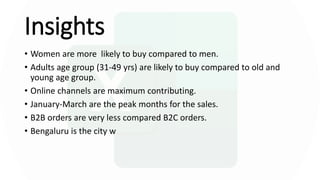
The document presents a data analysis of the Vrinda store, revealing a total of 31,047 orders generating ₹ 2,14,41,209 in revenue, with an average order value of ₹ 691. Women's orders surpass men's, and the highest sales volume is in the set category, while Bengaluru leads in shipping locations. Key insights include the dominance of online channels, a peak in sales during January to March, and a low ratio of B2B to B2C orders.


![UX 아카데미 오픈프로젝트 [ 올리브영 - UX/UI 개선]](https://cdn.slidesharecdn.com/ss_thumbnails/rbuxa22tholiveyoung-230518015252-0457c460-thumbnail.jpg?width=640&height=640&fit=bounds)
![UX 아카데미 오픈프로젝트 [호갱노노 - UX/UI 개선]](https://cdn.slidesharecdn.com/ss_thumbnails/rbuxa9thhogangnonofinal-200102071702-thumbnail.jpg?width=640&height=640&fit=bounds)
![[모비데이즈] 2022 상반기 금융시장 동향_2022년 8월.pdf](https://cdn.slidesharecdn.com/ss_thumbnails/202220228-220729030411-dc115f49-thumbnail.jpg?width=640&height=640&fit=bounds)
![[Rightbrain UX Academy] Skyscanner UX/UI개선](https://cdn.slidesharecdn.com/ss_thumbnails/ru10skyscanneruxui-200512045741-thumbnail.jpg?width=640&height=640&fit=bounds)

![UX 아카데미 오픈프로젝트 [무신사 - UX/UI 개선]](https://cdn.slidesharecdn.com/ss_thumbnails/rbuxa21thmusinsa-231024011442-572e4f32-thumbnail.jpg?width=640&height=640&fit=bounds)
![[Rightbrain UX Academy] Netflix UX/UI개선](https://cdn.slidesharecdn.com/ss_thumbnails/ru10netflixuxui-200507014157-thumbnail.jpg?width=640&height=640&fit=bounds)

![라이트브레인 UX 아카데미 8기 오픈프로젝트 [Airbnb 어플리케이션 UX/UI개선 Design]](https://cdn.slidesharecdn.com/ss_thumbnails/ruuxa8thairbnb-190801021538-thumbnail.jpg?width=640&height=640&fit=bounds)
![UX 아카데미 오픈프로젝트 [ 배달의민족 - UX/UI 개선]](https://cdn.slidesharecdn.com/ss_thumbnails/rbuxa22thbaemin-230627010602-bfbc4389-thumbnail.jpg?width=640&height=640&fit=bounds)


![UX 아카데미 오픈프로젝트 [Youtube - UX/UI 개선]](https://cdn.slidesharecdn.com/ss_thumbnails/rbuxa9thyoutubefinal-200102071056-thumbnail.jpg?width=640&height=640&fit=bounds)

![UX 아카데미 오픈프로젝트 [쿠팡이츠 - UX/UI 개선]](https://cdn.slidesharecdn.com/ss_thumbnails/rbuxa20coupangeats-221226074523-66d02e9c-thumbnail.jpg?width=640&height=640&fit=bounds)

![UX 아카데미 오픈프로젝트 [클럽하우스- UX/UI 개선]](https://cdn.slidesharecdn.com/ss_thumbnails/rbuxa14thclubhousefinal-210531053946-thumbnail.jpg?width=640&height=640&fit=bounds)
![[Rightbrain UX Academy] Megabox UX/UI개선](https://cdn.slidesharecdn.com/ss_thumbnails/ru10megaboxuxui-200529010953-thumbnail.jpg?width=640&height=640&fit=bounds)
![UX 아카데미 오픈프로젝트 [29cm - UX/UI 개선]](https://cdn.slidesharecdn.com/ss_thumbnails/rbuxa23th29cm-230925015255-bb4d8ae4-thumbnail.jpg?width=640&height=640&fit=bounds)


![[메조미디어] Z세대의 금융 트렌드, 자이낸스 리포트](https://cdn.slidesharecdn.com/ss_thumbnails/ssmezzomedia202303-230228014232-eeef6be2-thumbnail.jpg?width=640&height=640&fit=bounds)


