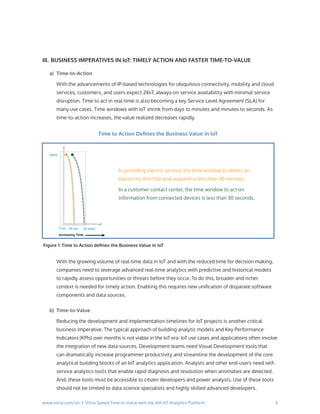
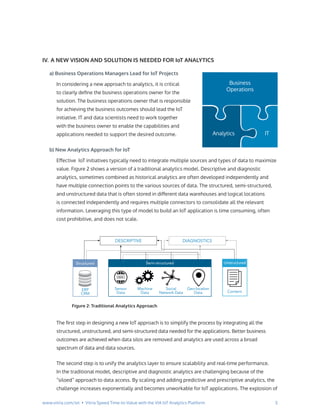
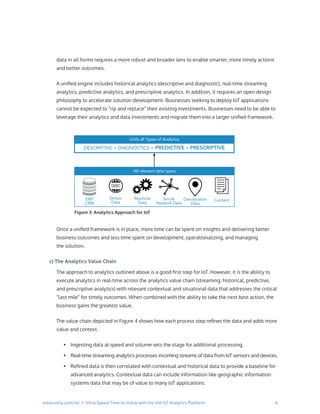
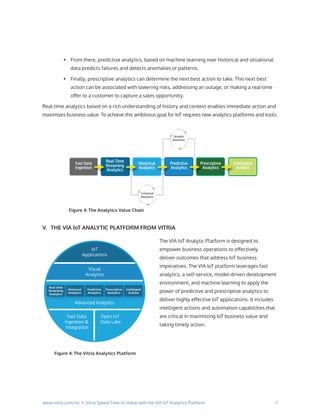
The document discusses the need for a new IoT analytics platform to help organizations accelerate time-to-value from IoT projects and enable timely actions. It introduces the VIA IoT Analytics Platform from Vitria, which aims to address this need by providing a unified platform for fast data ingestion, open data lakes, advanced analytics across streaming, historical, predictive and prescriptive models, and tools to enable rapid application development and insights. The platform is designed to empower operations managers to improve processes and business outcomes through smarter, faster analytics and actions using IoT data.
2. www.vitria.com/iot ā¢ Vitria Speed Time-to-Value with the VIA IoT Analytics Platformwww.vitria.com/iot ā¢ Vitria Speed Time-to-Value with the VIA IoT Analytics Platform
TABLE OF CONTENTS
I. INTRODUCTION/SUMMARY .......................................................................................................................1
II. MARKET POTENTIAL......................................................................................................................................2
III. BUSINESS IMPERATIVES IN IoT: TIMELY ACTION AND FASTER TIME-TO-VALUE................. 4
a) Time-to-Action
b) Time-to-Value
IV. A NEW VISION AND SOLUTION IS NEEDED FOR IoT ANALYTICS..............................................5
a) Business Operations Managers Lead for IoT Projects
a) New Analytics Approach for IoT
c) The Analytics Value Chain
V. THE VIA IoT ANALYTIC PLATFORM FROM VITRIA..............................................................................7
a) Fast Data Ingestion and Integration
b) Open IoT Data Lakes
c) Advanced Analytic
d) Analytic Data Flow
e) Visual Analytics
f) IoT Applications
VI. INNOVATION & FASTER BUSINESS OUTCOMES ā
THE VIA IoT ANALYTICS PLATFORM FROM VITRIA ........................................................................ 13
VII. SUMMARY/CONCLUSION.........................................................................................................................14
3. 1www.vitria.com/iot ā¢ Vitria Speed Time-to-Value with the VIA IoT Analytics Platform
I. INTRODUCTION/SUMMARY
The vast quantity of data available today combined with advanced analytics capabilities can yield more
revenue, lower costs, and improve business processes. While the market value and potential of IoT is high,
the time and skill required to develop and implement these projects is often a barrier to implementation.
There is a need for a new kind of analytics platform that helps organizations speed development and
enables implementation of the right actions to improve processes and business outcomes.
With the ability to connect millions of devices, IoT can yield an overwhelming amount of new data
and new business insight. Operations managers are being tasked with leveraging this streaming data
to detect anomalies, predict problems early, mitigate any disruption of service, and provide new
customer experiences.
In addition to the explosive growth of streaming data, time is now measured in seconds and
milliseconds and real-time decision-making with rapid response is needed to remain competitive.
Organizations must be nimble to capture opportunities in this dynamic market environment.
Operations managers must address the need for faster analytics across static, historical, and streaming
data. They need to have IoT analytic solutions developed faster to gain the critical business insights
needed to transform and improve business processes.
Addressing these challenges and opportunities requires:
ā¢ Tools and services for faster analytics to handle the time critical nature of IoT challenges and
deal with the variety and volume of real-time streaming data at massive scale.
ā¢ Model-driven development tools to enable IoT and IT analysts and citizen developers to
innovate in days not months.
ā¢ Self-service analytics over real-time data, intuitive drill down and data exploration capabilities
that enable operations managers and users to monitor Key Performance Indicators, explore
problems, and take actions required quickly.
ā¢ Unifying historical, real-time streaming, and predictive analytics to build up rich context using
all types of analytics and take the next best action. This reduces operational risks/costs, drives
new revenue, and improves operating efficiency.
4. 2www.vitria.com/iot ā¢ Vitria Speed Time-to-Value with the VIA IoT Analytics Platform
The VIA IoT Analytics Platform from Vitria delivers a unified platform that focuses on addressing
the challenge of rapidly delivering better business outcomes and accelerating time-to-value for IoT
initiatives and projects.
It accomplishes this goal by providing an IoT analytics platform that:
ā¢ Delivers faster analytics in real-time by integrating the analytics value chain across streaming,
historical, predictive, and prescriptive analytics with relevant contextual and situational data that
improves the quality of actions and their results.
ā¢ Enables integration with third party predictive and prescriptive analytical models through an
open architecture that complements the core analytic engine of the VIA IoT Analytics Platform.
ā¢ Accelerates application development via a set of model-driven tools and automation that
empowers citizen developers and power analysts to create analytics solutions more rapidly, in
days not months
ā¢ Provides a rapid path to insights that enables organizations to take smarter actions that lead
rapidly to better business outcomes.
II. MARKET POTENTIAL
The industry estimates over 25 billion IoT devices by 20201
and $15 trillion of global GDP by 20302
. IoT
devices are proliferating across industries from manufacturing and utilities to retail. Whether itās a smart
grid or more efficient consumer shopping, the data from sensors or devices is continuously flowing
across the network.
Network connectivity of devices, equipment, factories, products and business processes is leading to
massive volumes of data every second. This volume of data combined with advanced analytics provides
the insights and patterns that can bring timely outcomes to improve operational efficiency, grow
revenue, and reduce risk.
1. Reducing risk impacts both revenue and cost. Examples include detecting and avoiding fraud or
systems intrusions, avoiding outages, and eliminating out of stock events.
2. Increasing efficiency though better management of key operational performance metrics by
using real-time monitoring and predictive analytics reduces cost. For example, in manufacturing,
a 1% improvement in operational efficiency, such as predictive maintenance and asset
optimization, translates into $300 billion in savings over 15 years.
3. Growing revenue through the introduction of new business models and services and
implementing predictive one-to-one marketing.
1
Gartner
2
General Electric, Wikibon
5. 3www.vitria.com/iot ā¢ Vitria Speed Time-to-Value with the VIA IoT Analytics Platform
Use Cases for the VIA IoT Analytics Platform from Vitria
Industry Outcomes
Utilities ā¢ Eliminate disruptions and service degradation with predictive maintenance
and proactive actions to prevent problems before they occur reducing:
ā exposure to regulatory penalties,
ā exposure to non-billable energy cost, and
ā customer complaints and escalations.
ā¢ Maintain a secure & resilient grid by detecting & preventing problems in
real-time minimizing variability in supply and demand.
ā¢ Transform operational process and reduce cost by:
ā Improving work force management and
ā Implementing smart metering
ā¢ Grow and maintain revenue by offering real-time pricing options such as
time of use and demand response services
ā¢ Improve emergency response preparedness
Banking ā¢ Identify early at-jeopardy transactions for closing and compliance
ā¢ Detect anomalies and fraud while in-progress
Telecommunications ā¢ Optimize networks in real time
ā¢ Implement one-to-one location-based marketing to increase revenue
ā¢ Improve customer intimacy and engagement processes to increase loyalty
Manufacturing ā¢ Maximize equipment uptime and establish reliable and resilient
manufacturing infrastructure with predictive maintenance
ā¢ Enhance client satisfaction and experience with faster deliveries and
dramatic lead time reductions
ā¢ Improve operational efficiency with real-time monitoring of complex
processes to spot anomalies, take automated action, and reduce defect rates
Retail ā¢ Shape demand via personalized offers and promotions in real-time by
matching available goods and services with location and preferences
ā¢ Optimize the supply chain through constant monitoring of inventory, Point
of Sales trends and external factors
ā¢ Leverage real-time sensing for context-based workforce management
ā¢ Leverage real-time monitoring to enhance the customer experience,
increase retention, and improve share of wallet
Service Providers ā¢ Improve service performance consistently meeting and exceeding
customer expectations
ā¢ Reduce or eliminate penalties for non-conformance against Service
Level Agreements
6. 4www.vitria.com/iot ā¢ Vitria Speed Time-to-Value with the VIA IoT Analytics Platform
III. BUSINESS IMPERATIVES IN IoT: TIMELY ACTION AND FASTER TIME-TO-VALUE
a) Time-to-Action
With the advancements of IP-based technologies for ubiquitous connectivity, mobility and cloud
services, customers, and users expect 24x7, always-on service availability with minimal service
disruption. Time to act in real-time is also becoming a key Service Level Agreement (SLA) for
many use cases. Time windows with IoT shrink from days to minutes and minutes to seconds. As
time-to-action increases, the value realized decreases rapidly.
With the growing volume of real-time data in IoT and with the reduced time for decision making,
companies need to leverage advanced real-time analytics with predictive and historical models
to rapidly assess opportunities or threats before they occur. To do this, broader and richer
context is needed for timely action. Enabling this requires new unification of disparate software
components and data sources.
b) Time-to-Value
Reducing the development and implementation timelines for IoT projects is another critical
business imperative. The typical approach of building analytic models and Key Performance
Indicators (KPIs) over months is not viable in the IoT era. IoT use cases and applications often involve
the integration of new data sources. Development teams need Visual Development tools that
can dramatically increase programmer productivity and streamline the development of the core
analytical building blocks of an IoT analytics application. Analysts and other end-users need self-
service analytics tools that enable rapid diagnosis and resolution when anomalies are detected.
And, these tools must be accessible to citizen developers and power analysts. Use of these tools
should not be limited to data science specialists and highly skilled advanced developers.
In providing electric service, the time window to detect an
electricity shortfall and respond is less than 30 minutes.
In a customer contact center, the time window to act on
information from connected devices is less than 30 seconds.
Increasing Time
30 mins
100%
5 ms 30 sec
Figure 1: Time to Action defines the Business Value in IoT
Time to Action Defines the Business Value in IoT
7. 5www.vitria.com/iot ā¢ Vitria Speed Time-to-Value with the VIA IoT Analytics Platform
IV. A NEW VISION AND SOLUTION IS NEEDED FOR IoT ANALYTICS
a) Business Operations Managers Lead for IoT Projects
In considering a new approach to analytics, it is critical
to clearly define the business operations owner for the
solution. The business operations owner that is responsible
for achieving the business outcomes should lead the IoT
initiative. IT and data scientists need to work together
with the business owner to enable the capabilities and
applications needed to support the desired outcome.
b) New Analytics Approach for IoT
Effective IoT initiatives typically need to integrate multiple sources and types of data to maximize
value. Figure 2 shows a version of a traditional analytics model. Descriptive and diagnostic
analytics, sometimes combined as historical analytics are often developed independently and
have multiple connection points to the various sources of data. The structured, semi-structured,
and unstructured data that is often stored in different data warehouses and logical locations
is connected independently and requires multiple connectors to consolidate all the relevant
information. Leveraging this type of model to build an IoT application is time consuming, often
cost prohibitive, and does not scale.
The first step in designing a new IoT approach is to simplify the process by integrating all the
structured, unstructured, and semi-structured data needed for the applications. Better business
outcomes are achieved when data silos are removed and analytics are used across a broad
spectrum of data and data sources.
The second step is to unify the analytics layer to ensure scalability and real-time performance.
In the traditional model, descriptive and diagnostic analytics are challenging because of the
āsiloedā approach to data access. By scaling and adding predictive and prescriptive analytics, the
challenge increases exponentially and becomes unworkable for IoT applications. The explosion of
Business
Operations
Analytics IT
Unify all Types of Analytics
All relevant data types
DESCRIPTIVE + DIAGNOSTICS + PREDICTIVE + PRESCRIPTIVE
Sensor
Data
Machine
Data
Social
Network Data
Geo-location
Data
ContentERP
CRM
Semi-structuredStructured
ERP
CRM
Unstructured
Content
Sensor
Data
Machine
Data
Social
Network Data
Geo-location
Data
DESCRIPTIVE DIAGNOSTICS
Figure 2: Traditional Analytics Approach
8. 6www.vitria.com/iot ā¢ Vitria Speed Time-to-Value with the VIA IoT Analytics Platform
data in all forms requires a more robust and broader lens to enable smarter, more timely actions
and better outcomes.
A unified engine includes historical analytics (descriptive and diagnostic), real-time streaming
analytics, predictive analytics, and prescriptive analytics. In addition, it requires an open design
philosophy to accelerate solution development. Businesses seeking to deploy IoT applications
cannot be expected to ārip and replaceā their existing investments. Businesses need to be able to
leverage their analytics and data investments and migrate them into a larger unified framework.
Once a unified framework is in place, more time can be spent on insights and delivering better
business outcomes and less time spent on development, operationalizing, and managing
the solution.
c) The Analytics Value Chain
The approach to analytics outlined above is a good first step for IoT. However, it is the ability to
execute analytics in real-time across the analytics value chain (streaming, historical, predictive,
and prescriptive analytics) with relevant contextual and situational data that addresses the critical
ālast mileā for timely outcomes. When combined with the ability to take the next best action, the
business gains the greatest value.
The value chain depicted in Figure 4 shows how each process step refines the data and adds more
value and context.
ā¢ Ingesting data at speed and volume sets the stage for additional processing.
ā¢ Real-time streaming analytics processes incoming streams of data from IoT sensors and devices.
ā¢ Refined data is then correlated with contextual and historical data to provide a baseline for
advanced analytics. Contextual data can include information like geographic information
systems data that may be of value to many IoT applications.
Unify all Types of Analytics
All relevant data types
DESCRIPTIVE + DIAGNOSTICS + PREDICTIVE + PRESCRIPTIVE
Sensor
Data
Machine
Data
Social
Network Data
Geo-location
Data
ContentERP
CRM
Semi-structuredStructured
ERP
CRM
Unstructured
Content
Sensor
Data
Machine
Data
Social
Network Data
Geo-location
Data
DESCRIPTIVE DIAGNOSTICS
Figure 3: Analytics Approach for IoT
9. 7www.vitria.com/iot ā¢ Vitria Speed Time-to-Value with the VIA IoT Analytics Platform
ā¢ From there, predictive analytics, based on machine learning over historical and situational
data predicts failures and detects anomalies or patterns.
ā¢ Finally, prescriptive analytics can determine the next best action to take. This next best
action can be associated with lowering risks, addressing an outage, or making a real-time
offer to a customer to capture a sales opportunity.
Real-time analytics based on a rich understanding of history and context enables immediate action and
maximizes business value. To achieve this ambitious goal for IoT requires new analytics platforms and tools.
V. THE VIA IoT ANALYTIC PLATFORM FROM VITRIA
The VIA IoT Analytic Platform is designed to
empower business operations to effectively
deliver outcomes that address IoT business
imperatives. The VIA IoT platform leverages fast
analytics, a self-service, model-driven development
environment, and machine learning to apply the
power of predictive and prescriptive analytics to
deliver highly effective IoT applications. It includes
intelligent actions and automation capabilities that
are critical in maximizing IoT business value and
taking timely action.
Temporal Analytics Engine
Command
Center
Streaming
Ingestion
(IoT Communications
and Protocols)
Data Warehouse
Data Lake
Real-time
Streaming
Analytics
Historical
Analytics
Predictive
Analytics
Prescriptive
Analytics
Intelligent
Actions
IoT
Applications
Advanced Analytics
Visual
Analytics
Fast Data
Ingestion &
Integration
Open IoT
Data Lake
Real-time
Streaming
Analytics
Historical
Analytics
Predictive
Analytics
Prescriptive
Analytics
Intelligent
Actions
IoT
Applications
Figure 4: The Vitria Analytics Platform
Contextual
Awareness
Situation
Awareness
Fast Data
Ingestion
Real-Time
Streaming
Analytics
Historical
Analytics
Predictive
Analytics
Prescriptive
Analytics
Intelligent
Actions
Figure 4: The Analytics Value Chain
10. 8www.vitria.com/iot ā¢ Vitria Speed Time-to-Value with the VIA IoT Analytics Platform
a) Fast Data Ingestion and Integration
Any analytics platform begins with the challenge of acquiring data from multiple sources. In
IoT, there is the additional challenge of ingesting real-time streaming data from a multitude of
devices. The VIA IoT platform addresses this challenge with its streaming ingestion capability.
b) Open IoT Data Lakes
The platformās open approach enables customers to leverage their existing data warehouses or
data lake solutions. This is another key foundational capability at the data access layer. These
existing data management solutions are unified into VIAās broader framework for comprehensive
analytics processing.
VIAās Open IoT Data Lake provides the open, scalable data services required to support the
complete analytics life-cycle: raw data ingestion, data enrichment, data exploration, model
building, and analytics processing. Data at all stages are captured, stored, secured, and
curated, along with its appropriate metadata. An Elastic Query Service supports access by IoT
applications, self-service analytics, and third party data consumers via SQL standards.
c) Advanced Analytics
The heart of the platformās differentiation is the Core Analytics Engine and its complementary
Analytic Data Flow. VIAās Core Analytics Engine delivers faster analytics in real-time with a unique
methodology that integrates the analytics value chain across streaming, historical, predictive and
prescriptive analytics with relevant contextual and situational data. VIAās ability to blend analytics
across time frames in real-time is not found in any other IoT analytics platform.
Contextual
Awareness
Situational
Awareness
Fast Data
Ingestion
Real-Time
Streaming
Analytics
Historical
Analytics
Predictive
Analytics
Prescriptive
Analytics
Intelligent
Actions
Temporal Analytics Engine
Figure 6: Vitria Temporal Analytics Engine
11. 9www.vitria.com/iot ā¢ Vitria Speed Time-to-Value with the VIA IoT Analytics Platform
VIAās Real-Time Streaming Analytics supports the scale and speed of the most demanding
IoT use cases ā often involving millions of events per second with fast, sub second processing
latency. Real-time descriptive analytics describes the world as it is right now and provides
contextual awareness and situational intelligence. Real-time predictive analytics predicts what
will happen next; while real-time prescriptive analytics prescribes the next best actions to
optimize business outcomes.
VIAās Historical Analytics provides the historical context for interpreting real-time analytics,
baselines for anomaly detection, and input for machine learning. The same analytical techniques
available for real-time analytics are also available for historical analytics and batch processing.
VIAās Descriptive Analytics describe the world as it is right now (real time) or as it was in the
past (historical). VIAās descriptive analytics includes KPIs and baselines, statistical summaries,
multidimensional analysis, pattern matching, anomaly detection, trend analysis, and behavioral
analytics. Descriptive analytics can be performed either continuously in real-time over streaming
data or periodically over large batches of data.
VIAās descriptive analytics capabilities include:
ā¢ Correlation
ā¢ KPIs
ā¢ Multidimensional Analysis
ā¢ Summary Statistics
ā¢ Anomaly Detection
ā¢ Geospatial
ā¢ Pattern Matching
ā¢ Time-series Analytics
ā¢ Population Analytics
ā¢ Trending
ā¢ Activity Analytics
ā¢ Behavioral Analytics
ā¢ Track and Trace
ā¢ Link Analysis
ā¢ Hypothesis Testing
ā¢ Root Cause Analysis
Predictive and Prescriptive Analytics supports regression, classification, and clustering using
hundreds of predictive techniques based on machine learning algorithms to recommend the
next best action based on the current situation and latest predictions. Hundreds of prescriptive
techniques are available. VIA can score predictive and prescriptive models in real time (streaming)
or batch mode and features elastic scaling over big and fast data.
12. 10www.vitria.com/iot ā¢ Vitria Speed Time-to-Value with the VIA IoT Analytics Platform
Machine learning provides a rich and flexible environment for continuous learning and
refinement. Machine learning is executed over historical data in the VIA Open IoT Data Lake to
produce predictive and prescriptive models. VIAās machine learning capabilities include:
ā¢ Supervised and unsupervised learning
ā¢ Repertoire of classification, regression, and clustering algorithms
ā¢ Visual design of analytic pipelines for model building and iterative refinement.
Machine learning algorithms supported by VIA to build predictive and prescriptive models includes:
ā¢ Clustering
ā¢ Neural Network
ā¢ Regression (linear)
ā¢ Logistic regression
ā¢ Decision Tree
ā¢ Support Vector Machine
ā¢ Random Forest
ā¢ Association Rules
ā¢ NaĆÆve Bayes Classification
ā¢ Time Series (ARIMA, ā¦)
ā¢ Exponential Smoothing
ā¢ k-Nearest Neighbors
ā¢ Scorecard Model
ā¢ Rule Set Model
ā¢ Plus, many more ā¦
Intelligent Action is the final key step in capturing analytics value. Predictive and prescriptive
analytics can trigger intelligent actions within VIAās process automation suite, which supports
both fully automated processes and human-guided workflows. It enables intelligent business
processes that are analytics-driven, situationally aware, and adaptive. Key capabilities include:
ā¢ Ability to act instantly using automated actions and processes directly triggered by
prescriptive analytics or rules
ā¢ Processes and guided workflows that can be specified rapidly using visual models based on
the Business Process Model and Notation standard.
ā¢ āIntelligent processesā that support adaptive process behavior based on continuous
situational and contextual awareness, and advanced analytics
ā¢ Integration with enterprise workflow systems, ERP, CRM, and other enterprise systems
ā¢ Analytics enablement of Business Process Management with adaptive capability to handle
IoT use cases where both complex logic and fast actions are required.
13. 11www.vitria.com/iot ā¢ Vitria Speed Time-to-Value with the VIA IoT Analytics Platform
VIAās unified platform and Core Analytics Engine are the keys to accelerating the pace through the
analytics value chain and simplifying the process. Each step in the process adds increasing value
and ultimately leads to concrete actions. By unifying ingestion of all types of analytics, real-time
contextual awareness, situational awareness, and intelligent actions, VIAās Core Analytics Engine
enables organizations to build applications that deliver dramatically reduced time-to-action and
time-to-value.
d) Analytic Data Flow
Analytic Data Flow is VIAās visual modeling environment that empowers citizen developers and
analysts to rapidly create analytics-based solutions using visual models requiring little or no
coding. ADF has a visual modeling paradigm for streaming and batch applications consisting of
descriptive, predictive, and prescriptive analytics. This visual modeling environment enables the
rapid creation of IoT Analytics solutions in days, not months.
A visual dataflow language enables solution developers to rapidly lay out āanalytic pipelinesā
consisting of multiple data and analytic processing steps using an extensible library of reusable
ādrag and dropā building blocks. Beyond the pre-built building blocks, ADF has an SDK to enable
the creation of custom libraries of reusable building blocks. Building blocks include:
ā¢ Data sources and target connectors supporting protocols and data formats for a wide
variety of data
ā¢ Data preparation (e.g. filter, parse, transform, enrich)
ā¢ Descriptive analytics, including, correlation, statistical summaries, multi-dimensional
analysis, KPI computation, pattern matching, trending
ā¢ Machine learning, supporting a wide variety of regression, classification and
clustering algorithms
ā¢ Predictive and prescriptive analytics, based on machine learning models and supporting
real-time streaming, online, and batch processing
ā¢ SDK for encapsulating custom-built or imported code and creating custom libraries of
reusable blocks.
ā¢ Time-series analytics with deep capabilities for handling delayed and out-of-order events
ā¢ Geo-spatial analytics with built-in libraries optimized for fast geospatial analysis
ā¢ State machines for pattern matching.
VIAās ADF Modeling Environment supports interactive testing with runtime debugging, and
provides full lifecycle management of ADF models. ADFās runtime environment manages the
deployment and secure running of ADF analytic pipelines. The runtime environment manages
the data flows and the handling of late and out-order-events. Leveraging leading big data
14. 12www.vitria.com/iot ā¢ Vitria Speed Time-to-Value with the VIA IoT Analytics Platform
technologies, including Spark and Hadoop, ADF provides a robust, scale-out architecture, and can
handle volumes exceeding tens of billions of events per day.
e) Visual Analytics
VIAās Visual Analytic tools accelerate IoT insight and support and enable the right decision or
action to be taken at the right time.
VIAās Visual Explorer makes it easy for operations and business analysts to explore and visualize
analytical results, identify key relationships, spot anomalies, test hypotheses, and diagnose
problems. The Visual explorer capabilities include:
ā¢ Joining data from disparate data sources
ā¢ Interactively exploring real-time and historic data
ā¢ Ad-hoc computation of roll-ups and aggregations
ā¢ Saving analytic perspectives into operational dashboards
ā¢ Pivot analysis with rich visual options
ā¢ Discovering correlations
ā¢ Testing hypotheses
The Visual Explorer is perfect for diagnostic analytics to rapidly discover patterns, uncover root
causes, and gain the insight needed to address issues and opportunities.
VIAās Dashboard Builder makes it easy to design visually rich and interactive dashboards that
deliver real-time visibility of Key Performance Indicators, provide situational awareness, and
enable the interactions to analyze faults, action and implement problem resolution.
Key capabilities include:
ā¢ Real-time operational intelligence on a āsingle pane of glassā
ā¢ Streaming of real-time analytics to the glass
ā¢ āMash-upā real-time, historical, and contextual data
ā¢ Overlay of multiple datasets on geospatial maps, charts, and other visualizations
ā¢ Configure interactive controls for drill-down, drill-in, zooming, and roll-ups.
ā¢ Custom forms to enable seamless integration of actions
ā¢ Support any device or location ā mobile / pad / tablet
ā¢ Select from a large and growing library of charts and graphs ā data grids, gauges, heat
maps, bubble charts, and many more
ā¢ Playback time series data and analytics using innovative āDVR-likeā controls
15. 13www.vitria.com/iot ā¢ Vitria Speed Time-to-Value with the VIA IoT Analytics Platform
e) IoT Applications
Each of the functional capabilities described is important, but to meet the business imperatives for
IoT ā speed to value and scalability requires that the user interface, model-driven development
environment, analytics engine, data access and visualization tools all work in harmony.
Designed from the outset to drive faster analytics, more rapid IoT innovation, and smarter action,
VIA IoT Analytics is an open platform that can interoperate with various other forms of predictive
analytics and data warehouse technologies. Its design accommodates in-place technologies and
analytics and works seamlessly with them to deliver a unified IoT application that delivers better
outcomes faster.
VI. INNOVATION & FASTER BUSINESS OUTCOMES ā THE VIA IoT ANALYTICS PLATFORM
FROM VITRIA
Achieving better outcomes faster can only be done if the intelligence and associated action is executed
in seconds, or in some cases, sub-seconds. The VIA IoT Analytics platform provides faster analytics in
real-time via its unique Core Analytics Engine. Figure 7 illustrates how faster analytics delivered from
VIA builds value.
Business Value with Temporal Analytics Engine
Value
Fast Data
Ingestion
Real-Time
Streaming
Analytics
Historical
Analytics
Predictive
Analytics
Prescriptive
Analytics
Intelligent
Actions
Figure 7: Business Value with the Vitria IoT Analytics Platform
16. 14www.vitria.com/iot ā¢ Vitria Speed Time-to-Value with the VIA IoT Analytics Platform
To maximize business value requires the use of predictive and prescriptive analytics to drive intelligent
actions. Such value cannot be achieved without a unified analytics platform and leading edge
visualization services. VIAās self-service development tools deliver faster time to innovation by enabling
power analysts and citizen developers to create and test IoT solutions in days with minimal coding.
The VIA platform combines rapid application development, broad analytical context for real-time IoT
scenarios, and provides the tools to act at the right time.
VII.SUMMARY/CONCLUSION
Operations leaders need to lead IoT projects that leverage data and analytics as key strategic assets.
New processes are needed to maximize the value delivered with IoT analytics by both dramatically
reducing the time to develop solutions and accelerate the time to action.
Development teams, analysts, and operations staff need automation and new tools to empower them
to innovate more rapidly. Capitalizing on IoT value requires the ability to monitor key indicators by
aggregating and analyzing disparate data fast. The ultimate value in IoT is the ability to accelerate and
implement the right action at the right time.
The VIA platform by Vitria is the first of its kind to bring streaming analytics together with the
capabilities and tools to support business process management. VIA addresses both the need for rapid
IoT implementation time-frames and enables smarter actions. VIA accelerates analytic processes across
multiple, diverse data sources, empowers operations with powerful self-service analytic visualization
tools, and provides the ability to implement the next best action to drive business performance. It offers
an open platform that unifies its powerful Core Analytics Engine with a wide range of in-place software
and databases to leverage existing investment. It provides a model-driven, self-service development
environment that accelerates time-to-value for even the most complex IoT applications.
VIA offers much more than just new technical approaches or faster āspeeds and feeds.ā It is a unique
IoT Analytics platform for business operation managers to accelerate their IoT projects and drive better
business outcomes faster.