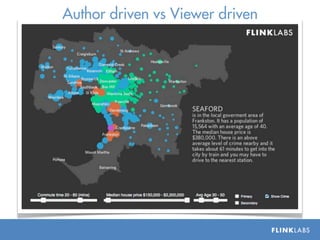
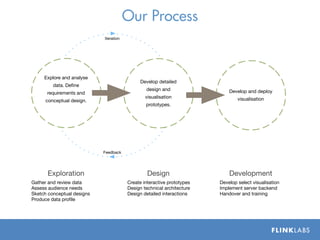
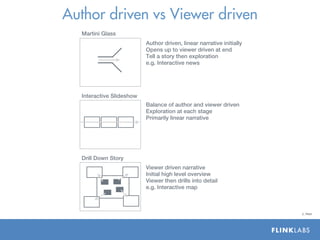
Melbourne Trains
Author driven vs Viewer driven
Melbourne Taxis
Exploration and Engagement
The Data’s Journey
Tell a story that you can interact with
Our Process
                            Iteration


     Explore and analyse
                                             Develop detailed
         data. Define
                                                design and                  Develop and deploy
      requirements and
                                                visualisation                   visualisation
      conceptual design.
                                                prototypes.


                            Feedback


      Exploration                                Design                     Development
Gather and review data                  Create interactive prototypes   Develop select visualisation
Assess audience needs                   Design technical architecture   Implement server backend
Sketch conceptual designs               Design detailed interactions    Handover and training
Produce data profile
Author driven vs Viewer driven
  Martini Glass
                          Author driven, linear narrative initially
                          Opens up to viewer driven at end
                          Tell a story then exploration
                          e.g. Interactive news


  Interactive Slideshow
                          Balance of author and viewer driven
                          Exploration at each stage
                          Primarily linear narrative


  Drill Down Story
                          Viewer driven narrative
                          Initial high level overview
                          Viewer then drills into detail
                          e.g. Interactive map


                                                                      J. Heer
Not just the averages
Draw the viewer into the data
Form
                    Visual Encoding
Orientation   Line Length   Line Width     Size


Shape         Curvature     Enclosure      Motion


Colour                      Position
Intensity     Hue           2-D Position   Grouping


                                                      Ware
Gestalt Principles of Visual Perception
    Similarity   Similarity   Connection


    Continuity   Closure      Enclosure


    Proximity    Proximity    Proximity
Expanding Toolsets
“Real artists ship”

Don’t over reach
Focus on the story of the data
Use visual encoding wisely
Don’t make your viewer work too hard at the start
Introduction Workshop - Visualizing Marathon Data Visualisation

Introduction Workshop - Visualizing Marathon Data Visualisation

  • 2.
  • 3.
    Author driven vsViewer driven
  • 4.
  • 5.
  • 6.
  • 7.
    Tell a storythat you can interact with
  • 8.
    Our Process Iteration Explore and analyse Develop detailed data. Define design and Develop and deploy requirements and visualisation visualisation conceptual design. prototypes. Feedback Exploration Design Development Gather and review data Create interactive prototypes Develop select visualisation Assess audience needs Design technical architecture Implement server backend Sketch conceptual designs Design detailed interactions Handover and training Produce data profile
  • 9.
    Author driven vsViewer driven Martini Glass Author driven, linear narrative initially Opens up to viewer driven at end Tell a story then exploration e.g. Interactive news Interactive Slideshow Balance of author and viewer driven Exploration at each stage Primarily linear narrative Drill Down Story Viewer driven narrative Initial high level overview Viewer then drills into detail e.g. Interactive map J. Heer
  • 10.
    Not just theaverages
  • 11.
    Draw the viewerinto the data
  • 12.
    Form Visual Encoding Orientation Line Length Line Width Size Shape Curvature Enclosure Motion Colour Position Intensity Hue 2-D Position Grouping Ware
  • 13.
    Gestalt Principles ofVisual Perception Similarity Similarity Connection Continuity Closure Enclosure Proximity Proximity Proximity
  • 14.
  • 15.
    “Real artists ship” Don’tover reach Focus on the story of the data Use visual encoding wisely Don’t make your viewer work too hard at the start