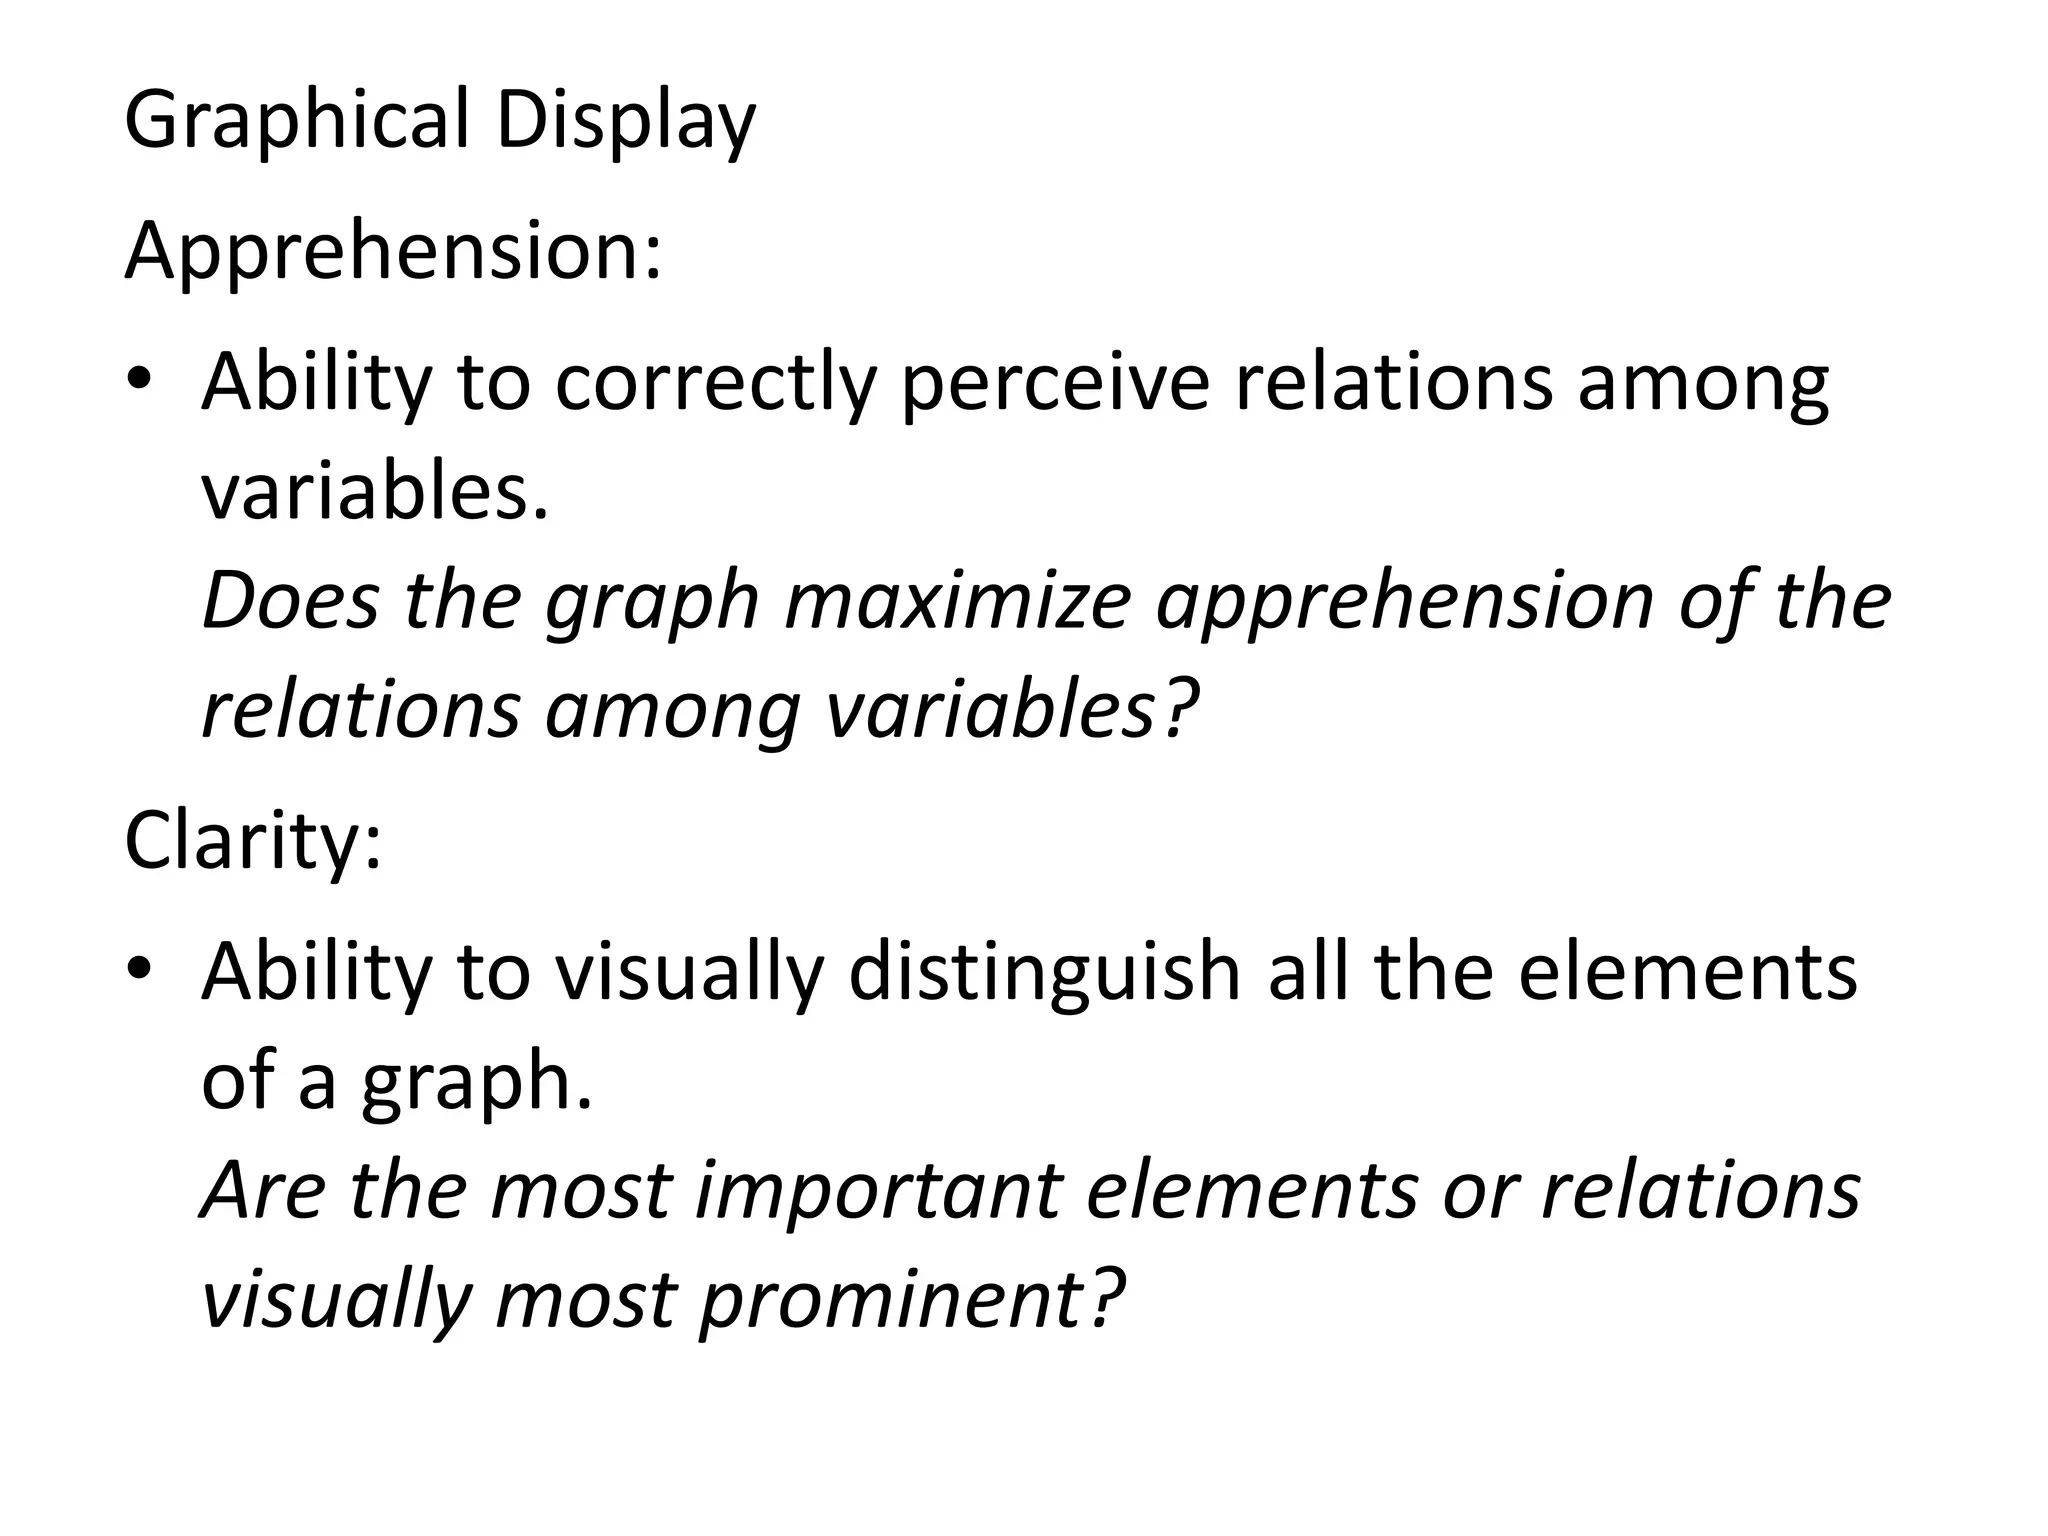
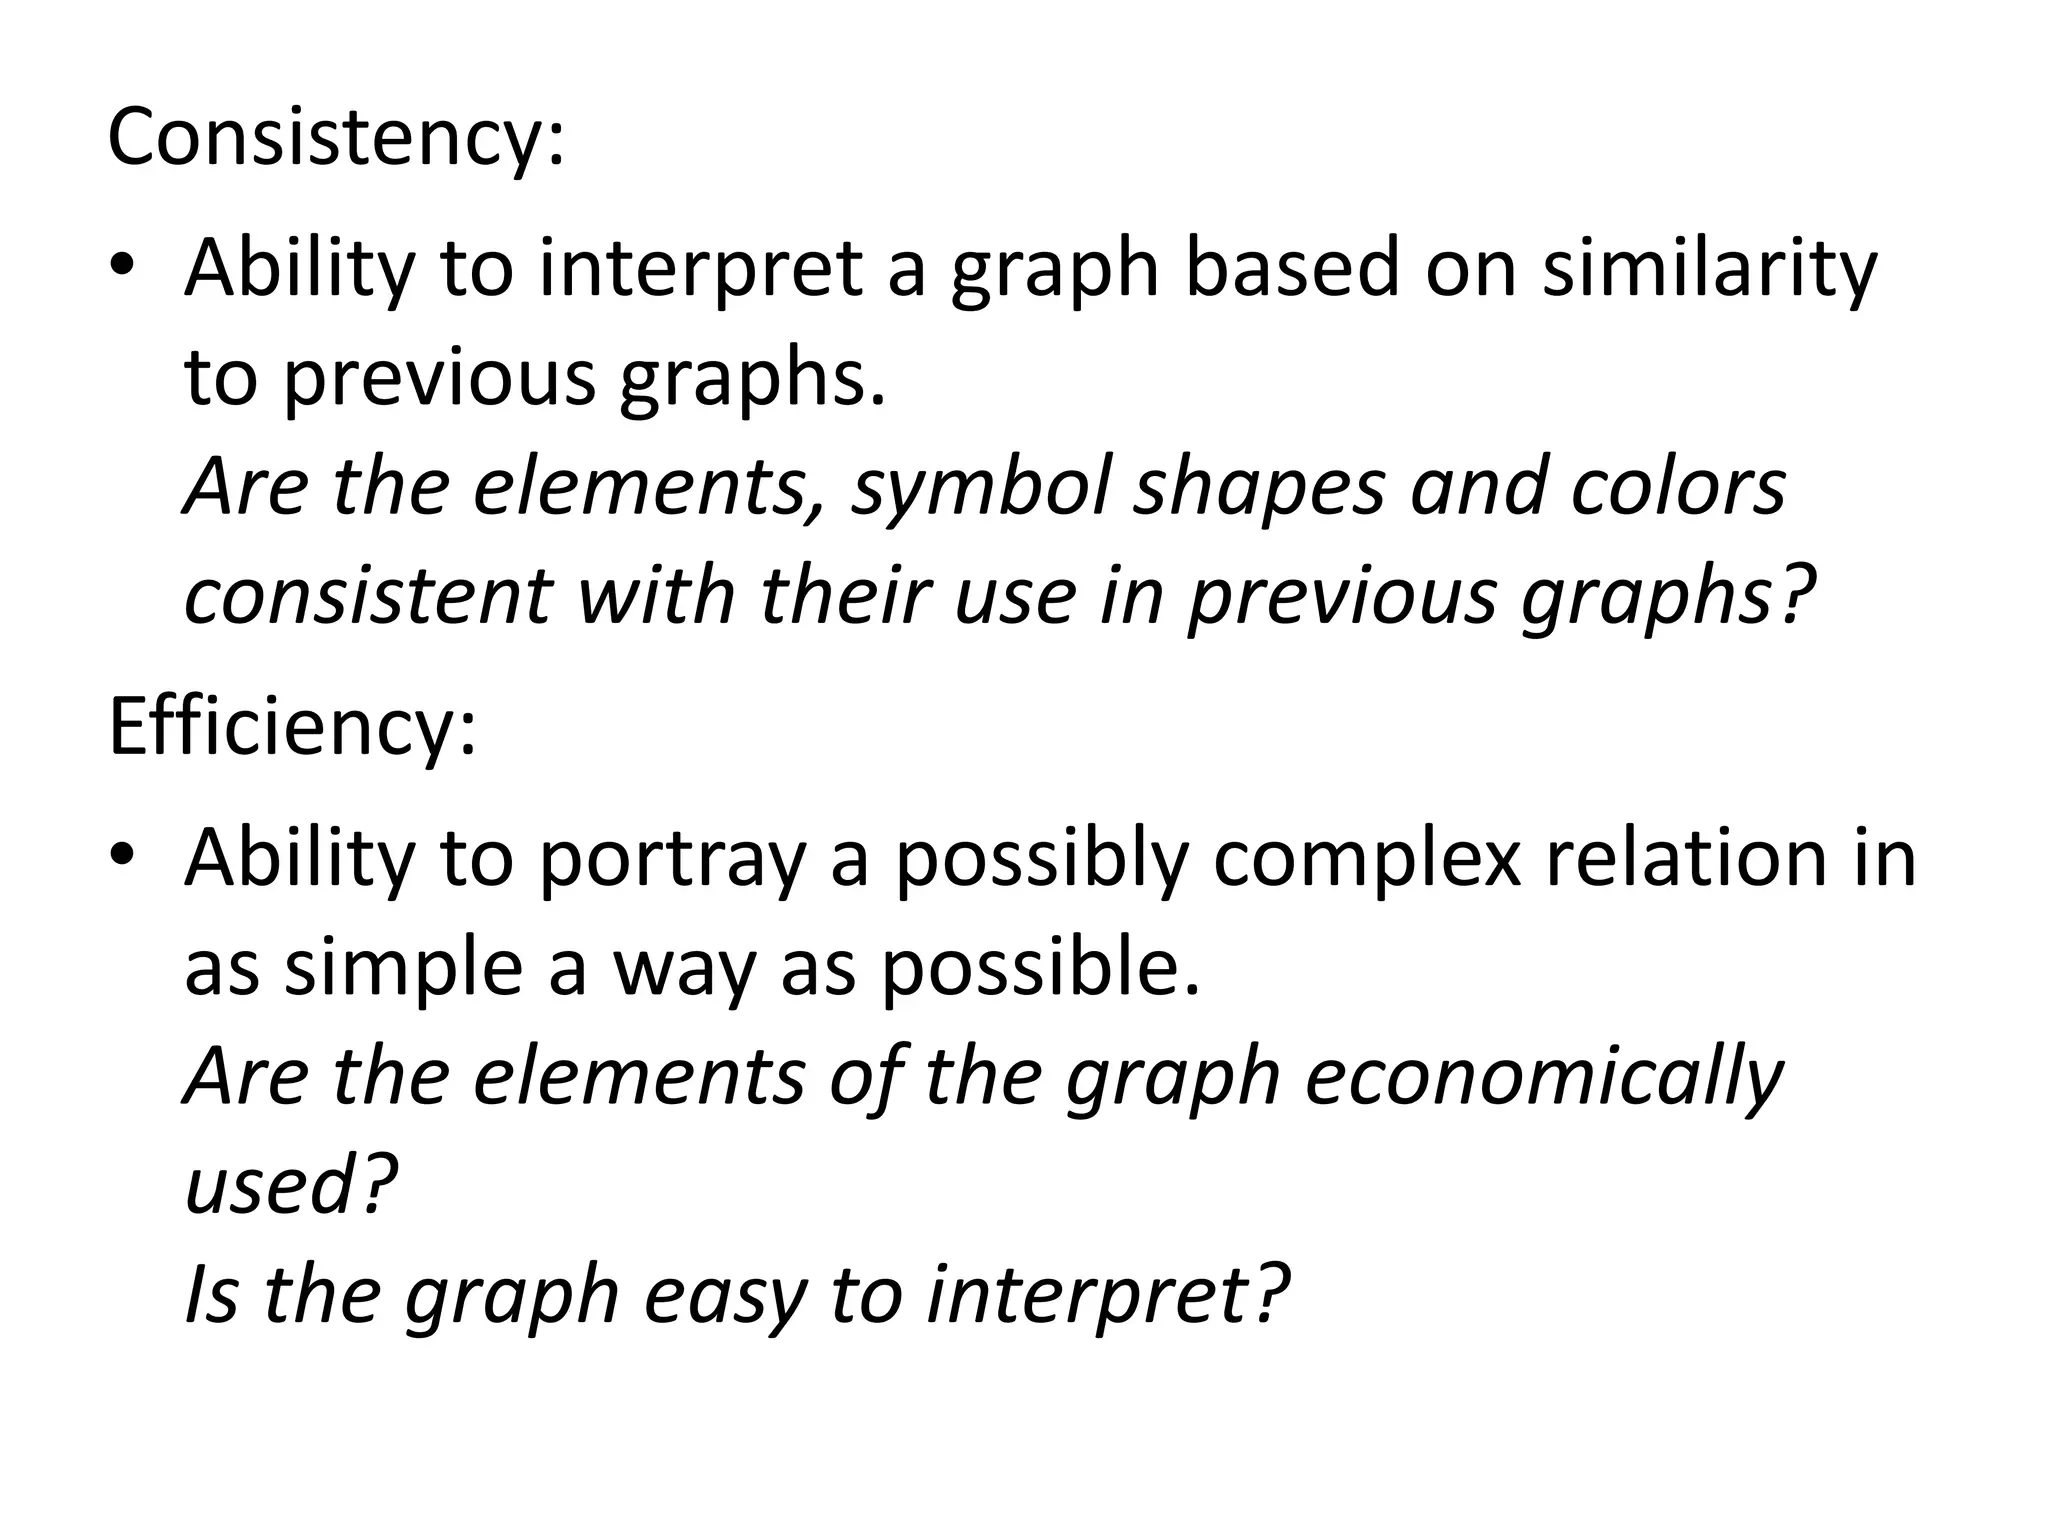
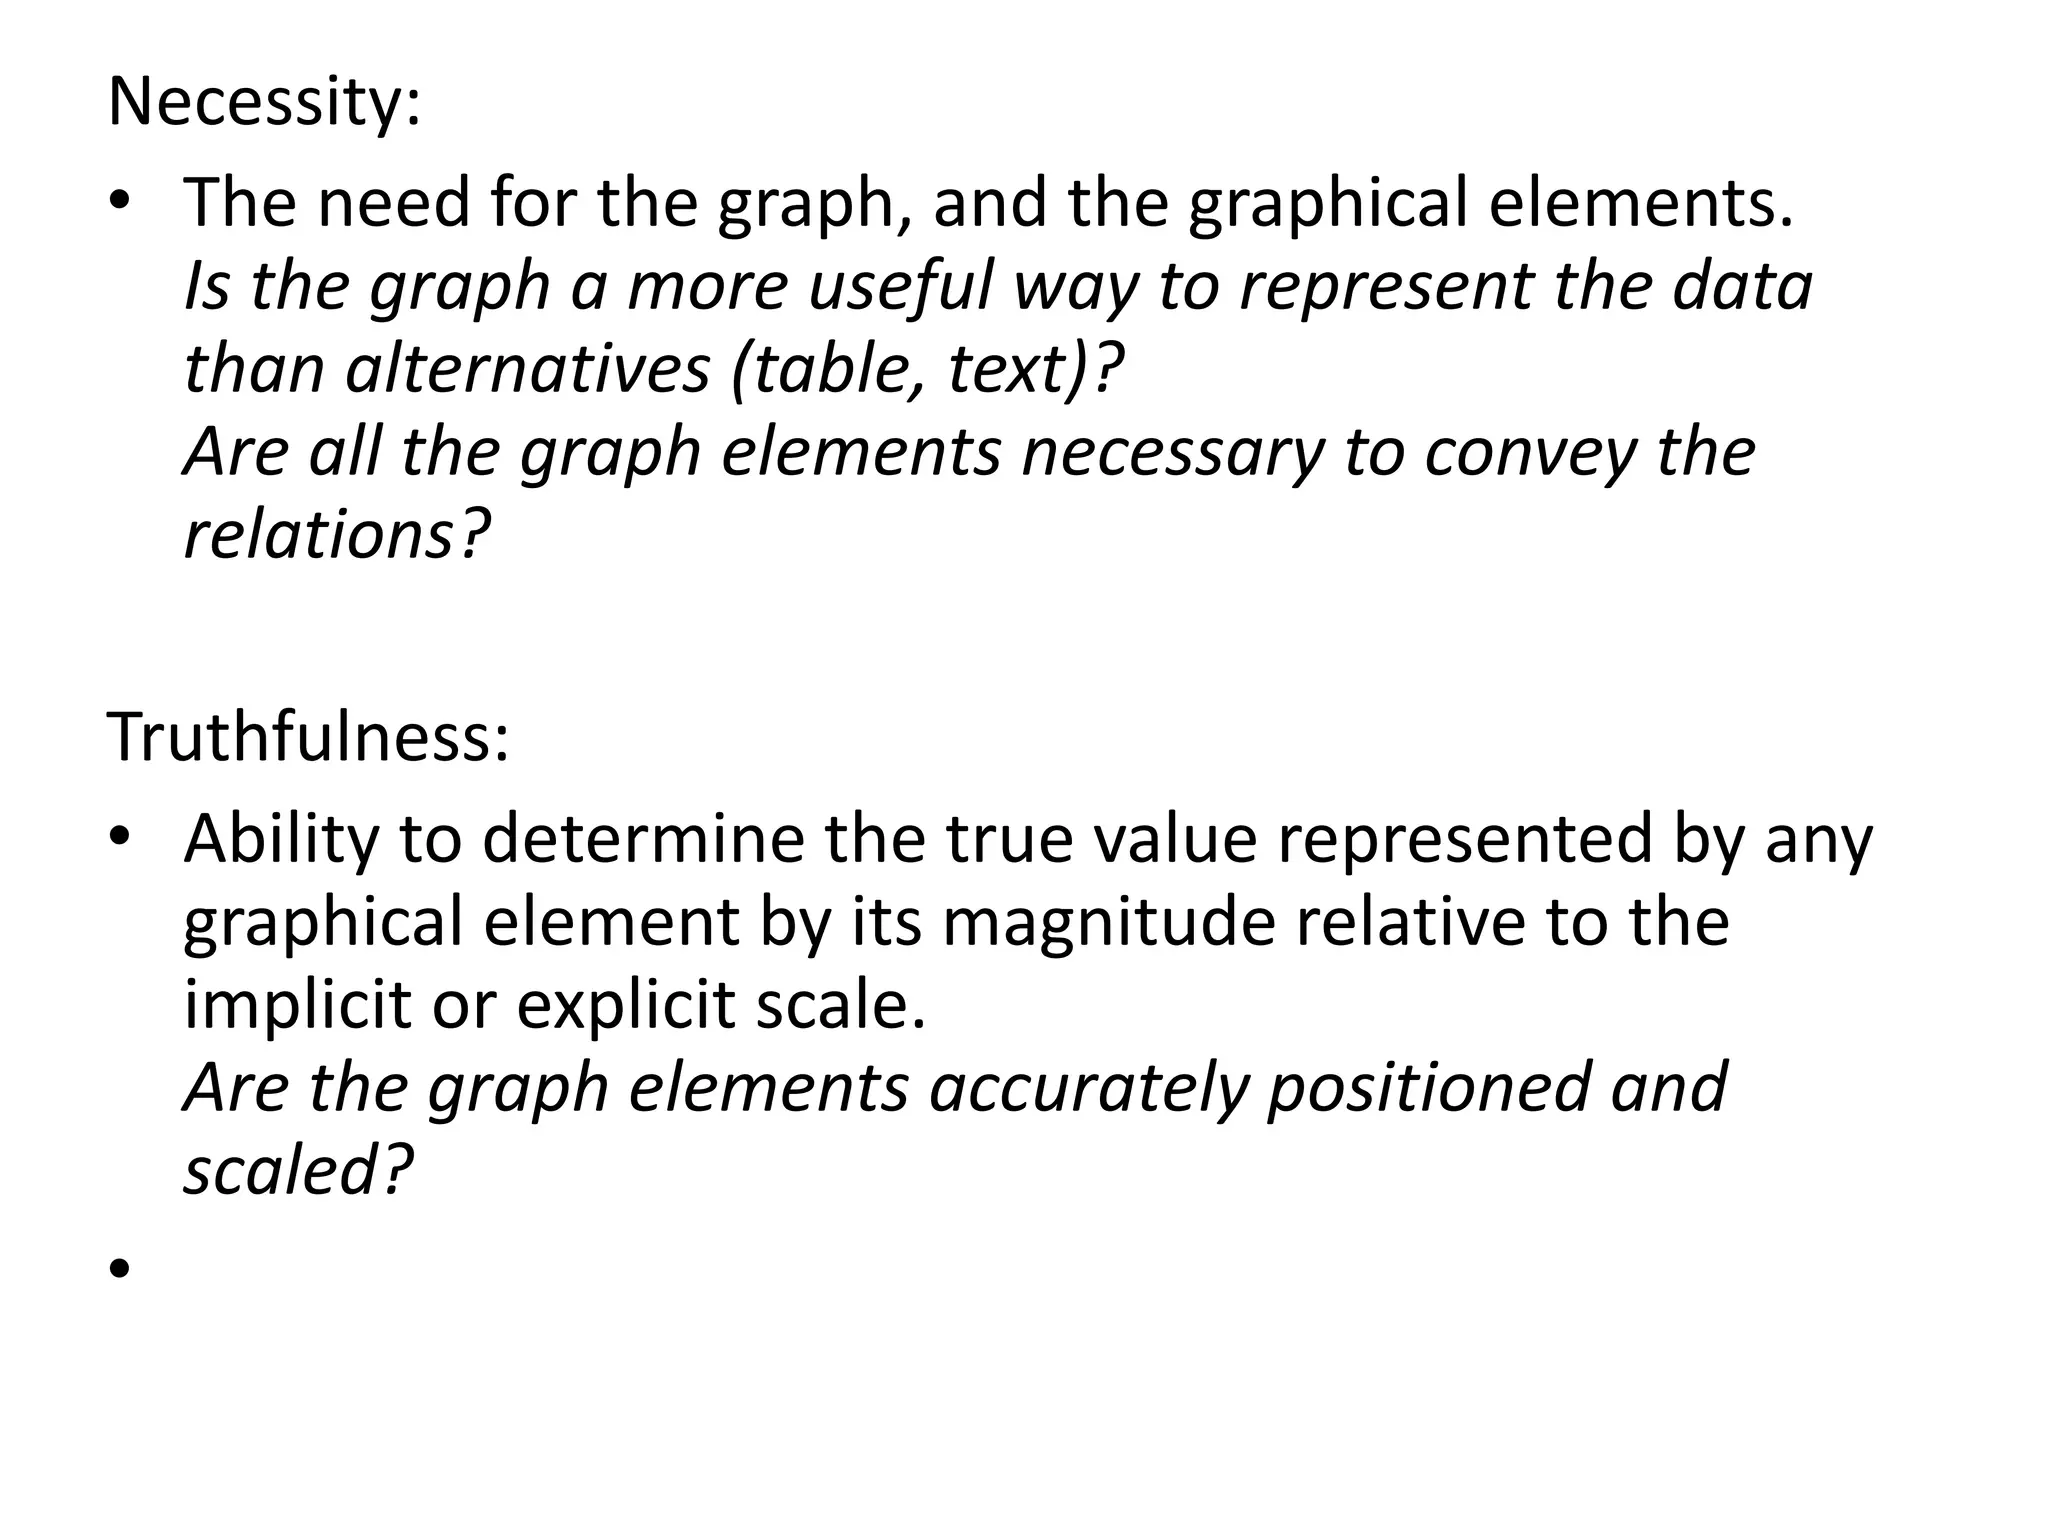
Topic: Principles of Graphics and
Visual Display
Reporter: Aileen N. Carrillo
MINDANAO UNIVERSITY OF SCIENCEANDTECHNOLOGY
College of Policy Studies, Education, and Management
EDU 51a: Educational Technology with Field Study
Class of Professor Ivanhoe Onate
Visualizations should:
> show the data
> induce the viewer to think about the substance
rather than about methodology, graphic
design, the technology, or something else
> avoid distortion
> sets coherent
> encourage the eye to compare different pieces
of data
> reveal the data at several levels of detail, from
a broad overview to the fine structure
> serve a reasonably clear purpose: description,
exploration, tabulation, or decoration
> be closely integrated with the statistical and
verbal descriptions of a data set.
Visualizations should strive towards the
following goals:
• content focus
• comparison rather than mere description
• integrity
• high resolution
• utilization of classic designs and concepts
proven by time.
Graphical Display
Apprehension:
• Ability to correctly perceive relations among
variables.
Does the graph maximize apprehension of the
relations among variables?
Clarity:
• Ability to visually distinguish all the elements
of a graph.
Are the most important elements or relations
visually most prominent?
Consistency:
• Ability to interpret a graph based on similarity
to previous graphs.
Are the elements, symbol shapes and colors
consistent with their use in previous graphs?
Efficiency:
• Ability to portray a possibly complex relation in
as simple a way as possible.
Are the elements of the graph economically
used?
Is the graph easy to interpret?
Necessity:
• The need for the graph, and the graphical elements.
Is the graph a more useful way to represent the data
than alternatives (table, text)?
Are all the graph elements necessary to convey the
relations?
Truthfulness:
• Ability to determine the true value represented by any
graphical element by its magnitude relative to the
implicit or explicit scale.
Are the graph elements accurately positioned and
scaled?
•

visual display

  • 1.
    Topic: Principles ofGraphics and Visual Display Reporter: Aileen N. Carrillo MINDANAO UNIVERSITY OF SCIENCEANDTECHNOLOGY College of Policy Studies, Education, and Management EDU 51a: Educational Technology with Field Study Class of Professor Ivanhoe Onate
  • 2.
    Visualizations should: > showthe data > induce the viewer to think about the substance rather than about methodology, graphic design, the technology, or something else > avoid distortion > sets coherent
  • 3.
    > encourage theeye to compare different pieces of data > reveal the data at several levels of detail, from a broad overview to the fine structure > serve a reasonably clear purpose: description, exploration, tabulation, or decoration > be closely integrated with the statistical and verbal descriptions of a data set.
  • 4.
    Visualizations should strivetowards the following goals: • content focus • comparison rather than mere description • integrity • high resolution • utilization of classic designs and concepts proven by time.
  • 5.
    Graphical Display Apprehension: • Abilityto correctly perceive relations among variables. Does the graph maximize apprehension of the relations among variables? Clarity: • Ability to visually distinguish all the elements of a graph. Are the most important elements or relations visually most prominent?
  • 6.
    Consistency: • Ability tointerpret a graph based on similarity to previous graphs. Are the elements, symbol shapes and colors consistent with their use in previous graphs? Efficiency: • Ability to portray a possibly complex relation in as simple a way as possible. Are the elements of the graph economically used? Is the graph easy to interpret?
  • 7.
    Necessity: • The needfor the graph, and the graphical elements. Is the graph a more useful way to represent the data than alternatives (table, text)? Are all the graph elements necessary to convey the relations? Truthfulness: • Ability to determine the true value represented by any graphical element by its magnitude relative to the implicit or explicit scale. Are the graph elements accurately positioned and scaled? •