Business powerpoint presentations process diagram six decisions cycle flow ch...SlideTeam.net
The document describes how to edit and customize a business process diagram template in PowerPoint. It includes 6 steps represented by diverging arrows. At each step, text or images can be added and modified. All images are fully editable in terms of color, size, orientation, and other properties using the formatting and drawing tools in PowerPoint. This allows the template to be customized while maintaining a consistent visual structure.
http://inarocket.com
Learn BEM fundamentals as fast as possible. What is BEM (Block, element, modifier), BEM syntax, how it works with a real example, etc.
How to Build a Dynamic Social Media PlanPost Planner
Stop guessing and wasting your time on networks and strategies that don’t work!
Join Rebekah Radice and Katie Lance to learn how to optimize your social networks, the best kept secrets for hot content, top time management tools, and much more!
Watch the replay here: bit.ly/socialmedia-plan
Lightning Talk #9: How UX and Data Storytelling Can Shape Policy by Mika Aldabaux singapore
How can we take UX and Data Storytelling out of the tech context and use them to change the way government behaves?
Showcasing the truth is the highest goal of data storytelling. Because the design of a chart can affect the interpretation of data in a major way, one must wield visual tools with care and deliberation. Using quantitative facts to evoke an emotional response is best achieved with the combination of UX and data storytelling.
The document discusses how personalization and dynamic content are becoming increasingly important on websites. It notes that 52% of marketers see content personalization as critical and 75% of consumers like it when brands personalize their content. However, personalization can create issues for search engine optimization as dynamic URLs and content are more difficult for search engines to index than static pages. The document provides tips for SEOs to help address these personalization and SEO challenges, such as using static URLs when possible and submitting accurate sitemaps.
This document summarizes a study of CEO succession events among the largest 100 U.S. corporations between 2005-2015. The study analyzed executives who were passed over for the CEO role ("succession losers") and their subsequent careers. It found that 74% of passed over executives left their companies, with 30% eventually becoming CEOs elsewhere. However, companies led by succession losers saw average stock price declines of 13% over 3 years, compared to gains for companies whose CEO selections remained unchanged. The findings suggest that boards generally identify the most qualified CEO candidates, though differences between internal and external hires complicate comparisons.
Powerpoint presentations process management solution cycle flow network templ...SlideTeam.net
The document describes a 7 step converging arrows business process management solution. It includes 7 steps represented by arrows that converge on a central text box. All images are 100% editable in PowerPoint and allow the user to change color, size, orientation or any icon to their liking. The document also provides instructions on how to ungroup objects and edit their color using theme colors or by selecting fill and solid options.
Group of nine coverging arrows circular layout process power point slidesSlideTeam.net
The document describes how to edit a group of nine converging arrows diagram in PowerPoint. It includes instructions on ungrouping the object, editing the color, and editing the color by theme colors. The diagram can be customized by changing the color, size, and orientation of any icon. All images are fully editable in PowerPoint.
Four leading reason for cause cycle process diagram power point slidesSlideTeam.net
The document discusses editing images in PowerPoint. It provides instructions on how to ungroup objects, edit colors, and change colors using theme colors. The key steps are to right click objects to ungroup or access formatting options, select fill and color options to change the appearance, and choose from built-in theme colors.
To good world business powerpoint templates ideas processs andSlideTeam.net
The document contains instructions for editing business diagram images in PowerPoint. It explains how to ungroup objects, edit colors, and change colors using built-in theme colors. The purpose is to allow users to customize diagram images for business presentations.
Three converging arrows managing process layout cycle network power point slidesSlideTeam.net
The document describes how to edit icons in a PowerPoint presentation. It provides instructions on ungrouping objects, changing colors, and using theme colors. The steps include right clicking objects, choosing format options, and selecting fill and color options. The overall purpose is to demonstrate how to customize icons and make images fully editable.
Six coverging arrows for process to carried out charts and power point slidesSlideTeam.net
The document describes how to edit a diagram template with six converging arrows. Key points:
- The template can be used to bring presentations to life and capture audiences' attention.
- All images are 100% editable in PowerPoint, allowing the user to change color, size, and orientation of any icon.
- To ungroup objects, right click, select "Ungroup", and drag the selection arrow over parts to edit individually.
- To change an object's color, right click it, select "Format Shape", and choose a "Fill" color or gradient from the options provided. Colors can also be changed using the built-in theme colors.
Powerpoint presentations process management solution cycle flow network templ...SlideTeam.net
The document describes a 7 step converging arrows business process management solution. It includes 7 steps represented by arrows that converge on a central text box. All images are 100% editable in PowerPoint and allow the user to change color, size, orientation or any icon to their liking. The document also provides instructions on how to ungroup objects and edit their color using theme colors or by selecting fill and solid options.
Diverging arrows pointing specific directions processs and power point templatesSlideTeam.net
The document shows a diagram with diverging arrows pointing in different directions. The arrows can be edited in PowerPoint by ungrouping the object, changing the color using the format shape option or theme colors, and dragging the arrow to change its orientation. The diagram brings presentations to life and captures audiences' attention. It is fully editable and customizable in PowerPoint.
Templates process diagram with diverging arrows circular layout power point s...SlideTeam.net
The document is an illustration of a business process diagram with diverging arrows. It shows a process splitting into multiple parallel processes represented by arrows branching in different directions. All images in the diagram are fully editable in PowerPoint and can be modified by changing properties like color, size, and orientation. The document provides instructions on how to perform actions like ungrouping objects and editing colors using options in the PowerPoint interface.
Steps layout with converging arrows pointing to center cycle process power po...SlideTeam.net
The document describes how to edit icons in a PowerPoint presentation. It provides instructions for ungrouping objects, editing colors, and changing colors using built-in theme colors. The steps allow presenters to customize icons by changing their size, orientation, and colors to suit their liking.
Seven factors arrow pointing business process charts and power point slidesSlideTeam.net
The document appears to be a template for a diagram or presentation with 7 factors pointing to a central business process. The template includes placeholder text and images that can be customized. It is meant to bring presentations to life and capture audience attention. All elements are editable in PowerPoint.
Diverging arrows pointing different directions circular motion network power ...SlideTeam.net
The document shows a diagram template with diverging arrows pointing in different directions. The template can be customized with text in 8 boxes to bring presentations to life and capture audience attention. The images are fully editable in PowerPoint.
Diverging arrow process project activity diagram cycle power point slidesSlideTeam.net
The document describes a diverging arrow process project activity diagram. It includes steps numbered 1 through 5 with arrows connecting each step. Text placeholders throughout suggest editing the text to describe your own process. The document encourages downloading the diagram and editing it in PowerPoint to bring your own presentation to life and capture your audience's attention. It specifies that all images are 100% editable in terms of color, size, orientation, and text.
Diverging arrow pointing strategic planning process arrows network software p...SlideTeam.net
The document describes a diverging arrow diagram for strategic planning. It includes 11 points labeled 1 through 11 with arrows pointing in different directions. Below the diagram are bullet points describing how the diagram can be used to bring presentations to life, capture audiences' attention, and is fully editable in PowerPoint by changing colors, sizes, orientations of icons, ungrouping objects, and editing colors using theme colors. The document provides instructions for customizing a diverging arrow diagram template for strategic planning presentations.
Diverging arrows graphical view of different aspects cycle flow chart power p...SlideTeam.net
The document describes how to edit and customize diverging arrow diagrams created in PowerPoint. It includes 6 arrows branching from a central point and labeled text boxes that can be edited. The summary provides instructions on how to:
1. Ungroup individual elements to edit them separately.
2. Change colors by right clicking, selecting format shape, and choosing a solid or gradient fill color.
3. Change colors using built-in theme colors under the Design tab.
Diverging arrow pointing strategic planning process arrows network software p...SlideTeam.net
The document describes a diverging arrow diagram for strategic planning. It includes placeholders for text and logos. The diagram has 11 points connected by arrows and can be edited in PowerPoint. It is meant to help presentations and capture audience attention.
Business powerpoint presentations process diagram six decisions cycle flow ch...SlideTeam.net
The document shows a diverging arrows business process diagram with 6 decision points. The diagram can be edited in PowerPoint by changing the text, ungrouping objects to edit individual parts, and changing colors. All images are fully editable and the diagram is meant to capture audience attention and bring presentations to life.
Business powerpoint templates download process diagram cycleSlideTeam.net
The document is a 9 step converging arrows business process diagram template that allows users to customize each step with text and download the finished diagram. It provides an editable template to create a process flow chart for presentations.
Arrow diagram shows required order of tasks arrows software power point templ...SlideTeam.net
The document describes how to edit an arrow diagram in PowerPoint. It outlines the following steps:
1. Ungroup the object by right clicking, selecting group, and then ungroup to edit individual elements.
2. Edit the color of shapes by right clicking, selecting format shape, and choosing a solid or gradient fill color from the options.
3. Alternatively, colors can be changed by selecting a shape and choosing from the built-in theme colors in the design tab.
8 steps converging arrows workflow diagram chart software power point templatesSlideTeam.net
The document describes an 8 step converging arrows workflow diagram template that can be customized with text and logos. Key points:
- It is an 8 step workflow diagram template with converging arrows and text/logo placeholders at each step.
- All images are 100% editable in PowerPoint so the colors, sizes, and orientations of the icons and arrows can be changed to suit the presentation needs.
- The template allows users to easily create customized workflow diagrams to bring presentations to life and capture audience attention.
An illustration of pointing arrows circular layout diagram power point slidesSlideTeam.net
The document shows how to edit pointing arrow diagrams in PowerPoint. It demonstrates how to ungroup objects, change colors, and select from built-in theme colors. Steps include right clicking objects, using format shape options, and choosing fill and color options. The goal is to allow customizing arrow diagrams by changing size, color, and orientation of icons.
10 converging steps of a single process arrows software power point slidesSlideTeam.net
The document describes how to edit icons in PowerPoint presentations. It explains how to ungroup objects, change the color of objects by using the format shape dialog box or theme colors, and change the size and orientation of icons. The overall process described allows presenters to customize icons for their PowerPoint presentations.
How to Get CNIC Information System with Paksim Ga.pptxdanishmna97
Pakdata Cf is a groundbreaking system designed to streamline and facilitate access to CNIC information. This innovative platform leverages advanced technology to provide users with efficient and secure access to their CNIC details.
Salesforce Integration for Bonterra Impact Management (fka Social Solutions A...Jeffrey Haguewood
Sidekick Solutions uses Bonterra Impact Management (fka Social Solutions Apricot) and automation solutions to integrate data for business workflows.
We believe integration and automation are essential to user experience and the promise of efficient work through technology. Automation is the critical ingredient to realizing that full vision. We develop integration products and services for Bonterra Case Management software to support the deployment of automations for a variety of use cases.
This video focuses on integration of Salesforce with Bonterra Impact Management.
Interested in deploying an integration with Salesforce for Bonterra Impact Management? Contact us at sales@sidekicksolutionsllc.com to discuss next steps.
5th LF Energy Power Grid Model Meet-up SlidesDanBrown980551
5th Power Grid Model Meet-up
It is with great pleasure that we extend to you an invitation to the 5th Power Grid Model Meet-up, scheduled for 6th June 2024. This event will adopt a hybrid format, allowing participants to join us either through an online Mircosoft Teams session or in person at TU/e located at Den Dolech 2, Eindhoven, Netherlands. The meet-up will be hosted by Eindhoven University of Technology (TU/e), a research university specializing in engineering science & technology.
Power Grid Model
The global energy transition is placing new and unprecedented demands on Distribution System Operators (DSOs). Alongside upgrades to grid capacity, processes such as digitization, capacity optimization, and congestion management are becoming vital for delivering reliable services.
Power Grid Model is an open source project from Linux Foundation Energy and provides a calculation engine that is increasingly essential for DSOs. It offers a standards-based foundation enabling real-time power systems analysis, simulations of electrical power grids, and sophisticated what-if analysis. In addition, it enables in-depth studies and analysis of the electrical power grid’s behavior and performance. This comprehensive model incorporates essential factors such as power generation capacity, electrical losses, voltage levels, power flows, and system stability.
Power Grid Model is currently being applied in a wide variety of use cases, including grid planning, expansion, reliability, and congestion studies. It can also help in analyzing the impact of renewable energy integration, assessing the effects of disturbances or faults, and developing strategies for grid control and optimization.
What to expect
For the upcoming meetup we are organizing, we have an exciting lineup of activities planned:
-Insightful presentations covering two practical applications of the Power Grid Model.
-An update on the latest advancements in Power Grid -Model technology during the first and second quarters of 2024.
-An interactive brainstorming session to discuss and propose new feature requests.
-An opportunity to connect with fellow Power Grid Model enthusiasts and users.
Digital Marketing Trends in 2024 | Guide for Staying AheadWask
https://www.wask.co/ebooks/digital-marketing-trends-in-2024
Feeling lost in the digital marketing whirlwind of 2024? Technology is changing, consumer habits are evolving, and staying ahead of the curve feels like a never-ending pursuit. This e-book is your compass. Dive into actionable insights to handle the complexities of modern marketing. From hyper-personalization to the power of user-generated content, learn how to build long-term relationships with your audience and unlock the secrets to success in the ever-shifting digital landscape.
For the full video of this presentation, please visit: https://www.edge-ai-vision.com/2024/06/building-and-scaling-ai-applications-with-the-nx-ai-manager-a-presentation-from-network-optix/
Robin van Emden, Senior Director of Data Science at Network Optix, presents the “Building and Scaling AI Applications with the Nx AI Manager,” tutorial at the May 2024 Embedded Vision Summit.
In this presentation, van Emden covers the basics of scaling edge AI solutions using the Nx tool kit. He emphasizes the process of developing AI models and deploying them globally. He also showcases the conversion of AI models and the creation of effective edge AI pipelines, with a focus on pre-processing, model conversion, selecting the appropriate inference engine for the target hardware and post-processing.
van Emden shows how Nx can simplify the developer’s life and facilitate a rapid transition from concept to production-ready applications.He provides valuable insights into developing scalable and efficient edge AI solutions, with a strong focus on practical implementation.
UiPath Test Automation using UiPath Test Suite series, part 6DianaGray10
Welcome to UiPath Test Automation using UiPath Test Suite series part 6. In this session, we will cover Test Automation with generative AI and Open AI.
UiPath Test Automation with generative AI and Open AI webinar offers an in-depth exploration of leveraging cutting-edge technologies for test automation within the UiPath platform. Attendees will delve into the integration of generative AI, a test automation solution, with Open AI advanced natural language processing capabilities.
Throughout the session, participants will discover how this synergy empowers testers to automate repetitive tasks, enhance testing accuracy, and expedite the software testing life cycle. Topics covered include the seamless integration process, practical use cases, and the benefits of harnessing AI-driven automation for UiPath testing initiatives. By attending this webinar, testers, and automation professionals can gain valuable insights into harnessing the power of AI to optimize their test automation workflows within the UiPath ecosystem, ultimately driving efficiency and quality in software development processes.
What will you get from this session?
1. Insights into integrating generative AI.
2. Understanding how this integration enhances test automation within the UiPath platform
3. Practical demonstrations
4. Exploration of real-world use cases illustrating the benefits of AI-driven test automation for UiPath
Topics covered:
What is generative AI
Test Automation with generative AI and Open AI.
UiPath integration with generative AI
Speaker:
Deepak Rai, Automation Practice Lead, Boundaryless Group and UiPath MVP
Threats to mobile devices are more prevalent and increasing in scope and complexity. Users of mobile devices desire to take full advantage of the features
available on those devices, but many of the features provide convenience and capability but sacrifice security. This best practices guide outlines steps the users can take to better protect personal devices and information.
Best 20 SEO Techniques To Improve Website Visibility In SERPPixlogix Infotech
Boost your website's visibility with proven SEO techniques! Our latest blog dives into essential strategies to enhance your online presence, increase traffic, and rank higher on search engines. From keyword optimization to quality content creation, learn how to make your site stand out in the crowded digital landscape. Discover actionable tips and expert insights to elevate your SEO game.
Project Management Semester Long Project - Acuityjpupo2018
Acuity is an innovative learning app designed to transform the way you engage with knowledge. Powered by AI technology, Acuity takes complex topics and distills them into concise, interactive summaries that are easy to read & understand. Whether you're exploring the depths of quantum mechanics or seeking insight into historical events, Acuity provides the key information you need without the burden of lengthy texts.
OpenID AuthZEN Interop Read Out - AuthorizationDavid Brossard
During Identiverse 2024 and EIC 2024, members of the OpenID AuthZEN WG got together and demoed their authorization endpoints conforming to the AuthZEN API
Programming Foundation Models with DSPy - Meetup SlidesZilliz
Prompting language models is hard, while programming language models is easy. In this talk, I will discuss the state-of-the-art framework DSPy for programming foundation models with its powerful optimizers and runtime constraint system.
GraphRAG for Life Science to increase LLM accuracyTomaz Bratanic
GraphRAG for life science domain, where you retriever information from biomedical knowledge graphs using LLMs to increase the accuracy and performance of generated answers
Your One-Stop Shop for Python Success: Top 10 US Python Development Providersakankshawande
Simplify your search for a reliable Python development partner! This list presents the top 10 trusted US providers offering comprehensive Python development services, ensuring your project's success from conception to completion.
Fueling AI with Great Data with Airbyte WebinarZilliz
This talk will focus on how to collect data from a variety of sources, leveraging this data for RAG and other GenAI use cases, and finally charting your course to productionalization.
Taking AI to the Next Level in Manufacturing.pdfssuserfac0301
Read Taking AI to the Next Level in Manufacturing to gain insights on AI adoption in the manufacturing industry, such as:
1. How quickly AI is being implemented in manufacturing.
2. Which barriers stand in the way of AI adoption.
3. How data quality and governance form the backbone of AI.
4. Organizational processes and structures that may inhibit effective AI adoption.
6. Ideas and approaches to help build your organization's AI strategy.
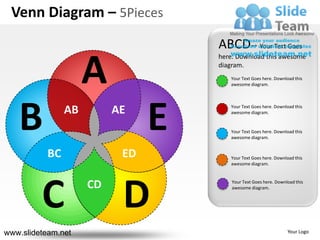
1. Venn Diagram – 5Pieces
ABCD-- Your Text Goes
A
here. Download this awesome
diagram.
Your Text Goes here. Download this
awesome diagram.
B AB AE
E
Your Text Goes here. Download this
awesome diagram.
Your Text Goes here. Download this
awesome diagram.
BC ED Your Text Goes here. Download this
awesome diagram.
C CD
D
Your Text Goes here. Download this
awesome diagram.
www.slideteam.net Your Logo
2. Venn Diagram – 5Pieces
ABCDE-- Your Text
A
Goes here. Download this
awesome diagram.
PUT YOUR TEXT HERE
• Your Text Goes here
B E
• Download this
AB AE awesome diagram
• Bring your presentation
to life
• Capture your
audience’s attention
BC ED • All images are 100%
editable in powerpoint
• Pitch your ideas
C D
convincingly
CD
www.slideteam.net Your Logo
3. Venn Diagram – 5Pieces
ABCDE-- Your Text
A
Goes here. Download this
awesome diagram.
PUT YOUR TEXT HERE
• Your Text Goes here
B E
• Download this
AB AE awesome diagram
• Bring your presentation
to life
• Capture your
audience’s attention
BC ED • All images are 100%
editable in powerpoint
• Pitch your ideas
C D
convincingly
CD
www.slideteam.net Your Logo
4. Venn Diagram – 5Pieces
ABCDE-- Your Text
A
Goes here. Download this
awesome diagram.
PUT YOUR TEXT HERE
• Your Text Goes here
B E
• Download this
AB AE awesome diagram
• Bring your presentation
to life
• Capture your
audience’s attention
BC ED • All images are 100%
editable in powerpoint
• Pitch your ideas
C D
convincingly
CD
www.slideteam.net Your Logo
5. Venn Diagram – 5Pieces
ABCDE-- Your Text
A
Goes here. Download this
awesome diagram.
PUT YOUR TEXT HERE
• Your Text Goes here
B E
• Download this
AB AE awesome diagram
• Bring your presentation
to life
• Capture your
audience’s attention
BC ED • All images are 100%
editable in powerpoint
• Pitch your ideas
C D
convincingly
CD
www.slideteam.net Your Logo
6. Venn Diagram – 5Pieces
ABCDE-- Your Text
A
Goes here. Download this
awesome diagram.
PUT YOUR TEXT HERE
• Your Text Goes here
B E
• Download this
AB AE awesome diagram
• Bring your presentation
to life
• Capture your
audience’s attention
BC ED • All images are 100%
editable in powerpoint
• Pitch your ideas
C D
convincingly
CD
www.slideteam.net Your Logo
7. Venn Diagram – 5Pieces
ABCDE-- Your Text
A
Goes here. Download this
awesome diagram.
Your Text Goes here. Download this
awesome diagram. Bring your
presentation to life. Capture your
audience’s attention. All images are
B E
100% editable in powerpoint
AB AE Pitch your ideas convincingly.
Your Text Goes here. Download this
awesome diagram. Bring your
BC ED presentation to life. Capture your
audience’s attention. All images are
100% editable in powerpoint
Pitch your ideas convincingly.
C CD
D
www.slideteam.net Your Logo
8. Venn Diagram – 5Pieces
ABCDE-- Your Text
A
Goes here. Download this
awesome diagram.
Your Text Goes here. Download this
awesome diagram. Bring your
presentation to life. Capture your
audience’s attention. All images are
B E
100% editable in powerpoint
AB AE Pitch your ideas convincingly.
Your Text Goes here. Download this
awesome diagram. Bring your
BC ED presentation to life. Capture your
audience’s attention. All images are
100% editable in powerpoint
Pitch your ideas convincingly.
C CD
D
www.slideteam.net Your Logo
9. All images are 100% editable in Powerpoint
“Change color, size and orientation of any icon to your liking”
www.slideteam.net
10. Ungrouping the object
2
1
3
1. Right click the object.
2. Choose Group and then Ungroup.
3. Click beside the object and drag the arrow over it.
www.slideteam.net
11. Edit Color
2 3
1
1. Select the shape to change the color and Right click the object( click any object which you
want to change color)
2. Choose Format Shape in the dialog box.
3. Choose “Fill” in the Format Shape box then “Solid” or “Gradient” depending on the
appearance of the object. Change colour as shown in the picture.
www.slideteam.net