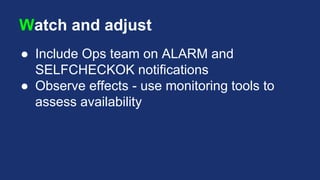
Download to read offline


![Script Snippet
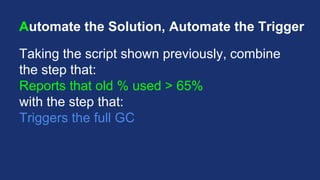
JAVA_PID=`pgrep -f -u tomcat /usr/lib/jvm/jre/bin/java`
RAW_JSTATS=`jstat -gcutil $JAVA_PID | grep -v "S0"`
old_pcnt_used=`echo $RAW_JSTATS | cut -f4 -d" "`
integer_old_pcnt_used=`echo $old_pcnt_used |
awk '{ printf ("%1.0f", $1) }'`
if [ $integer_old_pcnt_used -gt $oldpcnttrigger ]; then
echo "Would trigger full GC here"
fi
https://github.com/SOASTA/velocity-2015-self-healing-systems](https://image.slidesharecdn.com/velocity2015buildingself-healingsystemsslideshareversion-150528030750-lva1-app6891-150608211147-lva1-app6892/85/Velocity-2015-Building-Self-Healing-Systems-31-320.jpg)


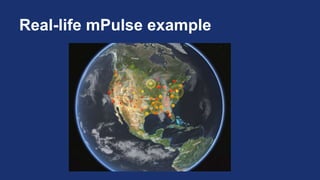


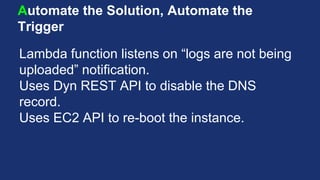

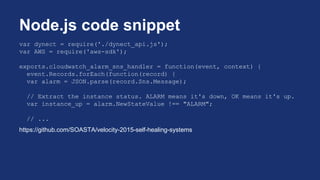
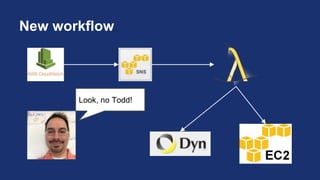

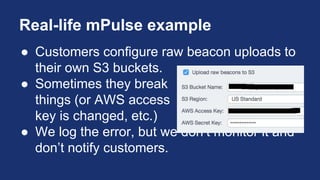


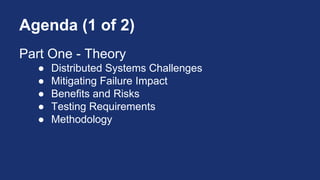
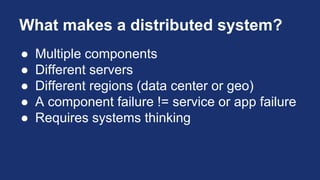
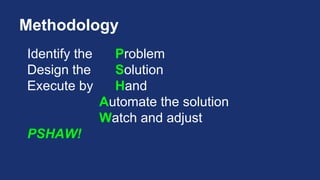
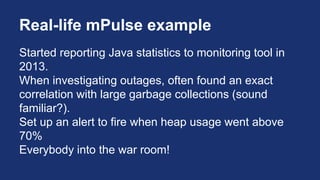
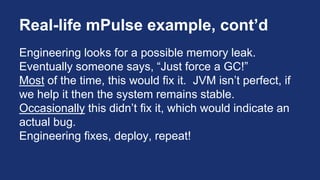
This document discusses building self-healing distributed systems. It begins with introducing the speakers and outlining the agenda, which covers both theory and practical examples of self-healing systems. In the theory section, it defines what makes a system distributed, challenges they face, and how enabling systems to heal themselves can provide benefits like improved uptime but also risks that must be mitigated. The methodology of identifying problems, designing automated solutions, executing manually, then automating and adjusting is presented. In the practice section, three examples are demonstrated: triggering a full garbage collection when JVM heap usage exceeds a threshold, automatically restarting an application server when beacon uploads fail, and opening a support case when customer file uploads break.


![The Selfish Stack [FutureStack16 NYC]](https://cdn.slidesharecdn.com/ss_thumbnails/selfishstackpresentationfinal1-160815212335-thumbnail.jpg?width=640&height=640&fit=bounds)


