Download to read offline


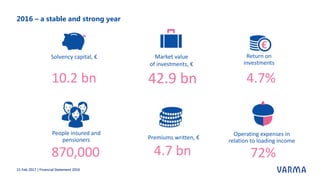
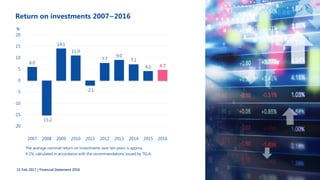
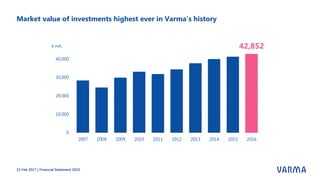
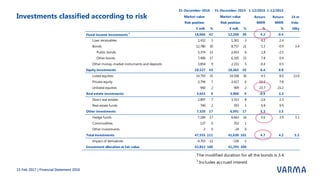
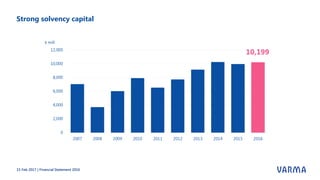
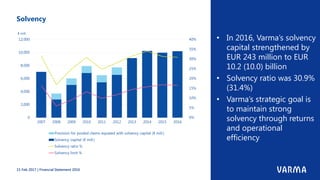

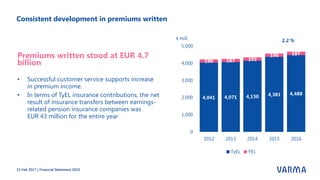
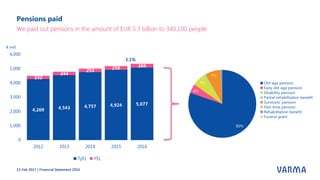

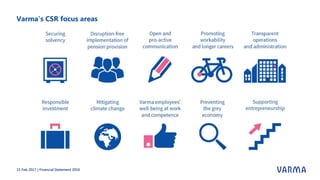


Varma's 2016 financial statement highlights a strong year with a market value of investments at €42.9 billion and a return on investments of 4.7%. The solvency capital increased to €10.2 billion, and premiums written amounted to €4.7 billion, with pensions of €5.3 billion paid to over 340,000 recipients. In terms of corporate social responsibility, Varma reduced the carbon footprint of its investment portfolio and improved service efficiency for entrepreneurs.


