Download to read offline
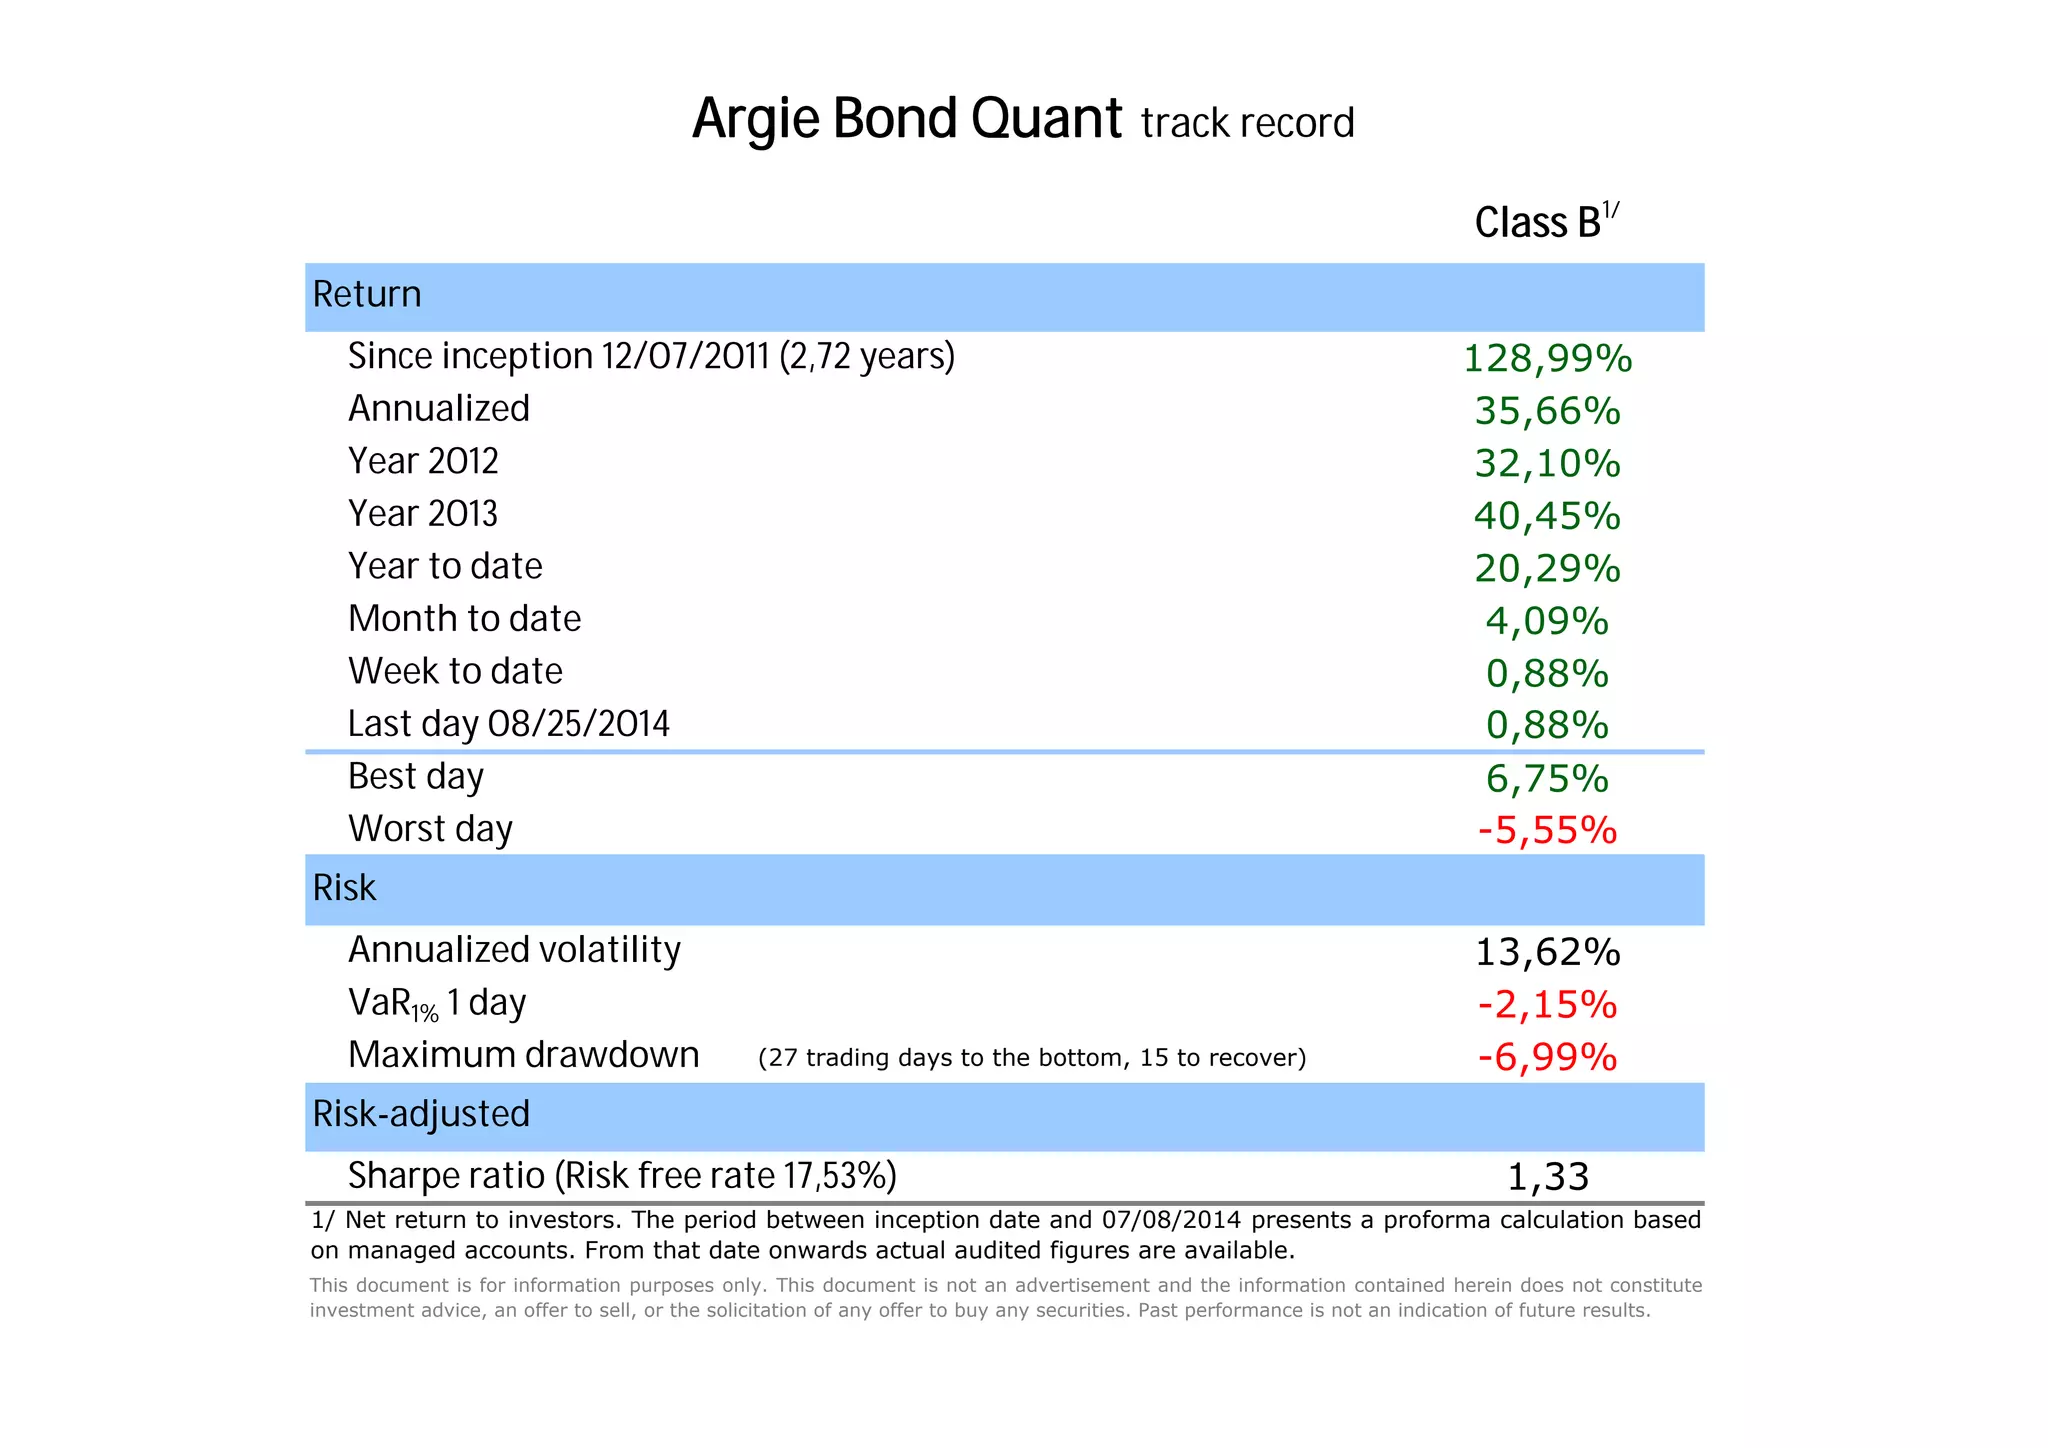
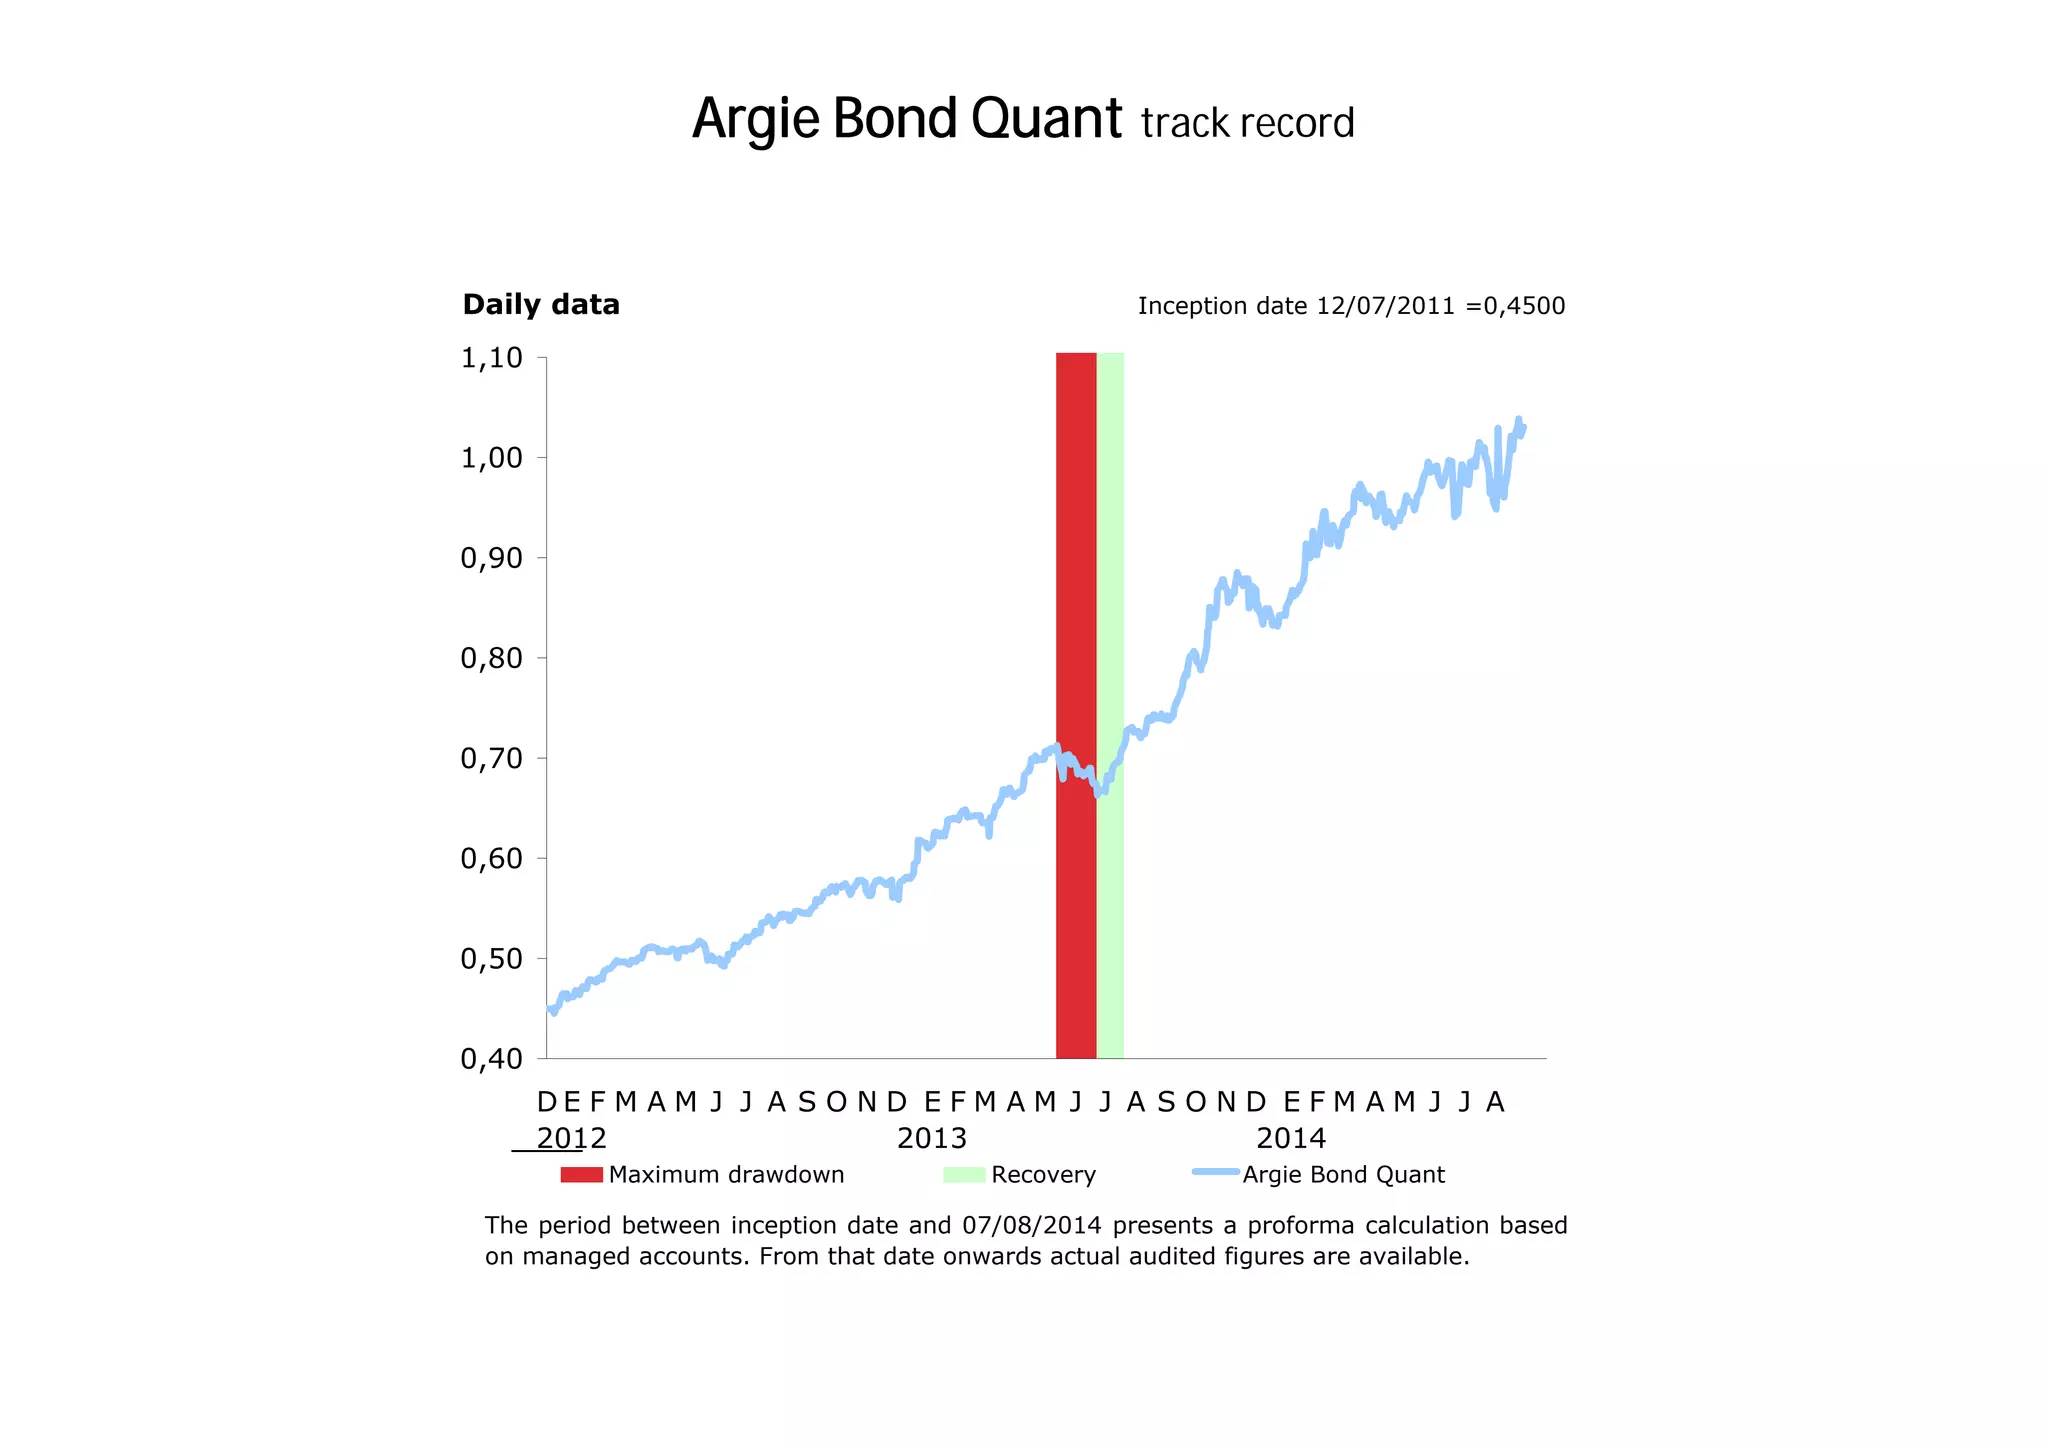
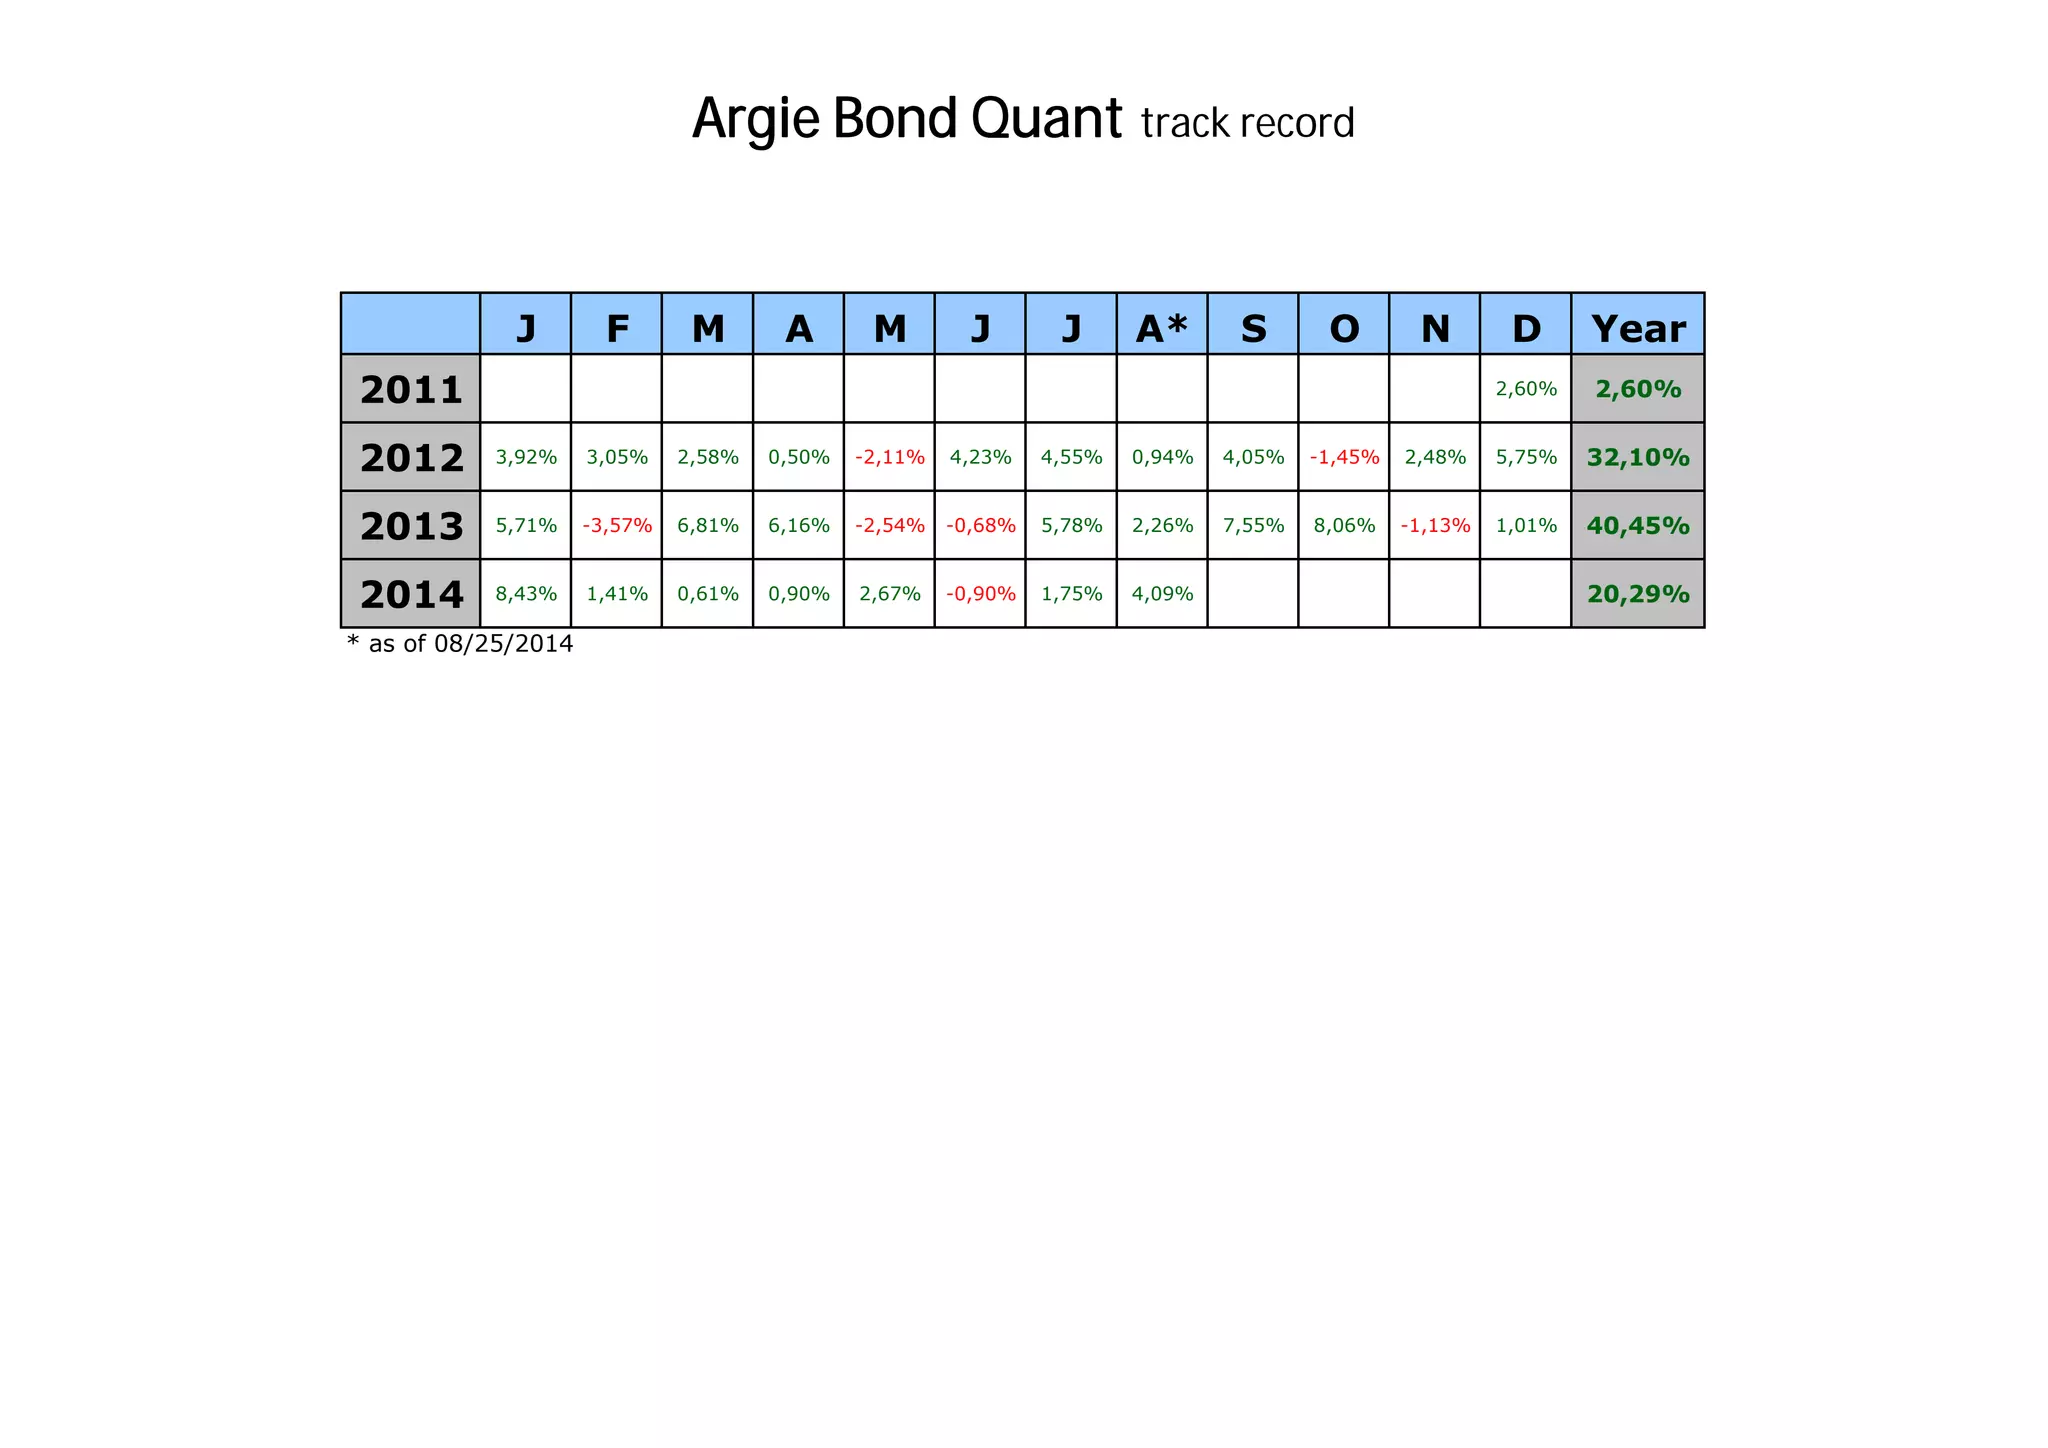

The document provides an overview of the Argie Bond Quant track record, detailing its annualized returns and performance metrics since inception on December 7, 2011. It highlights key statistics such as maximum drawdown, recovery periods, and Sharpe ratios, indicating a total return of 128.99% as of August 25, 2014. Furthermore, it clarifies that past performance does not guarantee future results and emphasizes that the document is for informational purposes only, not investment advice.


