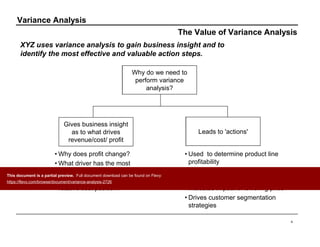
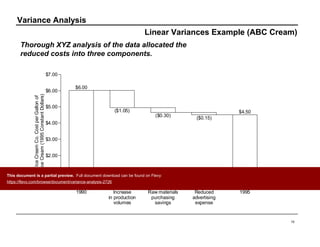
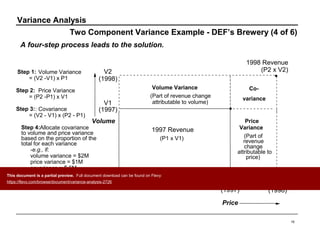
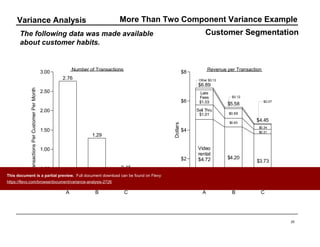
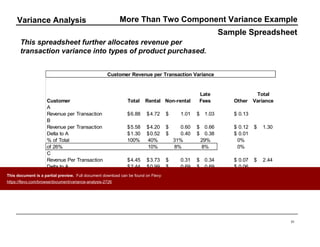
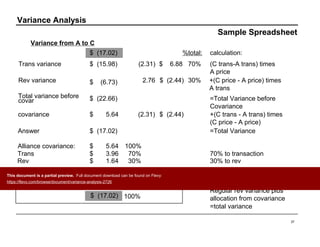
Variance Analysis
Variance Analysis
The Value of Variance Analysis
4
Why do we need to
perform variance
analysis?
Gives business insight
as to what drives
revenue/cost/ profit
Leads to 'actions'
XYZ uses variance analysis to gain business insight and to
identify the most effective and valuable action steps.
• Why does profit change?
• What driver has the most
impact?
• What explains differences in
relative cost position?
• Used to determine product line
profitability
• Identifies areas of focus for cost
reduction
• Indicates impact of lowering price
• Drives customer segmentation
strategies
This document is a partial preview. Full document download can be found on Flevy:
https://flevy.com/browse/document/variance-analysis-2726
Variance Analysis
Linear Variance Example (ABC Cream)
7
Situation: •James and Peter’s ABC Ice Cream produce ice
cream which they sell in gallon-sized containers at
supermarkets around the country
•They have tracked their cost to produce ice cream
per gallon over time and have seen it decline over
five years by 25%
Question: •What has driven costs downward?
•What might James and Peter focus on to achieve better
cost savings going into the future?
This document is a partial preview. Full document download can be found on Flevy:
https://flevy.com/browse/document/variance-analysis-2726
Variance Analysis
Linear Variances Example (ABC Cream)
10
1990 Increase
in production
volumes
Raw materials
purchasing
savings
Reduced
advertising
expense
1995
$6.00
($1.05)
($0.30) ($0.15)
$4.50
$0.00
$1.00
$2.00
$3.00
$4.00
$5.00
$6.00
$7.00
IceCreamCo.CostperGallonof
IceCream(1995ConstantDollars)
Thorough XYZ analysis of the data allocated the
reduced costs into three components.
This document is a partial preview. Full document download can be found on Flevy:
https://flevy.com/browse/document/variance-analysis-2726
Variance Analysis
Two Component Variance Example - DEF’s Brewery (1 of 6)
13
Situation: •DEF’s Brewery produces high-quality beers which it
sells in cases
•In the past year, DEF’s Brewery has experienced
15% revenue growth. During the same time, sales
volumes and prices have both increased
Question: •DEF’s Brewery would like to understand what
percent of the revenue increase comes from the
increase in sales volumes, and what percent from
the increase in priceThis document is a partial preview. Full document download can be found on Flevy:
https://flevy.com/browse/document/variance-analysis-2726
Variance Analysis
Two Component Variance Example - DEF’s Brewery (4 of 6)
16
Volume
1998 Revenue
(P2 x V2)
1997 Revenue
(P1 x V1)
Price
Variance
(Part of
revenue
change
attributable to
price)
P1
(1997)
P2
(1998)
V2
(1998)
V1
(1997)
Price
Volume Variance
(Part of revenue change
attributable to volume)
Co-
variance
Step 1: Volume Variance
= (V2 -V1) x P1
Step 2: Price Variance
= (P2 -P1) x V1
Step 3:: Covariance
= (V2 - V1) x (P2 - P1)
Step 4:Allocate covariance
to volume and price variance
based on the proportion of the
total for each variance
-e.g., if:
volume variance = $2M
price variance = $1M
covariance = $.5M
then 66.7% of $.5 is
added to the volume and
33.3% is added to the price
A four-step process leads to the solution.
This document is a partial preview. Full document download can be found on Flevy:
https://flevy.com/browse/document/variance-analysis-2726
Variance Analysis
Negative Covariance
19
14.7
new
(1998)
9.7
(1997)
$18.20
(1997)
$17.00
new
(1998)
Volume
Price
Even if one variable decreases, the formula applies the same way. The
only difference is that price variance and covariance turn negative.
Volume = (14.7-9.7) x $18.20
Price = ($17.00-$18.20) x 9.7
=
=
$91.0 MM
- $11.6 MM
Covariance = (14.7-9.7) x ($17.00-$18.20) = - $6.0 MM
$73.4 MMTotal Variance
In some situations one variable may fall as the other rises.
The formula for covariance does not change.
This document is a partial preview. Full document download can be found on Flevy:
https://flevy.com/browse/document/variance-analysis-2726
Variance Analysis
More Than Two Component Variance Example
22
Situation: •GHK Video is a chain of video rental stores in the Northeast
U.S. In addition to renting video movies and games, the stores
sell a variety of movie-related items (popcorn, candy, film
magazines). They also get money for late fees
•XYZ has been hired to help GHK Video segment its customer
base and understand what drives the differences in spending
patterns between segments
Question: •What variables impact revenue per customer?
•What is the overall variance by customer type? What are the
breakdowns of that variance by customer type?
•What should XYZ focus on improving?
This document is a partial preview. Full document download can be found on Flevy:
https://flevy.com/browse/document/variance-analysis-2726
Variance Analysis
25
Other $0.13
Late
Fees
$1.03
Sell Thru
$1.01
Video
rental
$4.72
$0.12
$0.66
$0.60
$4.20
$0.07
$0.34
$0.31
$3.73
A B C
$6.89
$5.58
$4.45
$0
$2
$4
$6
$8
Dollars
2.76
1.29
0.45
A B C
0.00
0.50
1.00
1.50
2.00
2.50
3.00
TransactionsPerCustomerPerMonth
Number of Transactions Revenue per Transaction
The following data was made available
about customer habits.
Customer Segmentation
More Than Two Component Variance Example
This document is a partial preview. Full document download can be found on Flevy:
https://flevy.com/browse/document/variance-analysis-2726
Variance Analysis
Sample Spreadsheet
28
This spreadsheet details the calculations necessary to
compute the variances and covariance for transactions
and revenue per customer.
Facts:
Total Trans/ Rev/ Total
Customer Rev/Mnth Mnth Trans Variance
A 19.01$ 2.76 6.88$
B 7.20$ 1.29 5.58$ (11.82)$
C 2.00$ 0.45 4.45$ (17.02)$
Variance from A to B
(11.82)$ %total: calculation:
trans variance (10.14)$ (1.47) 6.88$ 74% (B trans - A trans) times A price
rev variance (3.60)$ 2.76 (1.30)$ 26% + (B price - A price) times A trans
total variance before covar (13.73)$ =Total Variance before Covariance
covariance 1.92$ (1.47) (1.30)$ + (B trans - A trans) times (B price - A price)
answer (11.82)$ =Total Variance
Allocate covariance: 1.92$ 100%
trans 1.42$ 74% 74% to transaction
rev 0.50$ 26% 26% to rev
Total Delta Trans (8.72)$ 74% Regular trans variance plus allocation from covariance
Total Delta Price (3.09)$ 26% Regular rev variance plus allocation from covariance
(11.82)$ 100% =total variance
More Than Two Component Variance Example
This document is a partial preview. Full document download can be found on Flevy:
https://flevy.com/browse/document/variance-analysis-2726
Variance Analysis
Sample Spreadsheet
31
Customer Revenue per Transaction Variance
Customer Total Rental Non-rental
Late
Fees Other
Total
Variance
A
Revenue per Transaction 6.88$ 4.72$ 1.01$ 1.03$ 0.13$
B
Revenue per Transaction 5.58$ 4.20$ 0.60$ 0.66$ 0.12$ 1.30$
Delta to A 1.30$ 0.52$ 0.40$ 0.38$ 0.01$
% of Total 100% 40% 31% 29% 0%
of 26% 10% 8% 8% 0%
C
Revenue Per Transaction 4.45$ 3.73$ 0.31$ 0.34$ 0.07$ 2.44$
Delta to A 2.44$ 0.99$ 0.69$ 0.69$ 0.06$
% of Total 100% 41% 28% 28% 2%
of 30% 12% 8% 8% 1%
This spreadsheet further allocates revenue per
transaction variance into types of product purchased.
More Than Two Component Variance Example
This document is a partial preview. Full document download can be found on Flevy:
https://flevy.com/browse/document/variance-analysis-2726
Variance Analysis
Summary
34
• What drives A customer behavior is the number of
transactions they complete
–so, XYZ needs to help improve the frequency of
transactions of B and C customers (assuming
that A customers continue to remain loyal and
that a retention strategy is therefore not the most
leveraged work)
This document is a partial preview. Full document download can be found on Flevy:
https://flevy.com/browse/document/variance-analysis-2726
Variance Analysis
Sample Spreadsheet
37
Variance from A to C
Trans variance
Rev variance
Total variance before
covar
covariance
Answer
Alliance covariance:
Trans
Rev
$ (17.02)
$ (15.98)
$ (6.73)
$ (22.66)
$ 5.64
$ 5.64
$ 3.96
$ 1.64
$ (17.02)
100%
70%
30%
Total Delta Trans
Total Delta Price
$ (11.96)
$ (5.6)
$ (17.02)
(2.31)
2.76
(2.31) $ (2.44)
$ 6.88
$ (2.44)
%total:
70%
30%
calculation:
(C trans-A trans) times
A price
+(C price - A price) times
A trans
=Total Variance before
Covariance
+(C trans - A trans) times
(C price - A price)
=Total Variance
70% to transaction
30% to rev
Regular trans variance plus
allocation from covariance
Regular rev variance plus
allocation from covariance
=total variance
70%
30%
100%
This document is a partial preview. Full document download can be found on Flevy:
https://flevy.com/browse/document/variance-analysis-2726
1
Flevy (www.flevy.com) is the marketplace
for premium documents. These
documents can range from Business
Frameworks to Financial Models to
PowerPoint Templates.
Flevy was founded under the principle that
companies waste a lot of time and money
recreating the same foundational business
documents. Our vision is for Flevy to
become a comprehensive knowledge base
of business documents. All organizations,
from startups to large enterprises, can use
Flevy— whether it's to jumpstart projects, to
find reference or comparison materials, or
just to learn.
Contact Us
Please contact us with any questions you may have
about our company.
• General Inquiries
support@flevy.com
• Media/PR
press@flevy.com
• Billing
billing@flevy.com

Variance Analysis

  • 1.
  • 2.
    Variance Analysis The Valueof Variance Analysis 4 Why do we need to perform variance analysis? Gives business insight as to what drives revenue/cost/ profit Leads to 'actions' XYZ uses variance analysis to gain business insight and to identify the most effective and valuable action steps. • Why does profit change? • What driver has the most impact? • What explains differences in relative cost position? • Used to determine product line profitability • Identifies areas of focus for cost reduction • Indicates impact of lowering price • Drives customer segmentation strategies This document is a partial preview. Full document download can be found on Flevy: https://flevy.com/browse/document/variance-analysis-2726
  • 3.
    Variance Analysis Linear VarianceExample (ABC Cream) 7 Situation: •James and Peter’s ABC Ice Cream produce ice cream which they sell in gallon-sized containers at supermarkets around the country •They have tracked their cost to produce ice cream per gallon over time and have seen it decline over five years by 25% Question: •What has driven costs downward? •What might James and Peter focus on to achieve better cost savings going into the future? This document is a partial preview. Full document download can be found on Flevy: https://flevy.com/browse/document/variance-analysis-2726
  • 4.
    Variance Analysis Linear VariancesExample (ABC Cream) 10 1990 Increase in production volumes Raw materials purchasing savings Reduced advertising expense 1995 $6.00 ($1.05) ($0.30) ($0.15) $4.50 $0.00 $1.00 $2.00 $3.00 $4.00 $5.00 $6.00 $7.00 IceCreamCo.CostperGallonof IceCream(1995ConstantDollars) Thorough XYZ analysis of the data allocated the reduced costs into three components. This document is a partial preview. Full document download can be found on Flevy: https://flevy.com/browse/document/variance-analysis-2726
  • 5.
    Variance Analysis Two ComponentVariance Example - DEF’s Brewery (1 of 6) 13 Situation: •DEF’s Brewery produces high-quality beers which it sells in cases •In the past year, DEF’s Brewery has experienced 15% revenue growth. During the same time, sales volumes and prices have both increased Question: •DEF’s Brewery would like to understand what percent of the revenue increase comes from the increase in sales volumes, and what percent from the increase in priceThis document is a partial preview. Full document download can be found on Flevy: https://flevy.com/browse/document/variance-analysis-2726
  • 6.
    Variance Analysis Two ComponentVariance Example - DEF’s Brewery (4 of 6) 16 Volume 1998 Revenue (P2 x V2) 1997 Revenue (P1 x V1) Price Variance (Part of revenue change attributable to price) P1 (1997) P2 (1998) V2 (1998) V1 (1997) Price Volume Variance (Part of revenue change attributable to volume) Co- variance Step 1: Volume Variance = (V2 -V1) x P1 Step 2: Price Variance = (P2 -P1) x V1 Step 3:: Covariance = (V2 - V1) x (P2 - P1) Step 4:Allocate covariance to volume and price variance based on the proportion of the total for each variance -e.g., if: volume variance = $2M price variance = $1M covariance = $.5M then 66.7% of $.5 is added to the volume and 33.3% is added to the price A four-step process leads to the solution. This document is a partial preview. Full document download can be found on Flevy: https://flevy.com/browse/document/variance-analysis-2726
  • 7.
    Variance Analysis Negative Covariance 19 14.7 new (1998) 9.7 (1997) $18.20 (1997) $17.00 new (1998) Volume Price Evenif one variable decreases, the formula applies the same way. The only difference is that price variance and covariance turn negative. Volume = (14.7-9.7) x $18.20 Price = ($17.00-$18.20) x 9.7 = = $91.0 MM - $11.6 MM Covariance = (14.7-9.7) x ($17.00-$18.20) = - $6.0 MM $73.4 MMTotal Variance In some situations one variable may fall as the other rises. The formula for covariance does not change. This document is a partial preview. Full document download can be found on Flevy: https://flevy.com/browse/document/variance-analysis-2726
  • 8.
    Variance Analysis More ThanTwo Component Variance Example 22 Situation: •GHK Video is a chain of video rental stores in the Northeast U.S. In addition to renting video movies and games, the stores sell a variety of movie-related items (popcorn, candy, film magazines). They also get money for late fees •XYZ has been hired to help GHK Video segment its customer base and understand what drives the differences in spending patterns between segments Question: •What variables impact revenue per customer? •What is the overall variance by customer type? What are the breakdowns of that variance by customer type? •What should XYZ focus on improving? This document is a partial preview. Full document download can be found on Flevy: https://flevy.com/browse/document/variance-analysis-2726
  • 9.
    Variance Analysis 25 Other $0.13 Late Fees $1.03 SellThru $1.01 Video rental $4.72 $0.12 $0.66 $0.60 $4.20 $0.07 $0.34 $0.31 $3.73 A B C $6.89 $5.58 $4.45 $0 $2 $4 $6 $8 Dollars 2.76 1.29 0.45 A B C 0.00 0.50 1.00 1.50 2.00 2.50 3.00 TransactionsPerCustomerPerMonth Number of Transactions Revenue per Transaction The following data was made available about customer habits. Customer Segmentation More Than Two Component Variance Example This document is a partial preview. Full document download can be found on Flevy: https://flevy.com/browse/document/variance-analysis-2726
  • 10.
    Variance Analysis Sample Spreadsheet 28 Thisspreadsheet details the calculations necessary to compute the variances and covariance for transactions and revenue per customer. Facts: Total Trans/ Rev/ Total Customer Rev/Mnth Mnth Trans Variance A 19.01$ 2.76 6.88$ B 7.20$ 1.29 5.58$ (11.82)$ C 2.00$ 0.45 4.45$ (17.02)$ Variance from A to B (11.82)$ %total: calculation: trans variance (10.14)$ (1.47) 6.88$ 74% (B trans - A trans) times A price rev variance (3.60)$ 2.76 (1.30)$ 26% + (B price - A price) times A trans total variance before covar (13.73)$ =Total Variance before Covariance covariance 1.92$ (1.47) (1.30)$ + (B trans - A trans) times (B price - A price) answer (11.82)$ =Total Variance Allocate covariance: 1.92$ 100% trans 1.42$ 74% 74% to transaction rev 0.50$ 26% 26% to rev Total Delta Trans (8.72)$ 74% Regular trans variance plus allocation from covariance Total Delta Price (3.09)$ 26% Regular rev variance plus allocation from covariance (11.82)$ 100% =total variance More Than Two Component Variance Example This document is a partial preview. Full document download can be found on Flevy: https://flevy.com/browse/document/variance-analysis-2726
  • 11.
    Variance Analysis Sample Spreadsheet 31 CustomerRevenue per Transaction Variance Customer Total Rental Non-rental Late Fees Other Total Variance A Revenue per Transaction 6.88$ 4.72$ 1.01$ 1.03$ 0.13$ B Revenue per Transaction 5.58$ 4.20$ 0.60$ 0.66$ 0.12$ 1.30$ Delta to A 1.30$ 0.52$ 0.40$ 0.38$ 0.01$ % of Total 100% 40% 31% 29% 0% of 26% 10% 8% 8% 0% C Revenue Per Transaction 4.45$ 3.73$ 0.31$ 0.34$ 0.07$ 2.44$ Delta to A 2.44$ 0.99$ 0.69$ 0.69$ 0.06$ % of Total 100% 41% 28% 28% 2% of 30% 12% 8% 8% 1% This spreadsheet further allocates revenue per transaction variance into types of product purchased. More Than Two Component Variance Example This document is a partial preview. Full document download can be found on Flevy: https://flevy.com/browse/document/variance-analysis-2726
  • 12.
    Variance Analysis Summary 34 • Whatdrives A customer behavior is the number of transactions they complete –so, XYZ needs to help improve the frequency of transactions of B and C customers (assuming that A customers continue to remain loyal and that a retention strategy is therefore not the most leveraged work) This document is a partial preview. Full document download can be found on Flevy: https://flevy.com/browse/document/variance-analysis-2726
  • 13.
    Variance Analysis Sample Spreadsheet 37 Variancefrom A to C Trans variance Rev variance Total variance before covar covariance Answer Alliance covariance: Trans Rev $ (17.02) $ (15.98) $ (6.73) $ (22.66) $ 5.64 $ 5.64 $ 3.96 $ 1.64 $ (17.02) 100% 70% 30% Total Delta Trans Total Delta Price $ (11.96) $ (5.6) $ (17.02) (2.31) 2.76 (2.31) $ (2.44) $ 6.88 $ (2.44) %total: 70% 30% calculation: (C trans-A trans) times A price +(C price - A price) times A trans =Total Variance before Covariance +(C trans - A trans) times (C price - A price) =Total Variance 70% to transaction 30% to rev Regular trans variance plus allocation from covariance Regular rev variance plus allocation from covariance =total variance 70% 30% 100% This document is a partial preview. Full document download can be found on Flevy: https://flevy.com/browse/document/variance-analysis-2726
  • 14.
    1 Flevy (www.flevy.com) isthe marketplace for premium documents. These documents can range from Business Frameworks to Financial Models to PowerPoint Templates. Flevy was founded under the principle that companies waste a lot of time and money recreating the same foundational business documents. Our vision is for Flevy to become a comprehensive knowledge base of business documents. All organizations, from startups to large enterprises, can use Flevy— whether it's to jumpstart projects, to find reference or comparison materials, or just to learn. Contact Us Please contact us with any questions you may have about our company. • General Inquiries support@flevy.com • Media/PR press@flevy.com • Billing billing@flevy.com