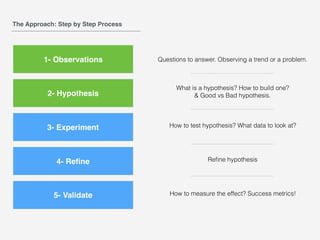
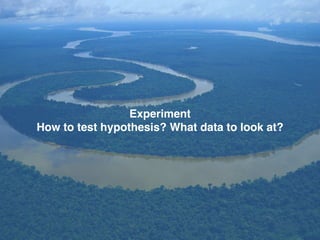
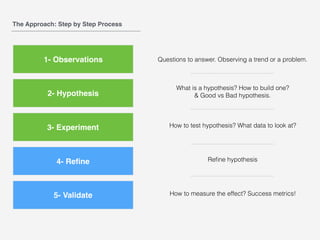
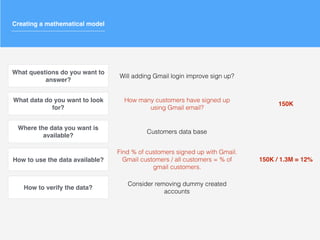
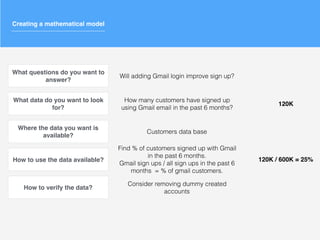
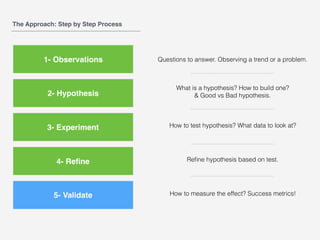
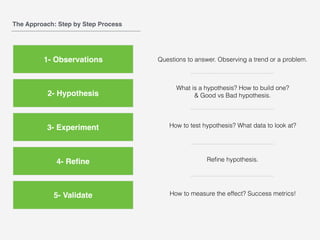
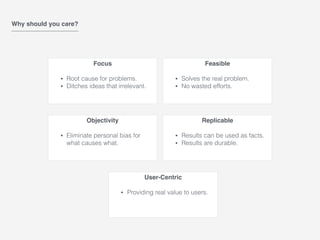
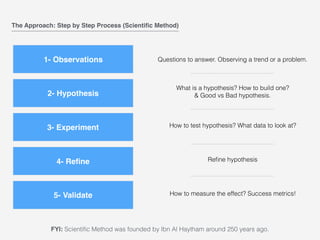
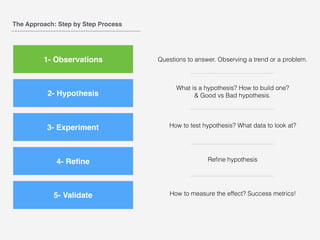
This document outlines a scientific, hypothesis-driven approach to product management. It discusses focusing on root causes, eliminating bias, and providing real user value. The process involves making observations, forming a hypothesis, running experiments to test the hypothesis, refining the hypothesis based on results, and validating findings with metrics. Key steps are defining the problem, building testable hypotheses, analyzing relevant data, refining over time, and measuring success. Forming good hypotheses requires identifying clear questions and variables. The goal is to objectively solve real problems through replicable, user-centric experiments.


![What is a hypothesis?
"If _____[I do this] _____, then _____[this]_____ will happen."
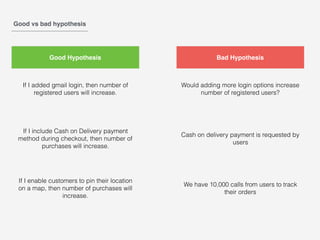
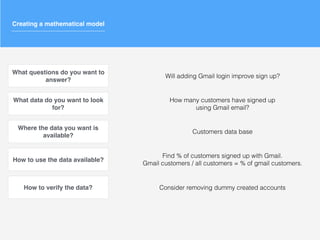
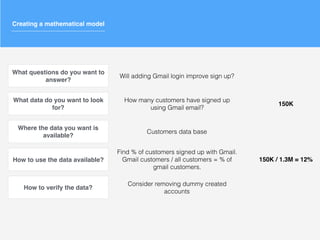
If I added gmail login, then number of registered users will increase.
If I include Cash on Delivery payment method during checkout, then number of purchases will increase.
If I enable customers to pin their location on a map, then number of purchases will increase.](https://image.slidesharecdn.com/validationandhypothesisbasedproductmanagement-byabdallahal-khalidi-190627065749/85/Validation-and-hypothesis-based-product-management-by-Abdallah-Al-Khalidi-15-320.jpg)