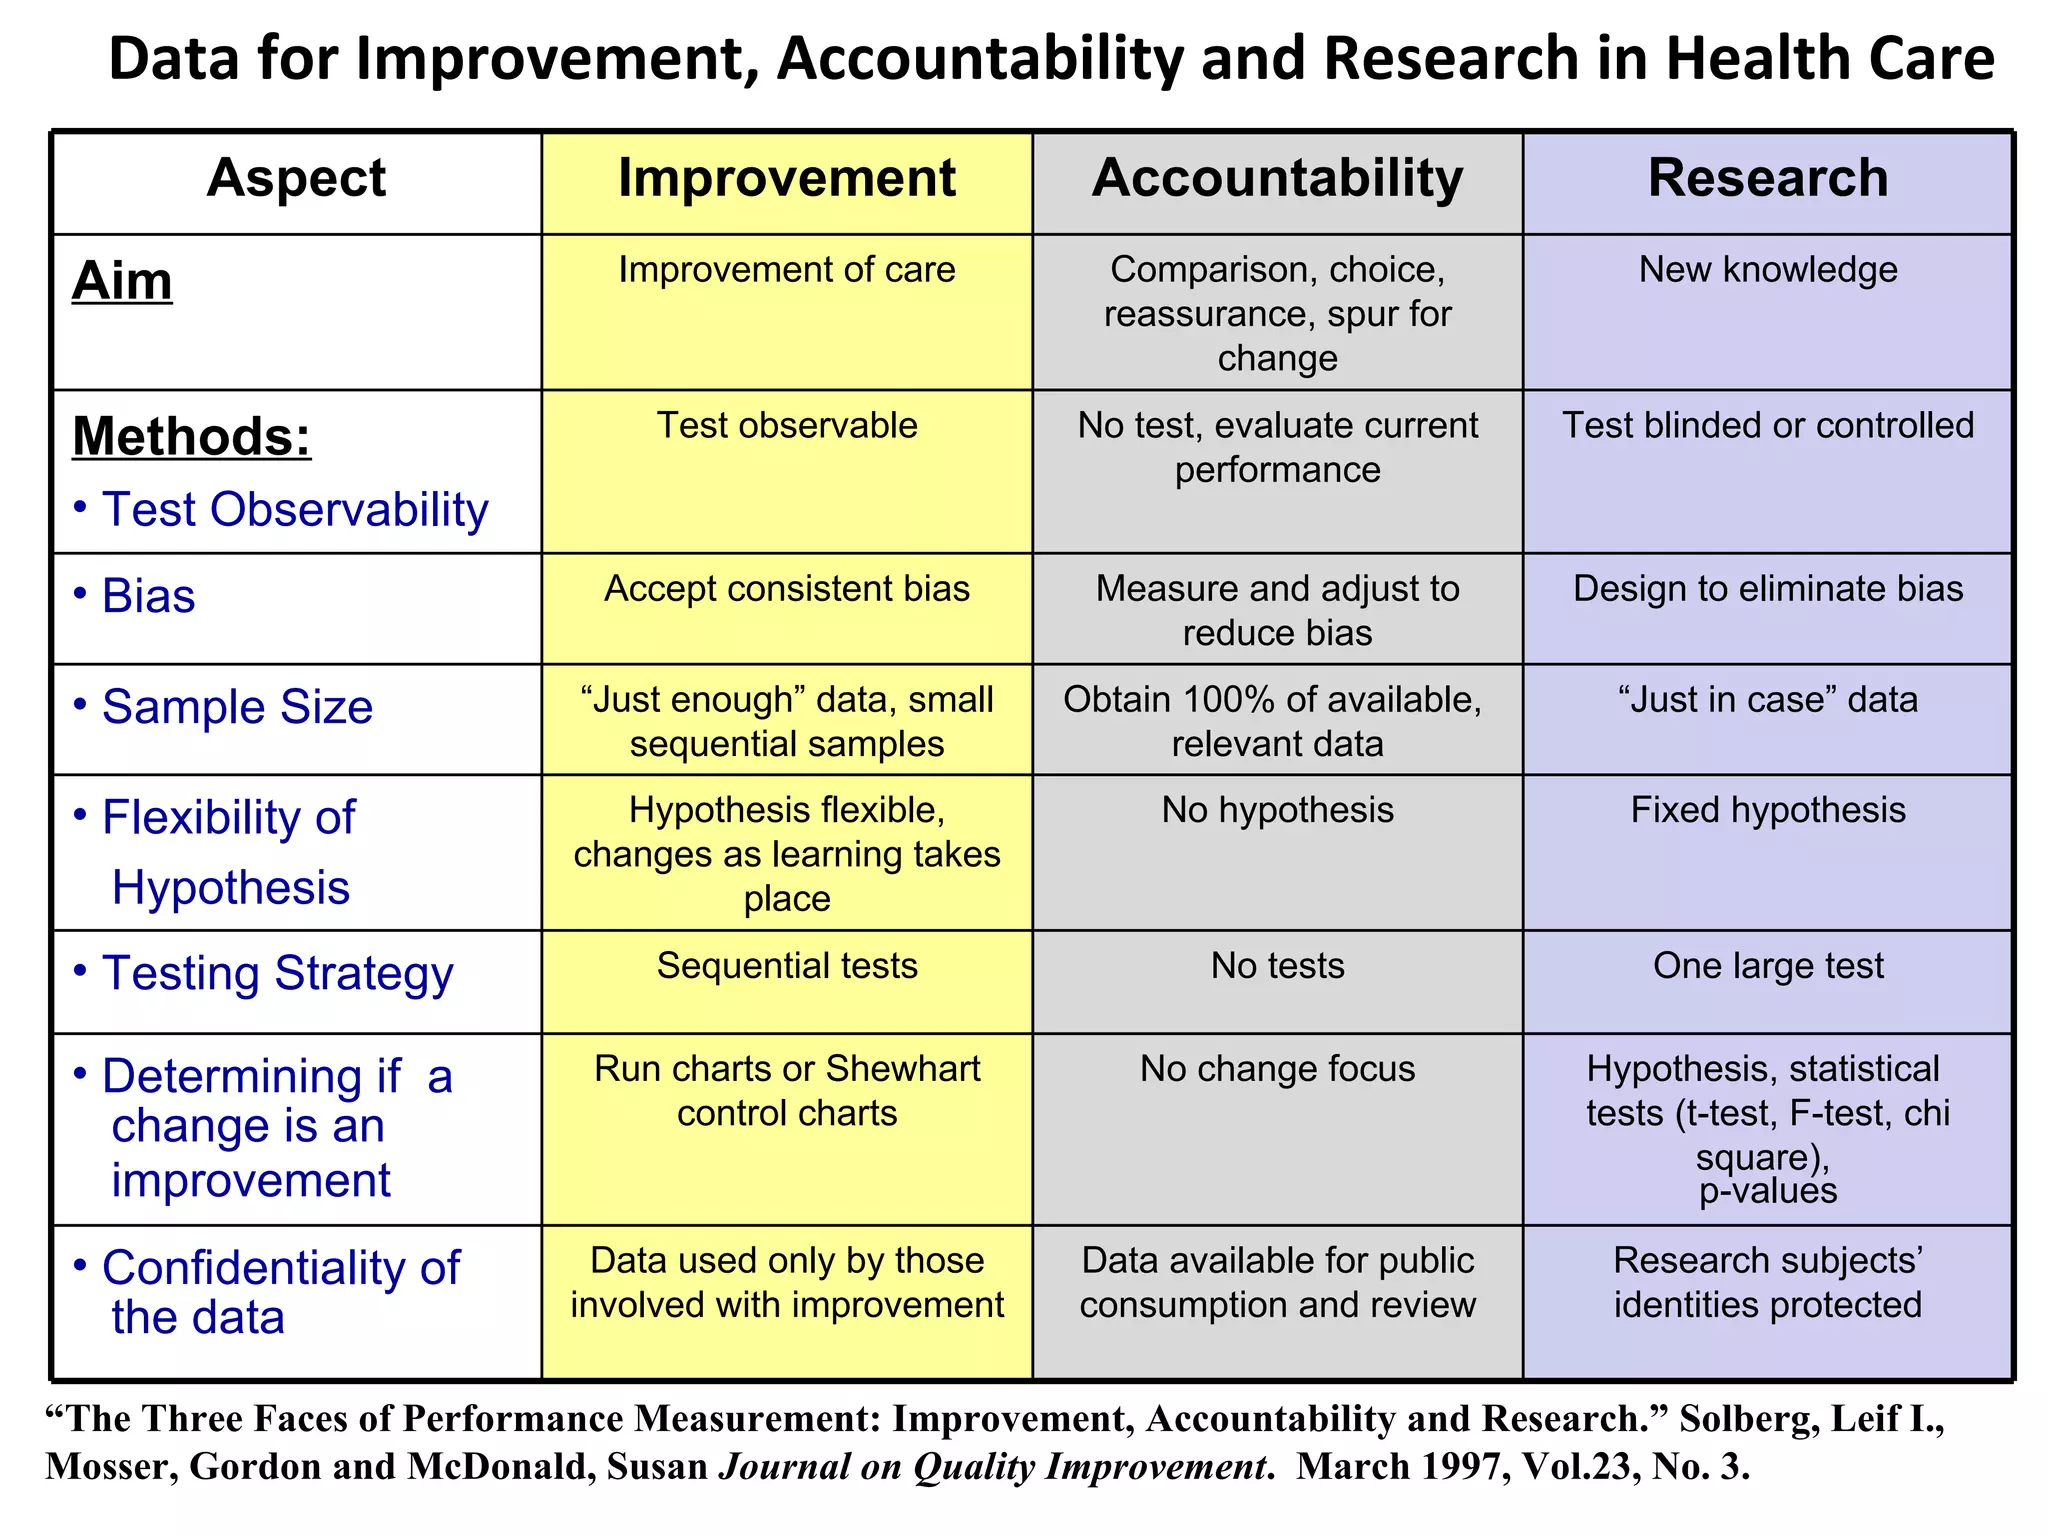
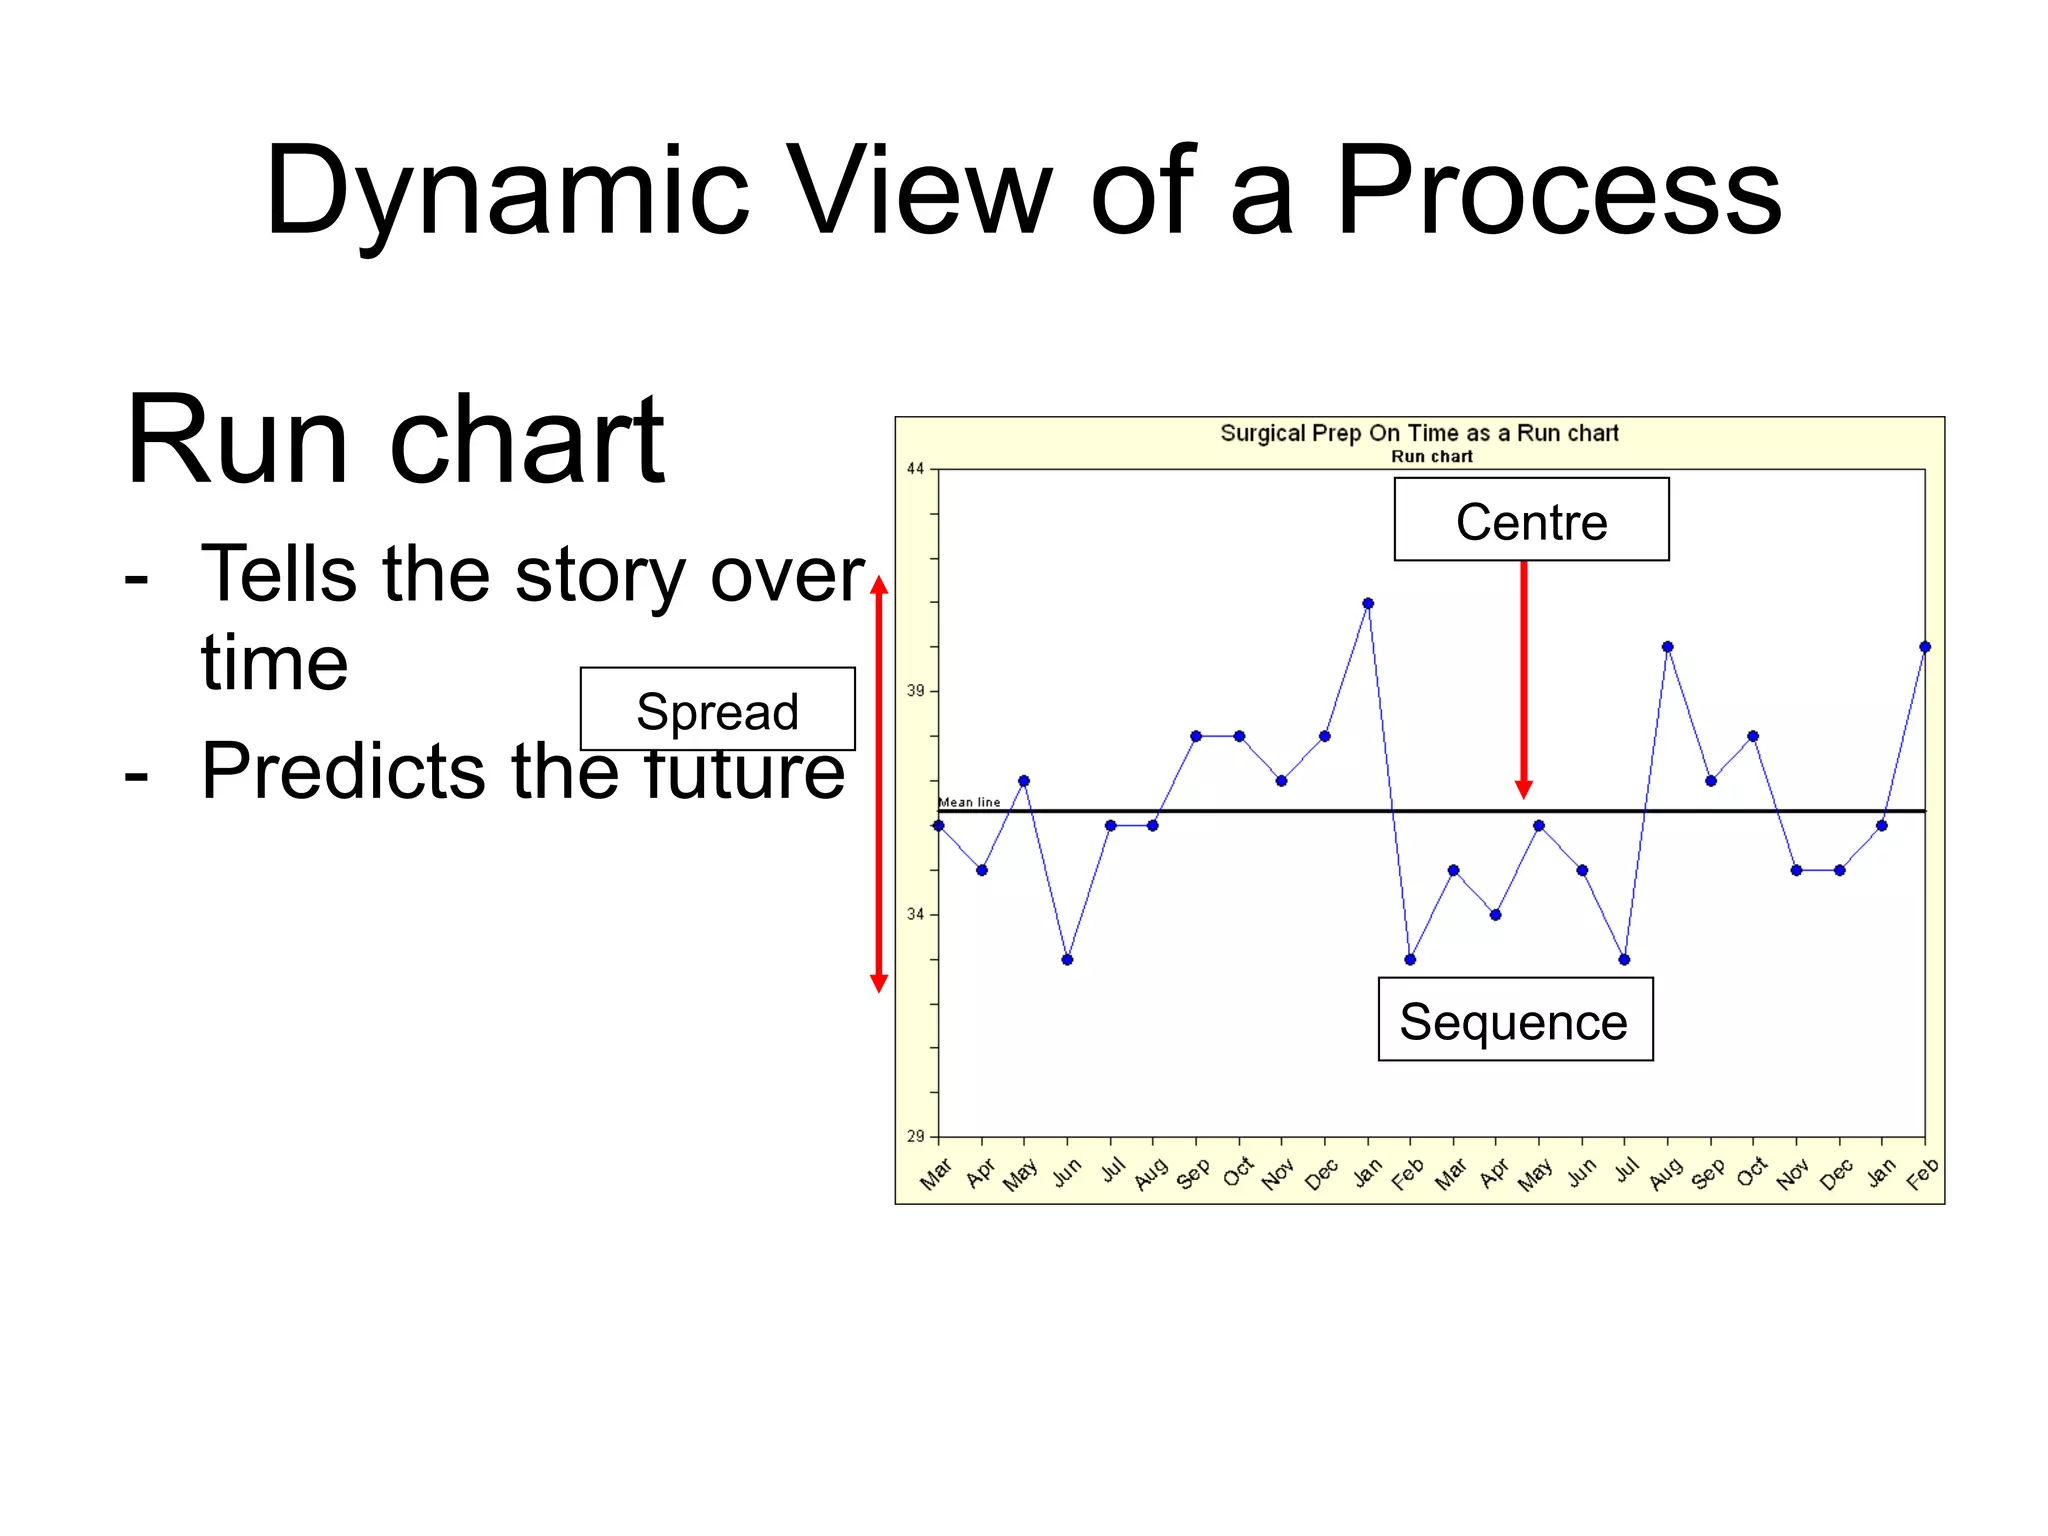
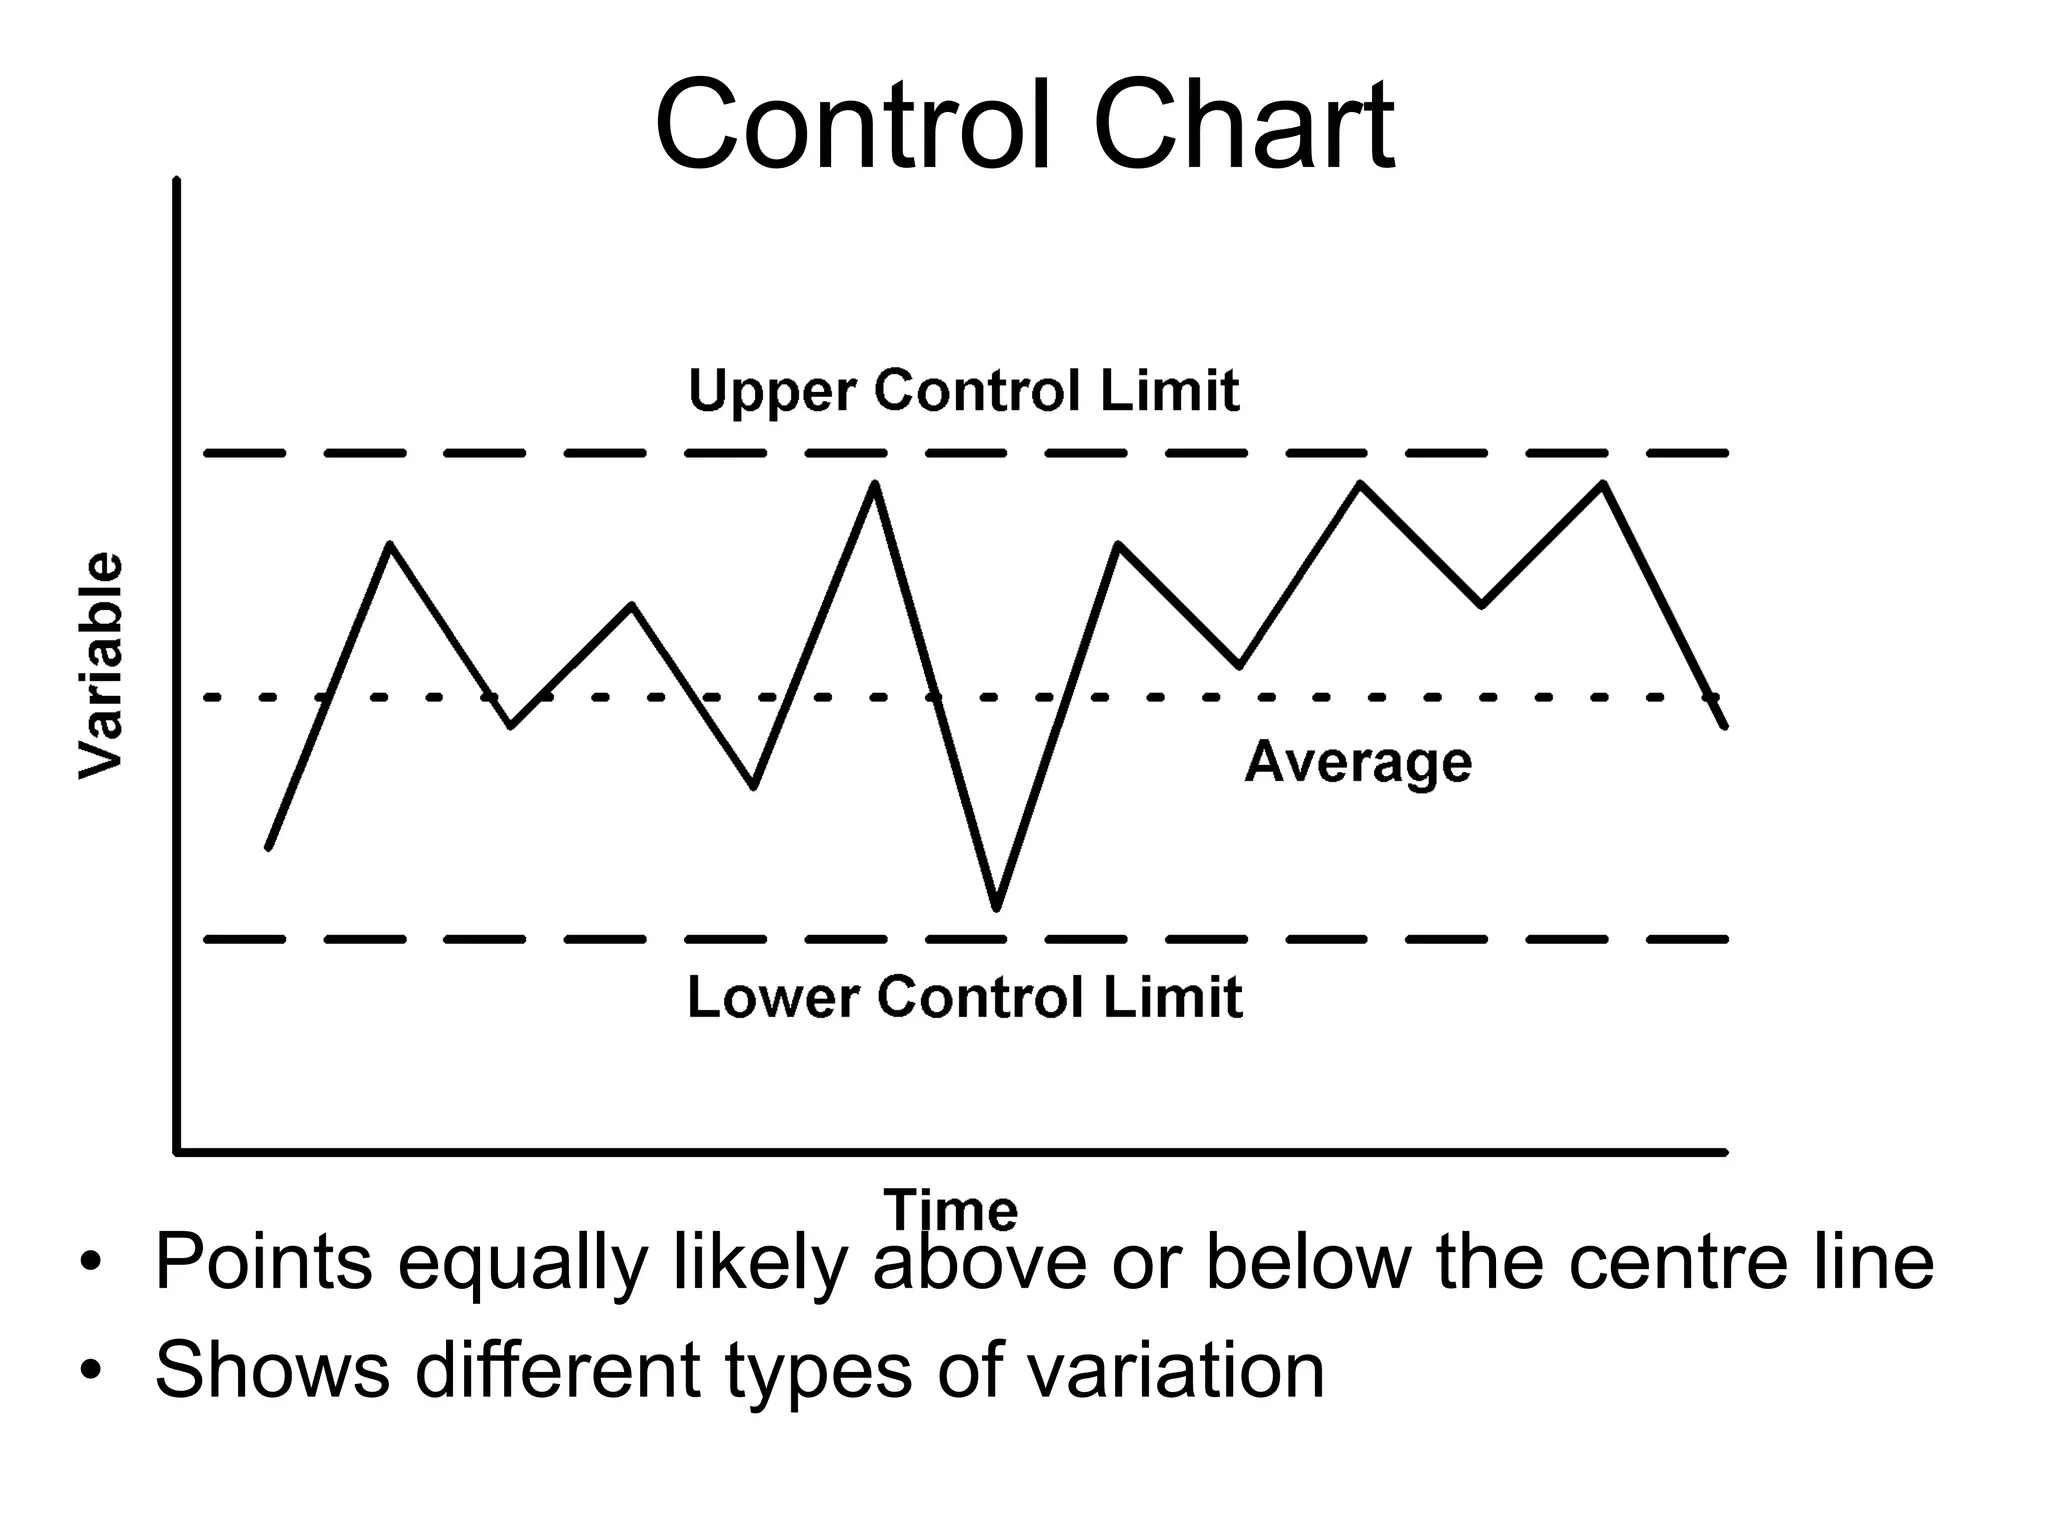
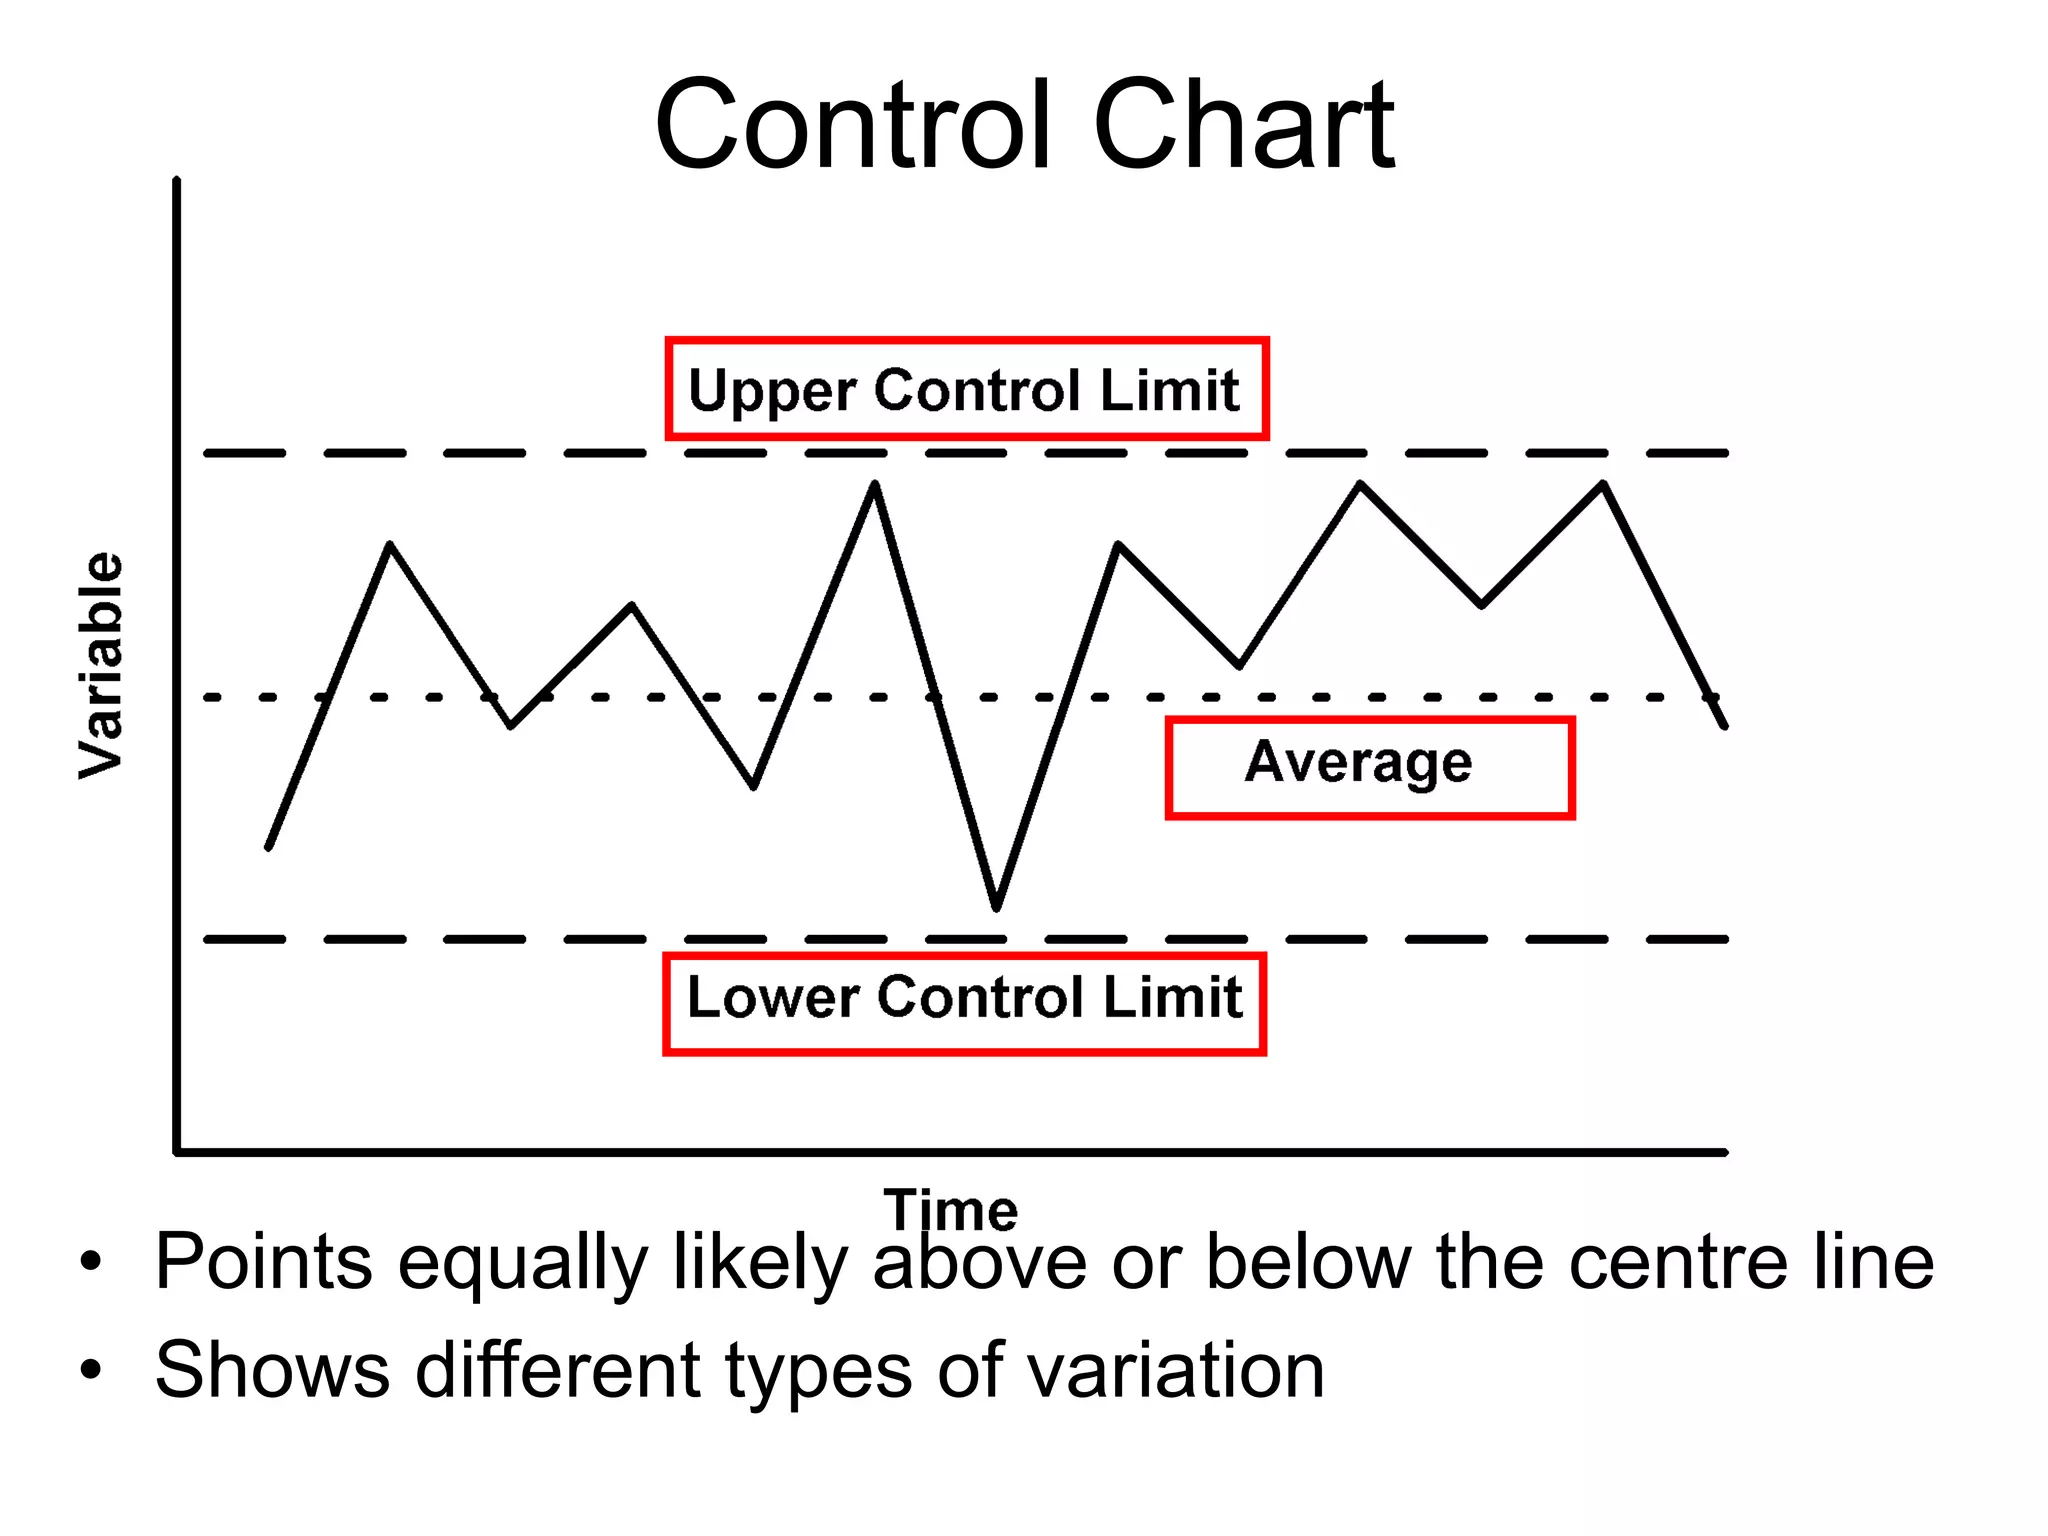
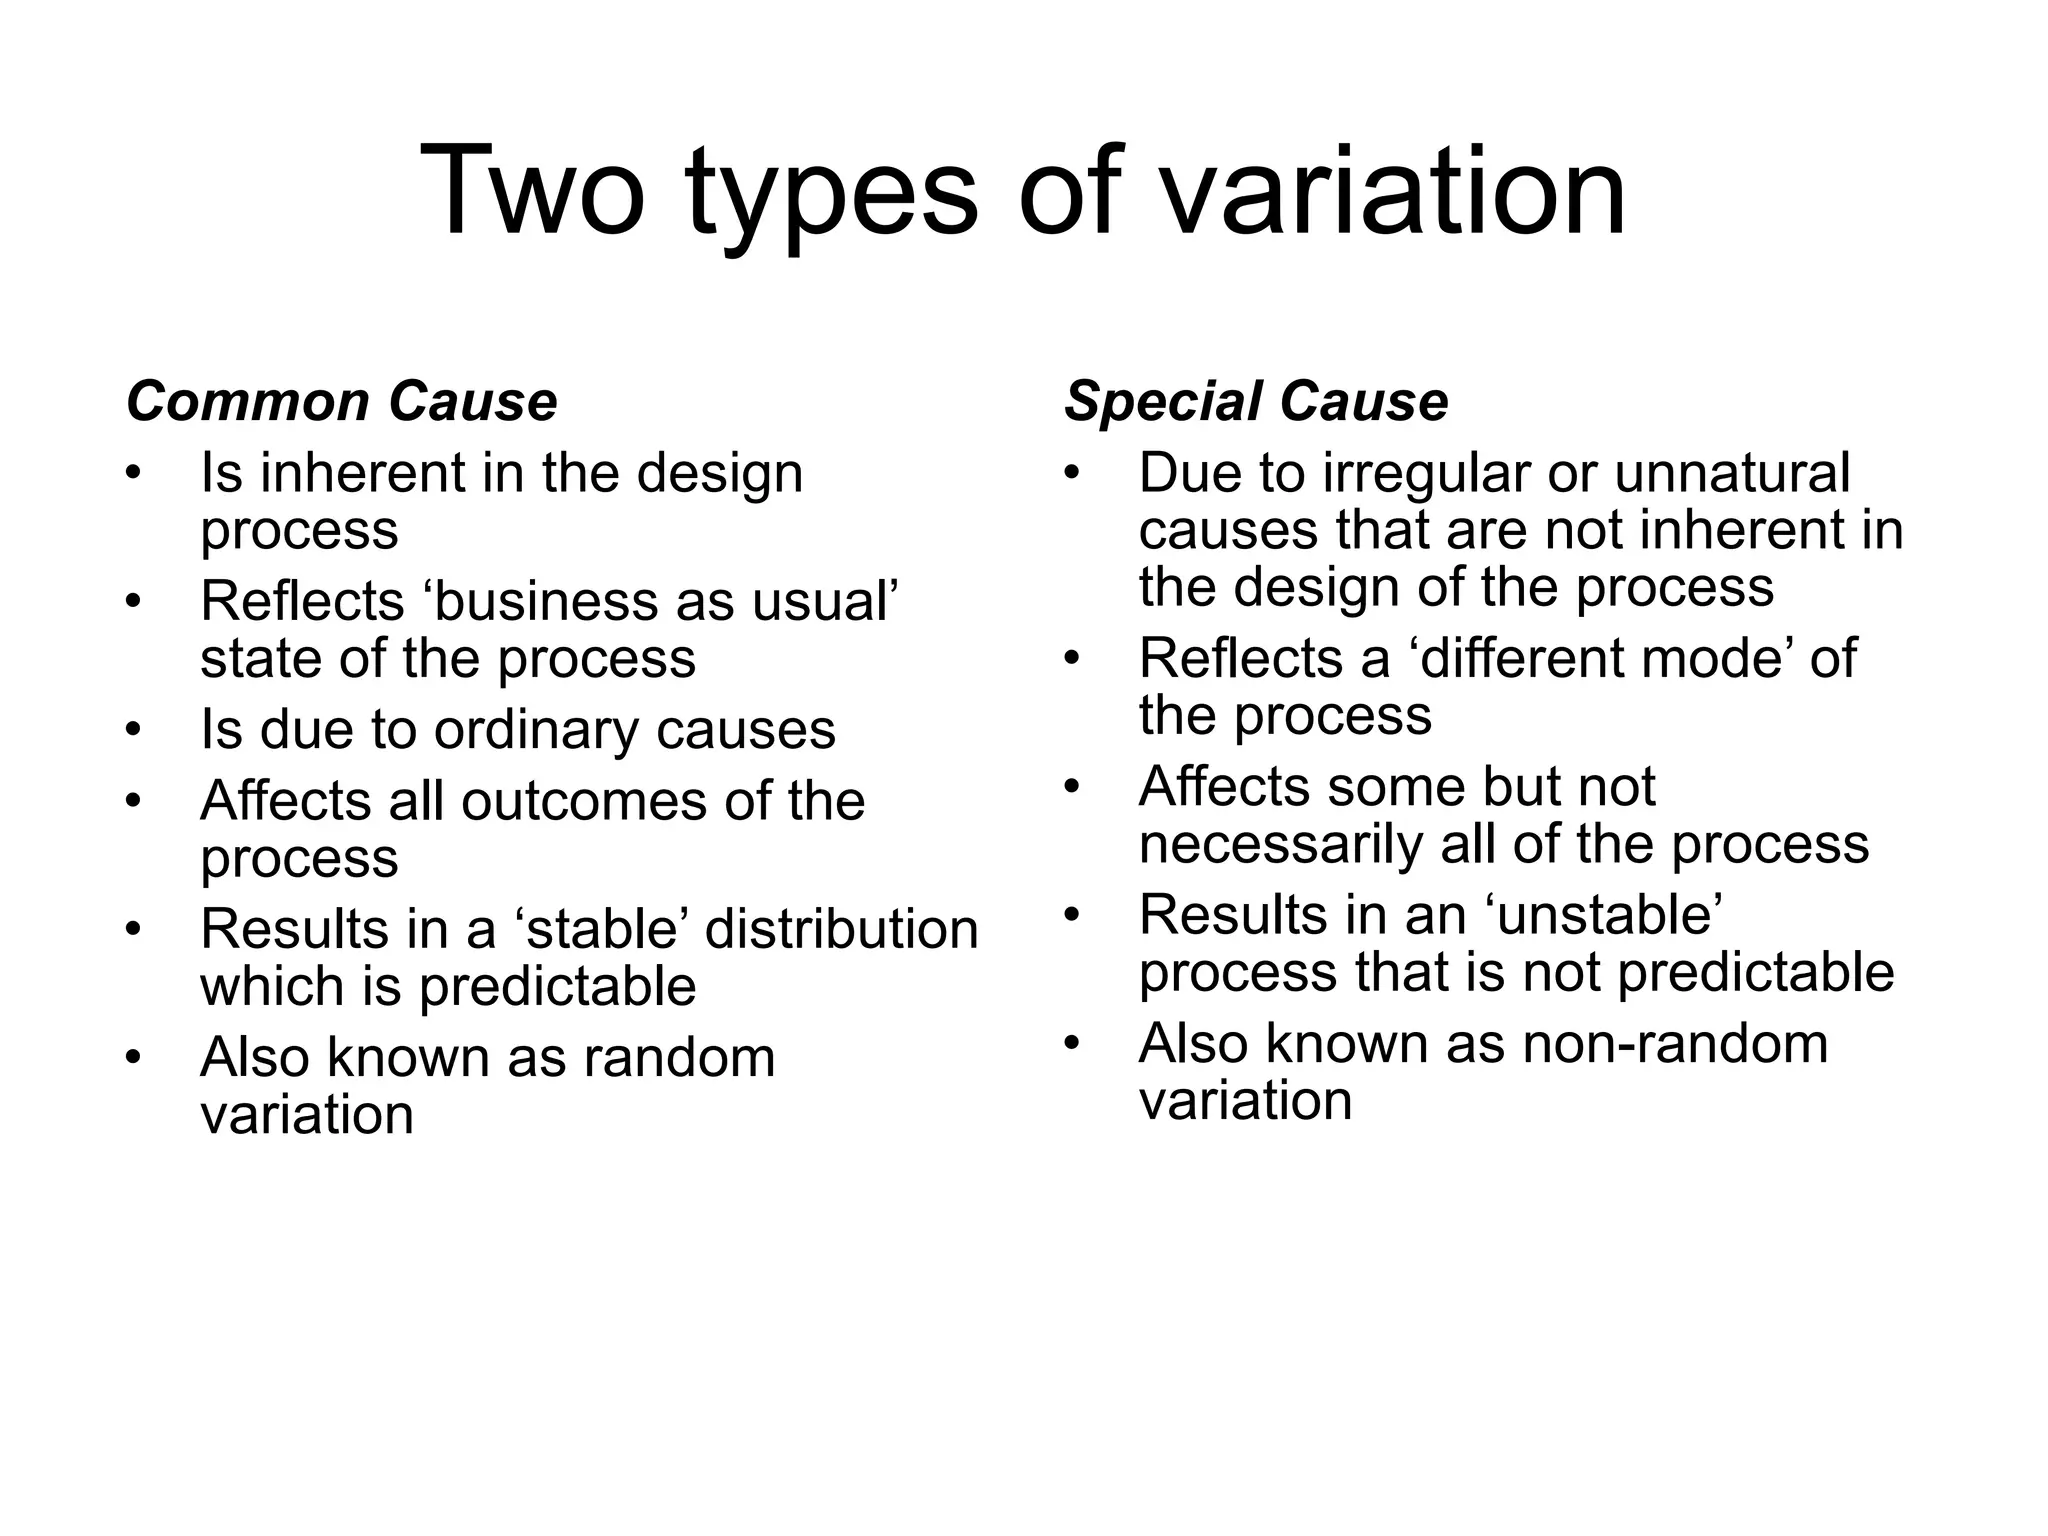
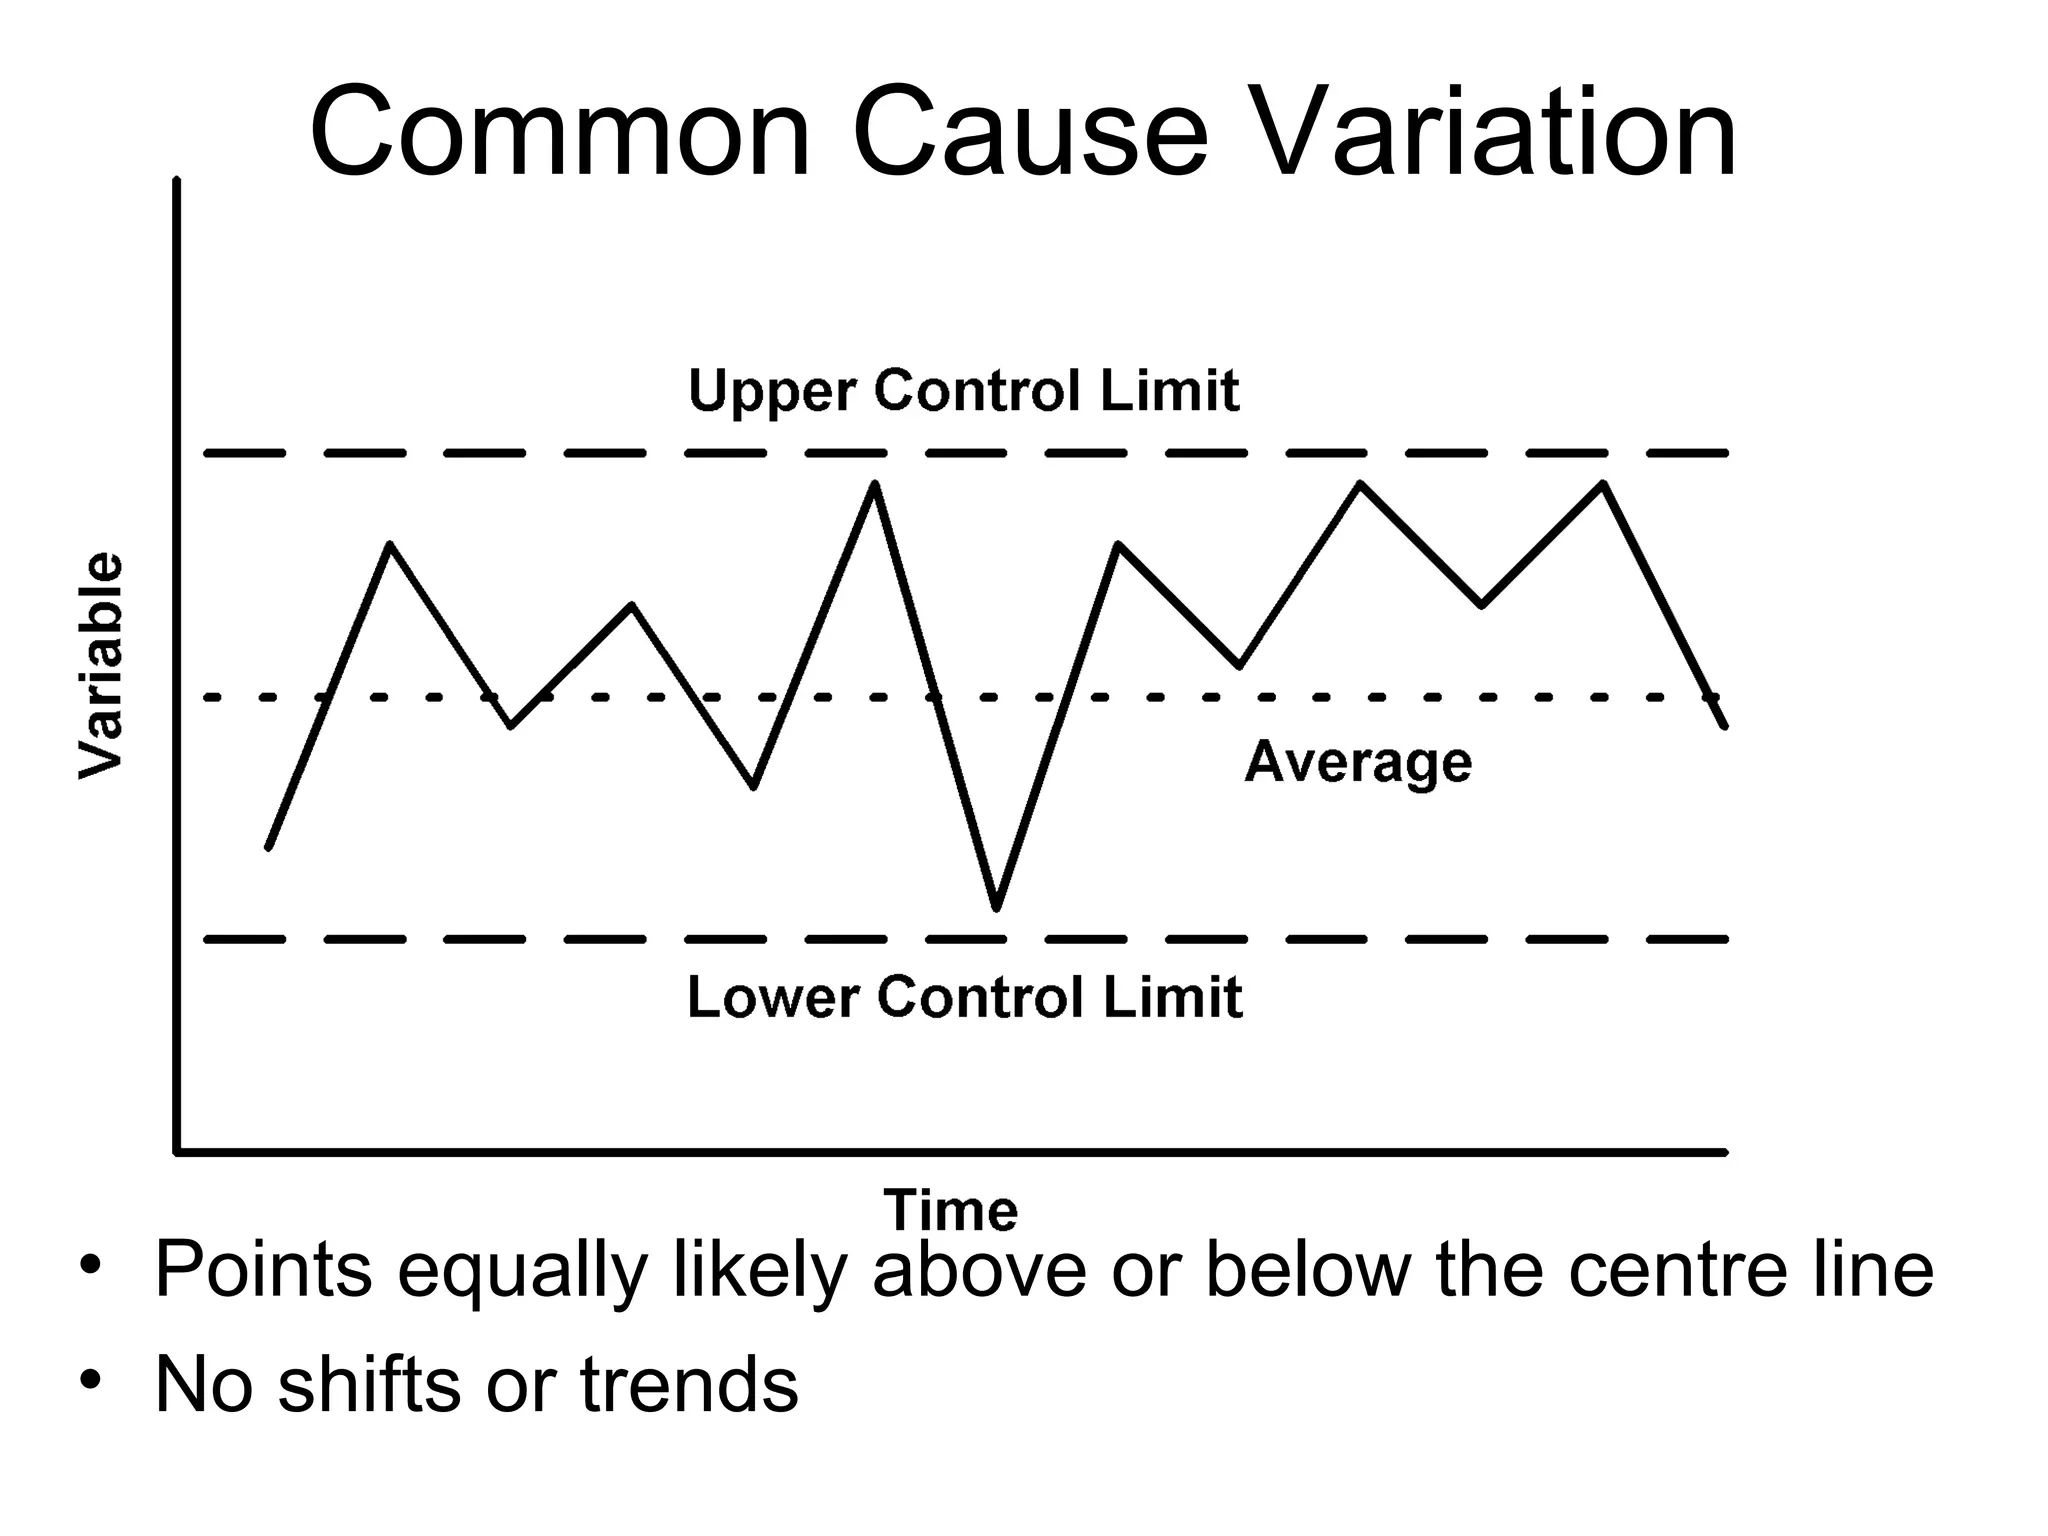
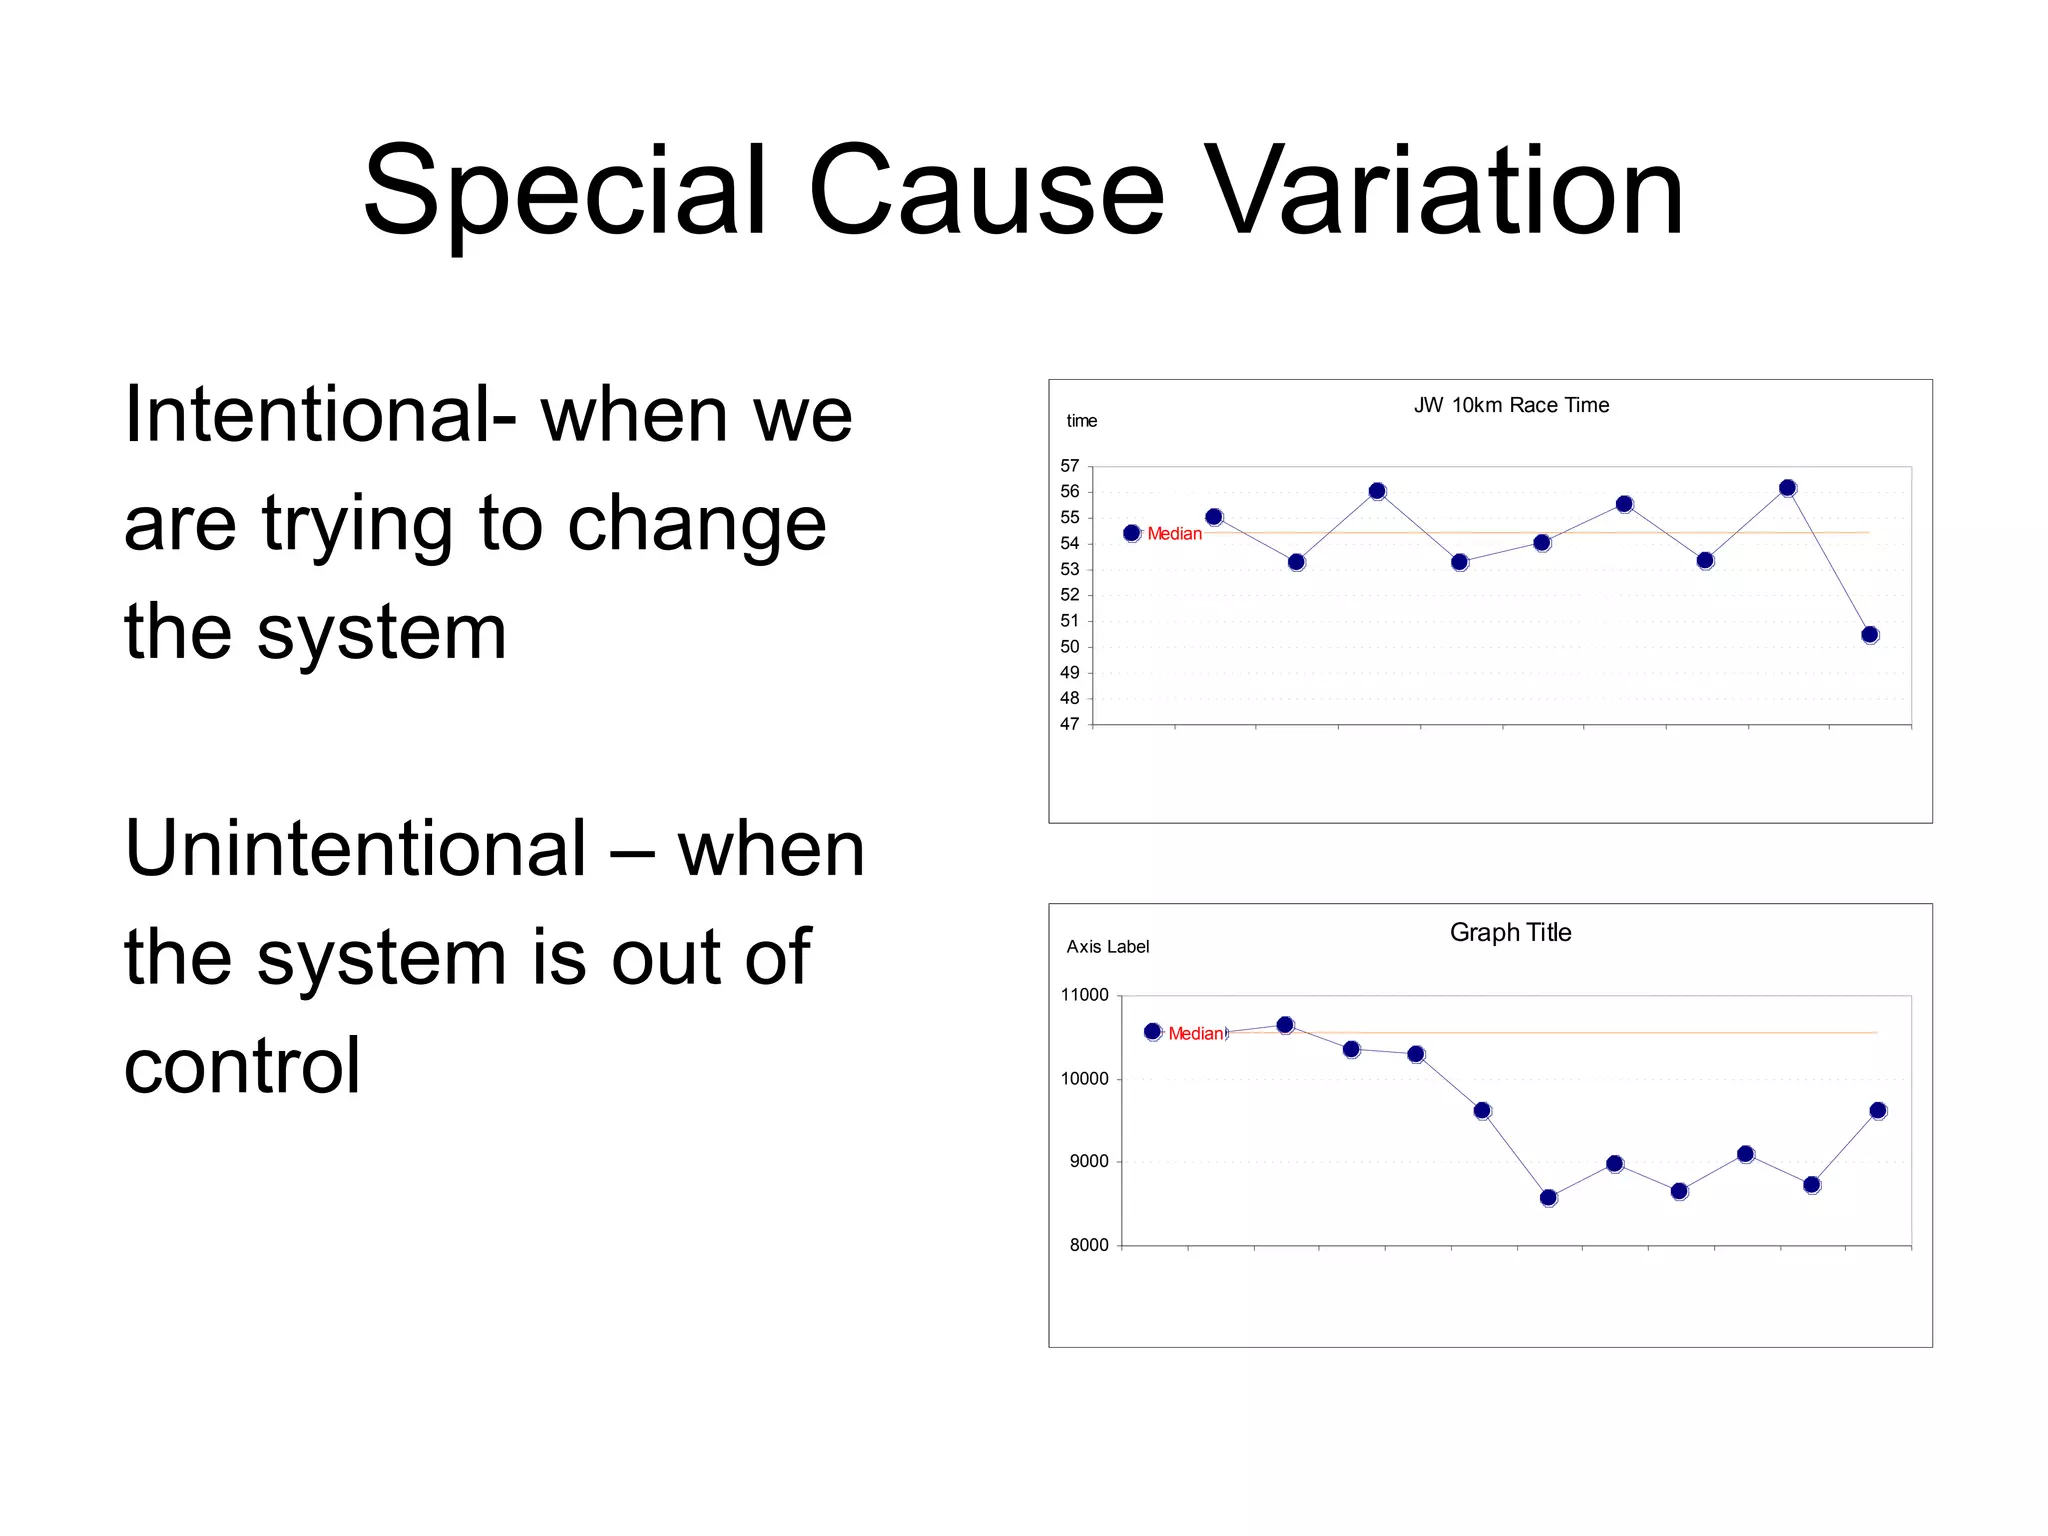
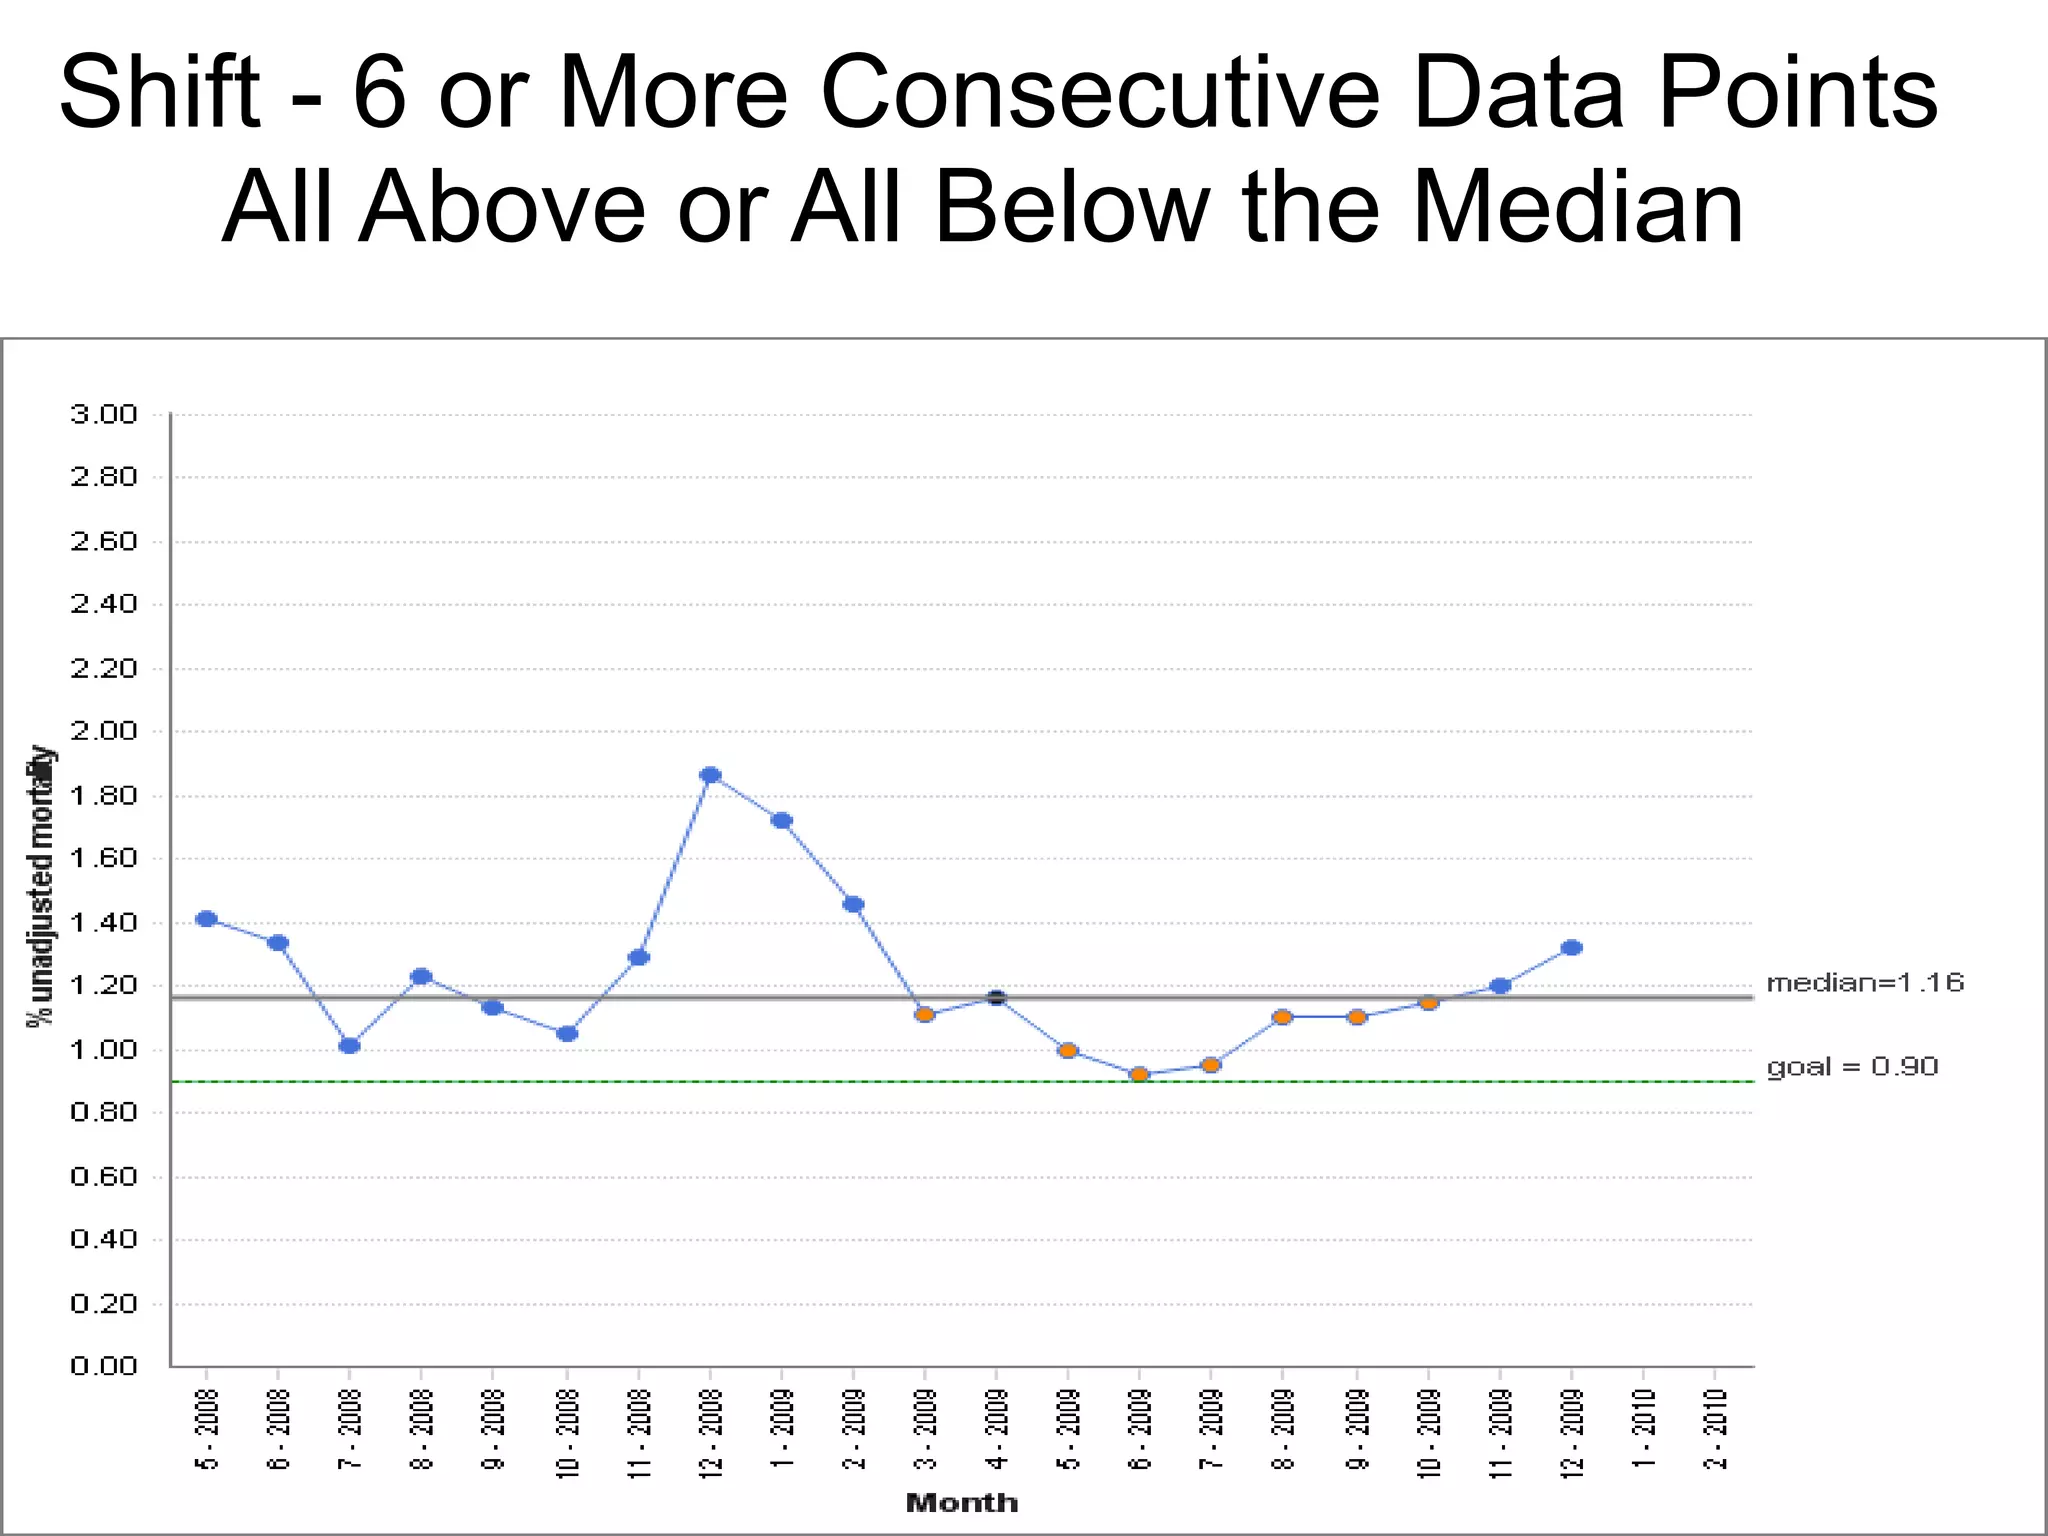
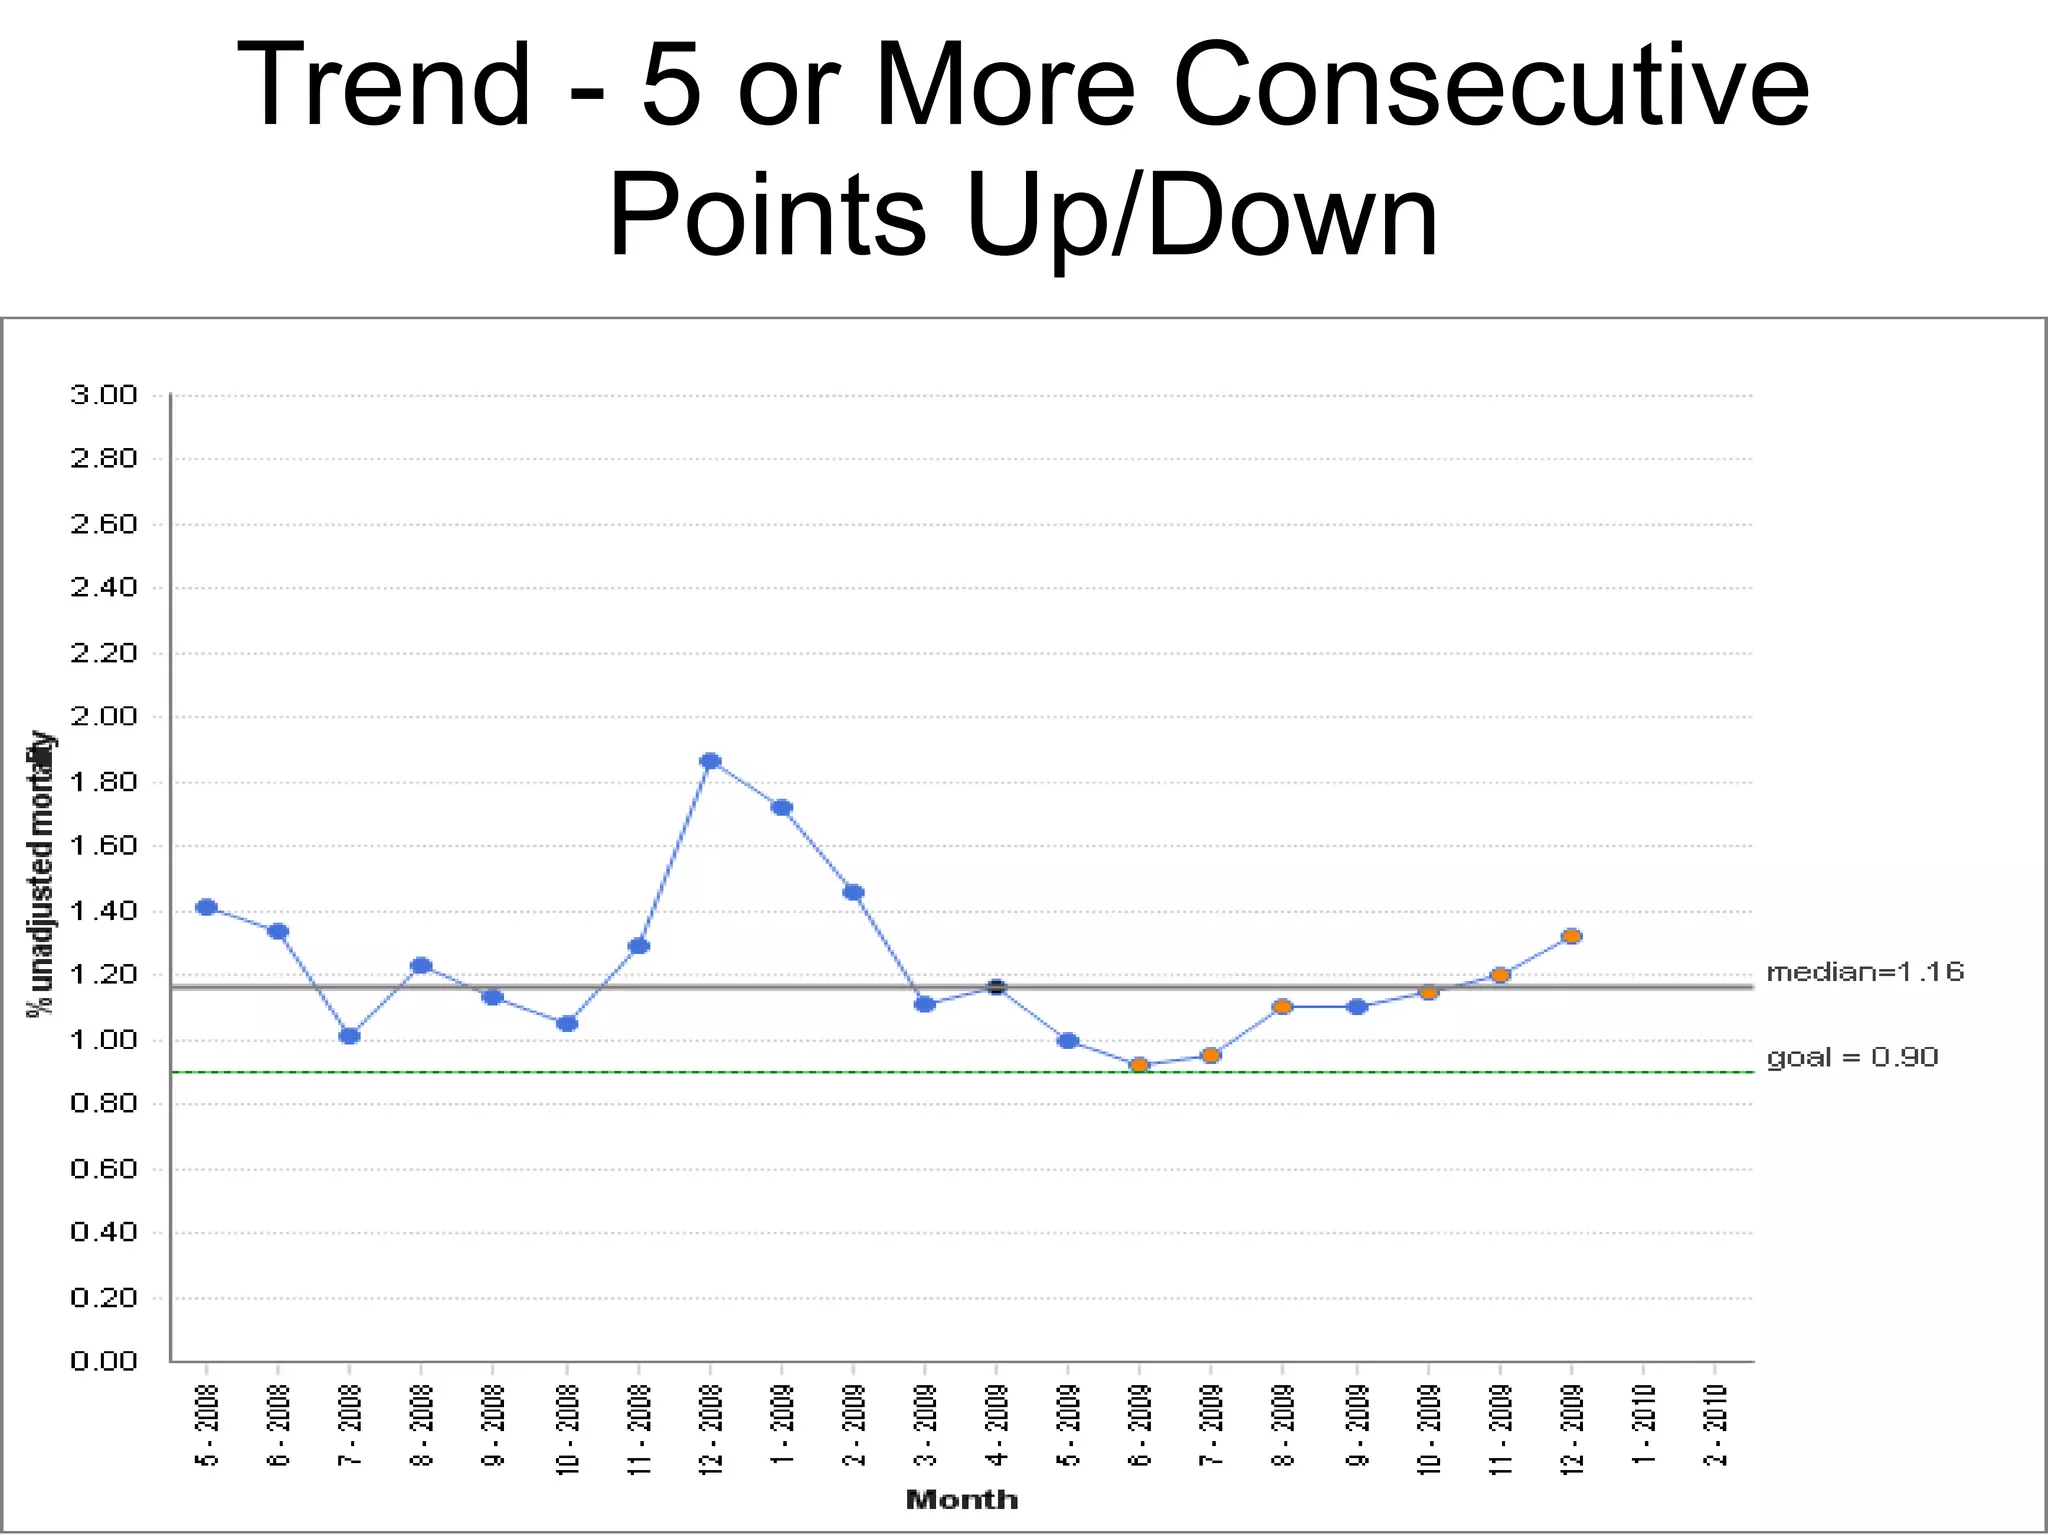
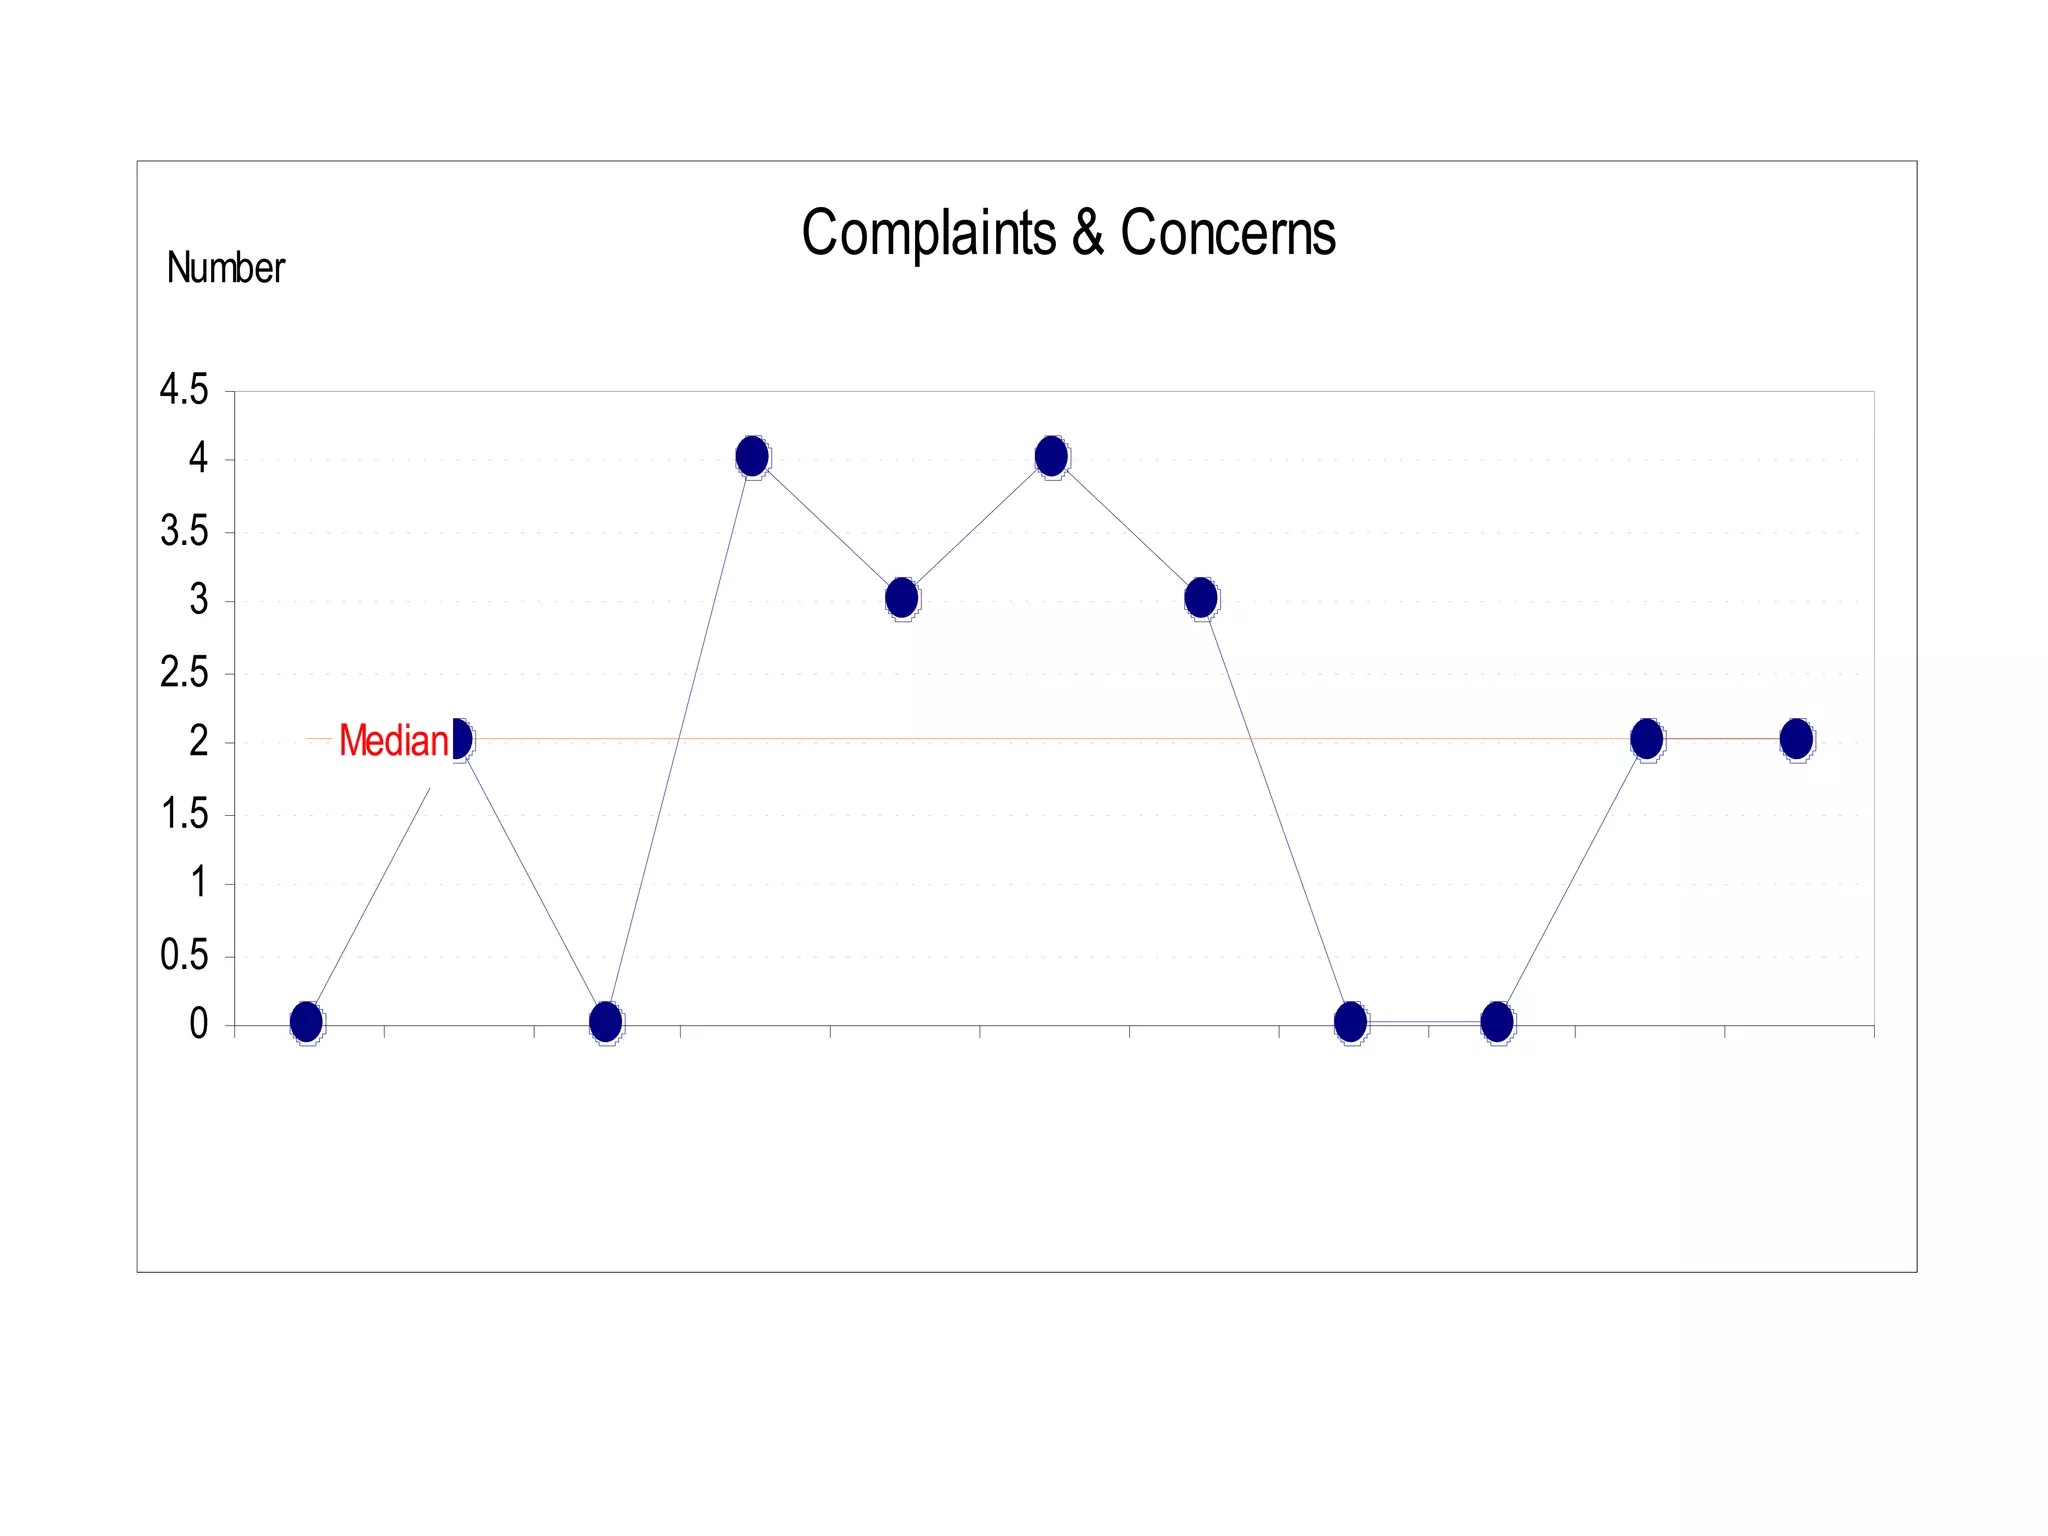
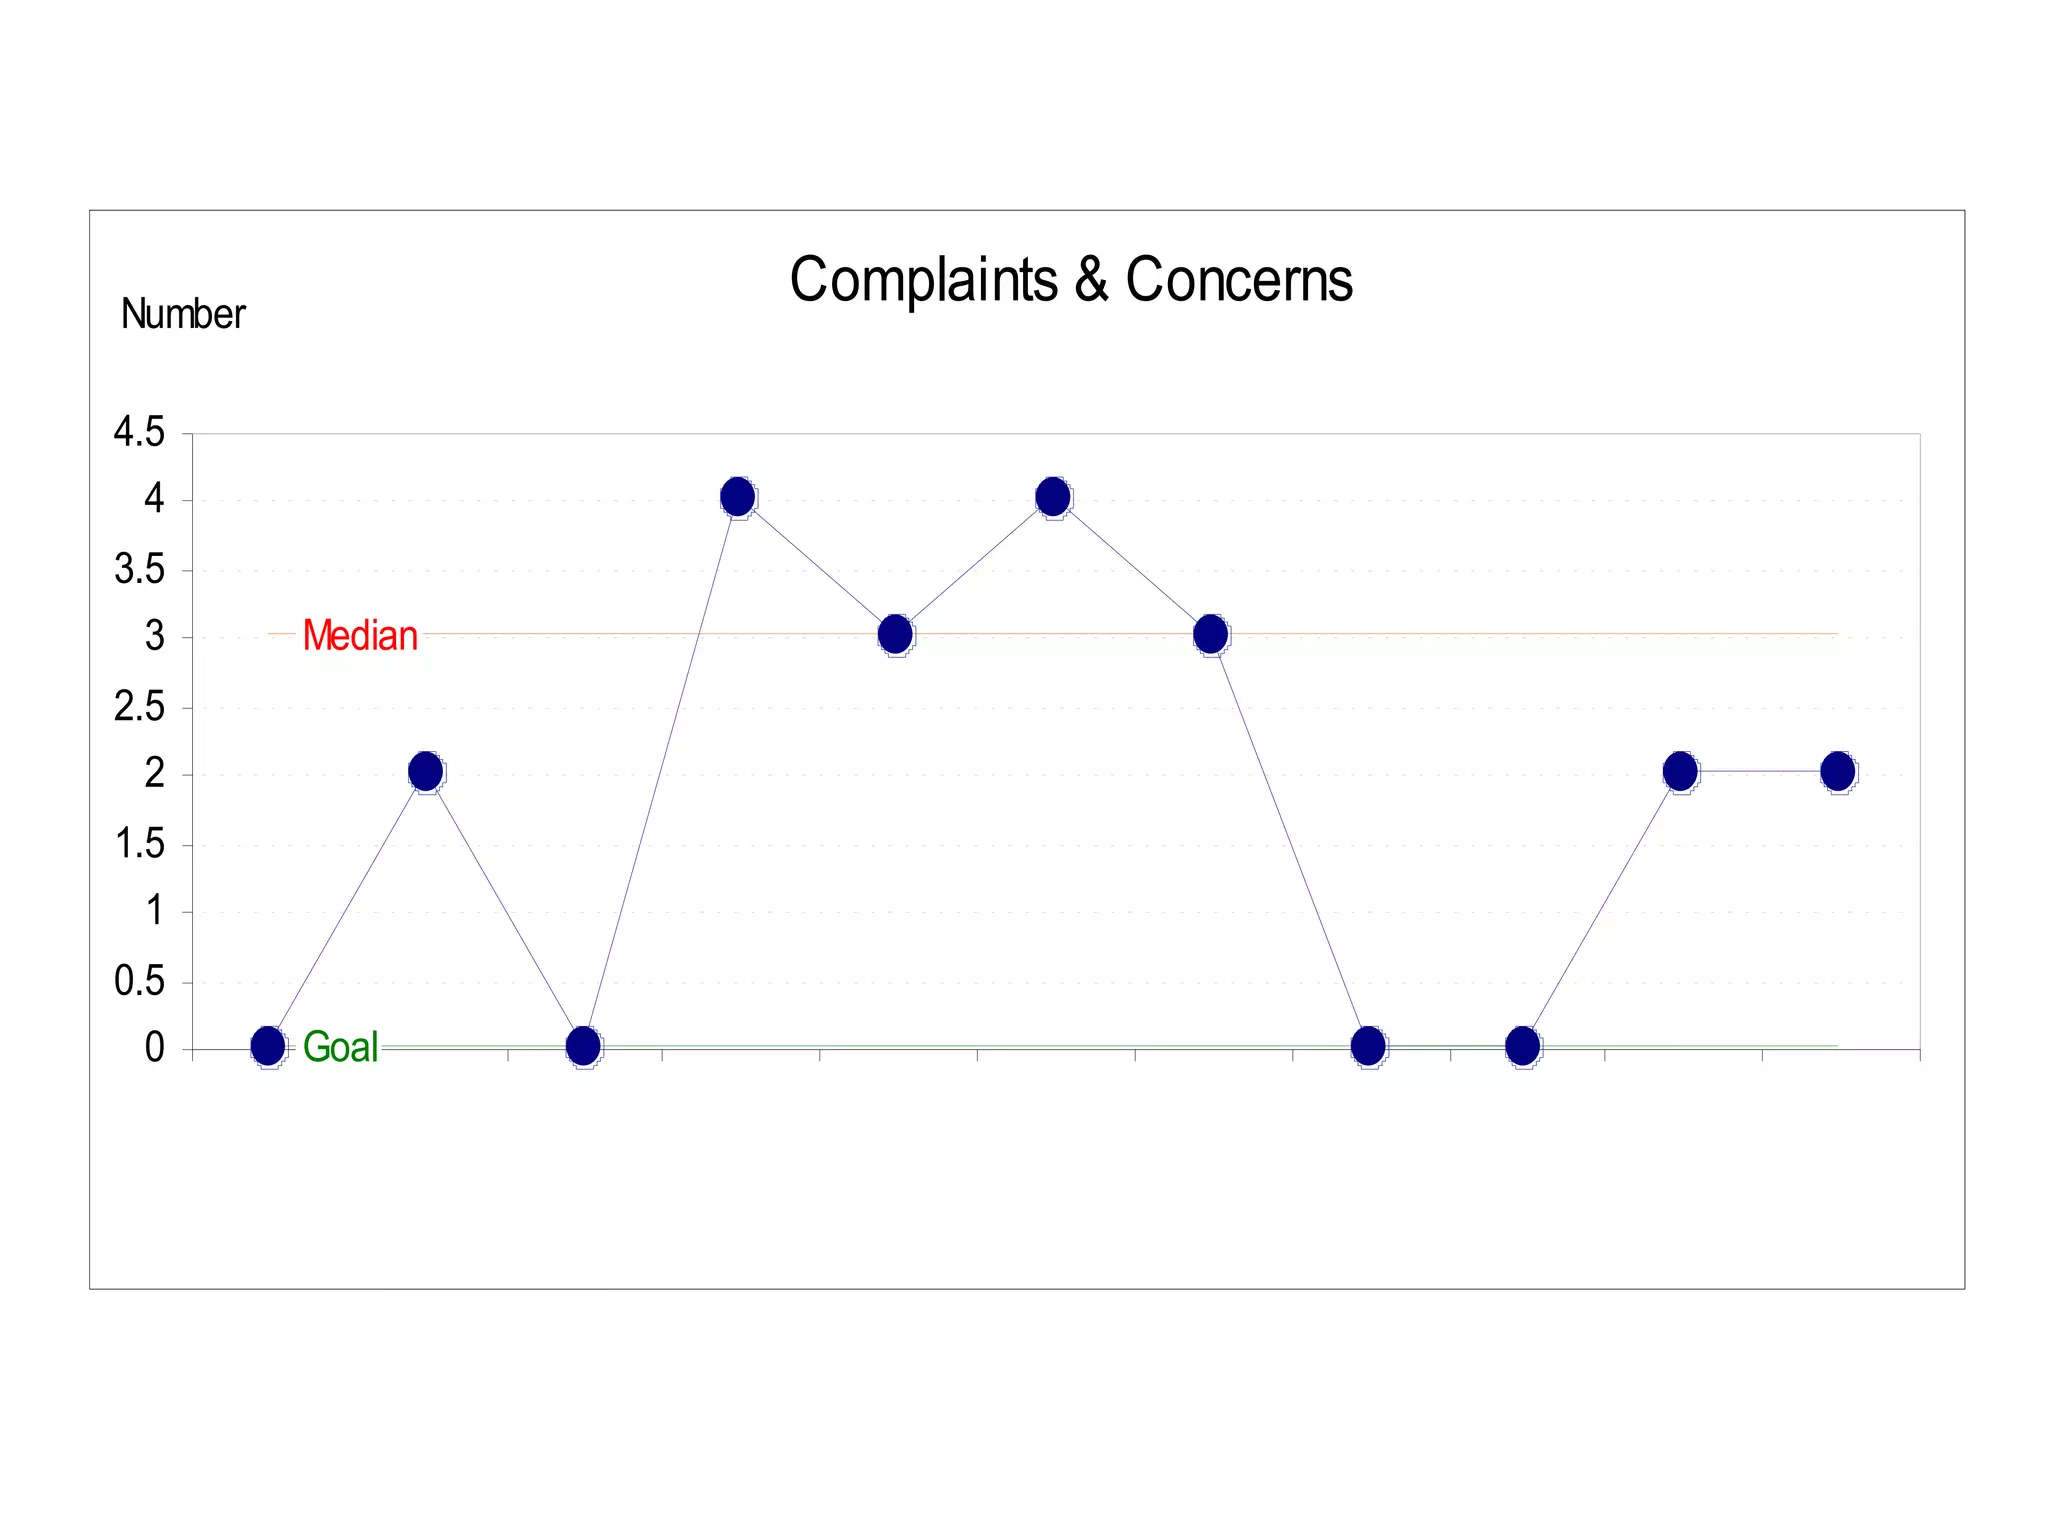
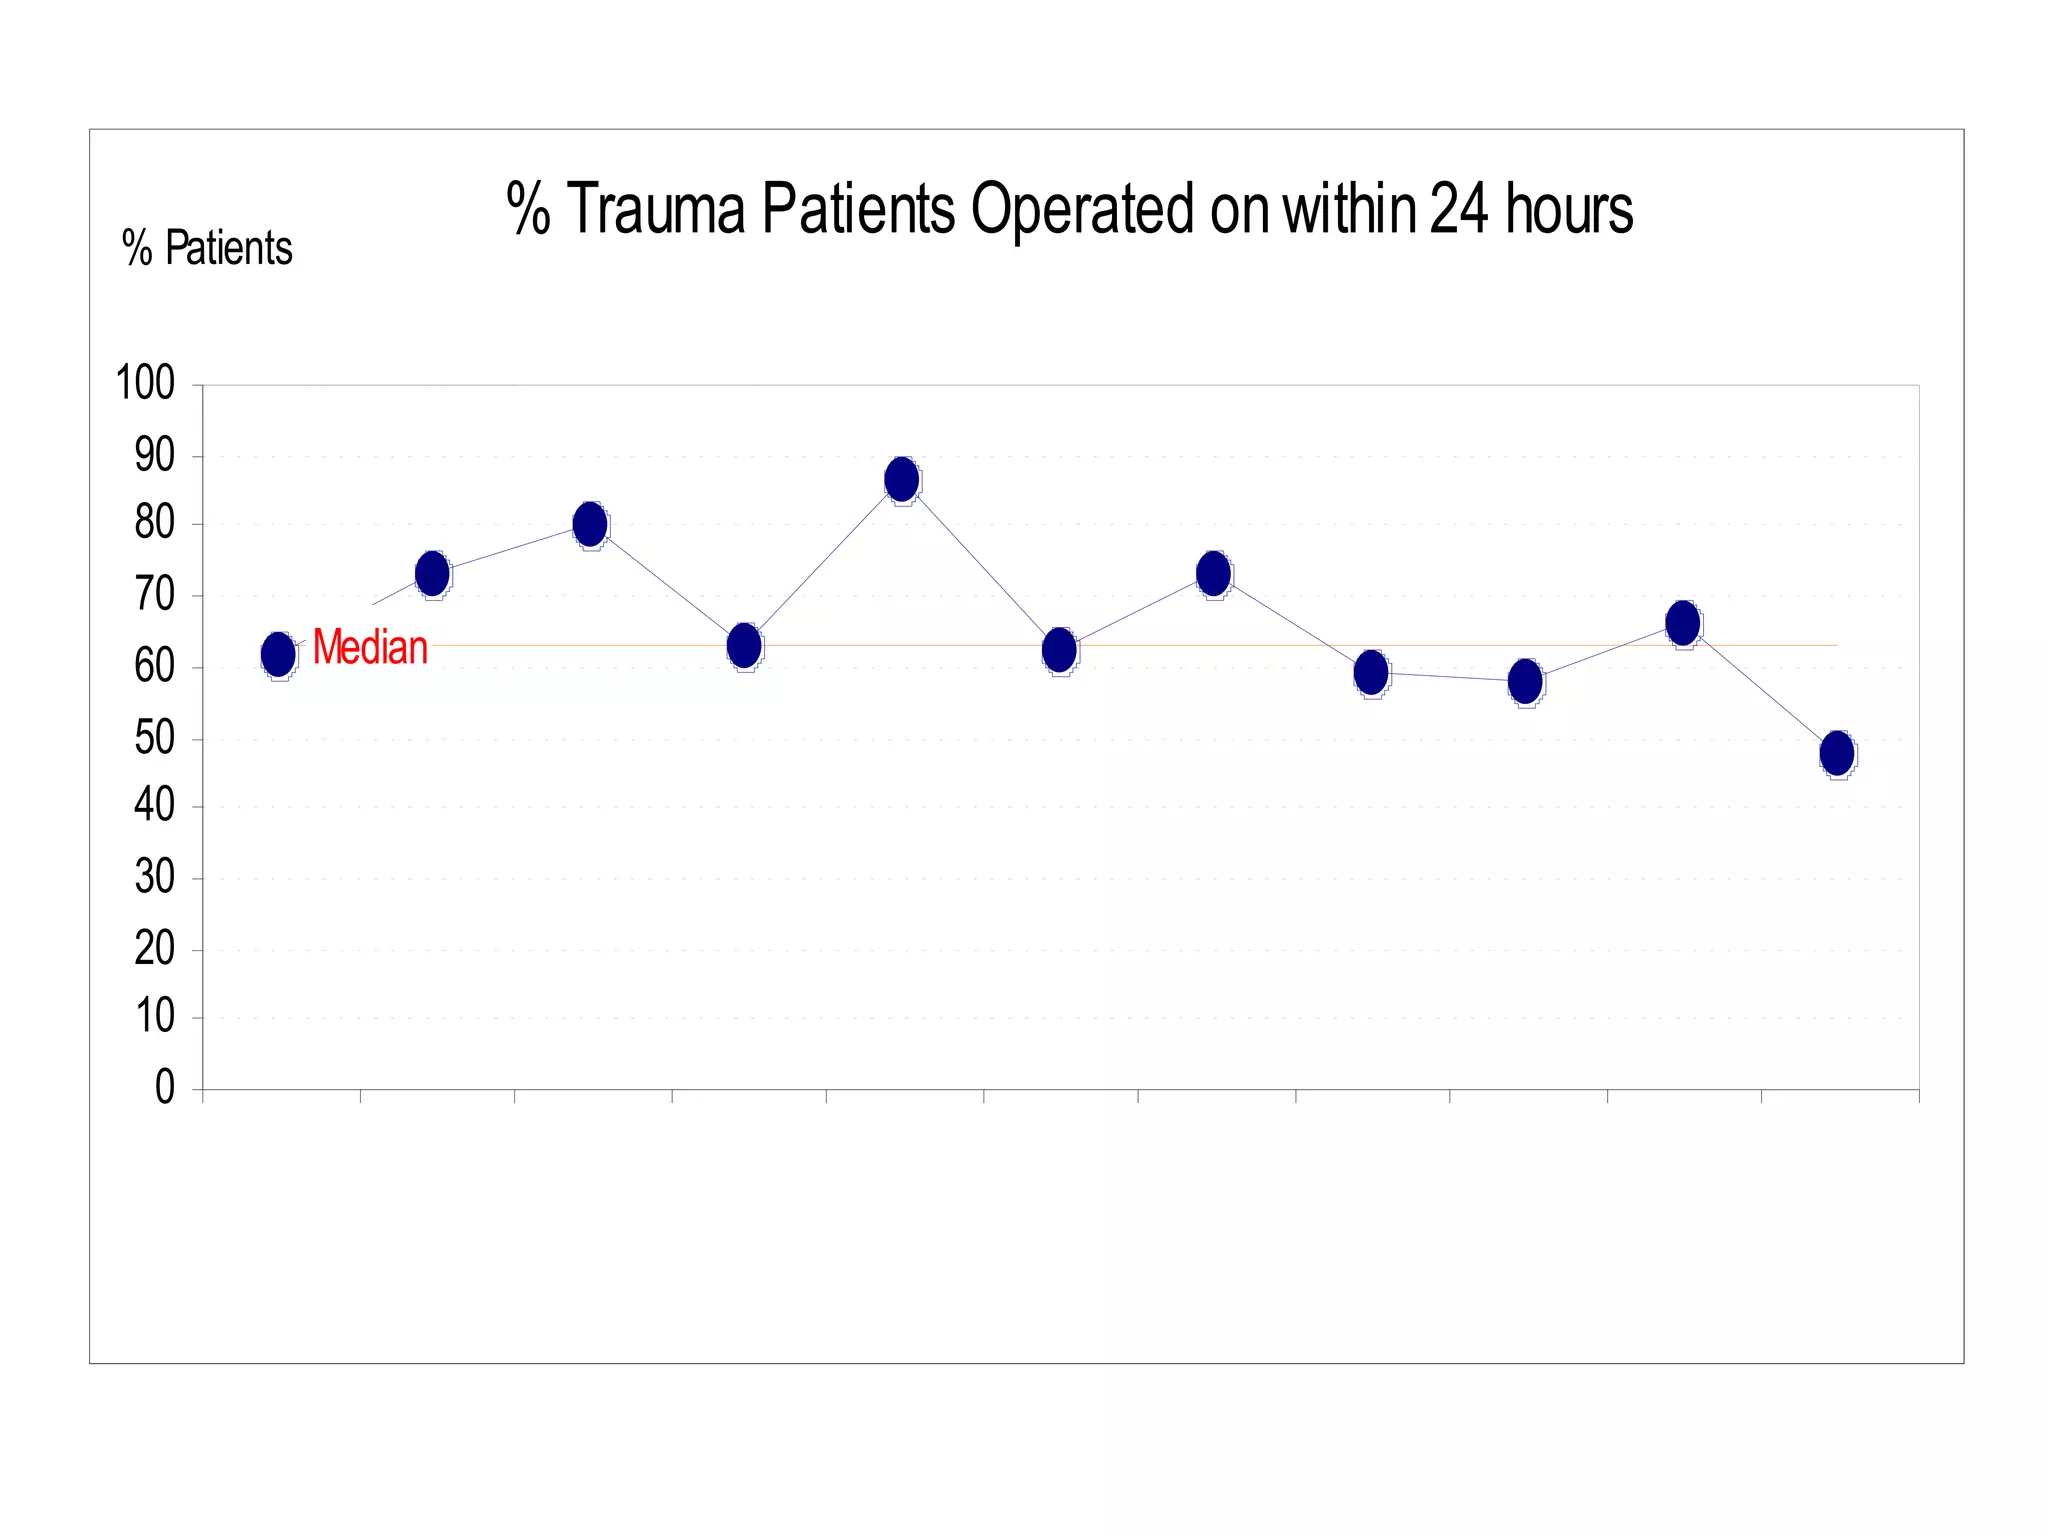
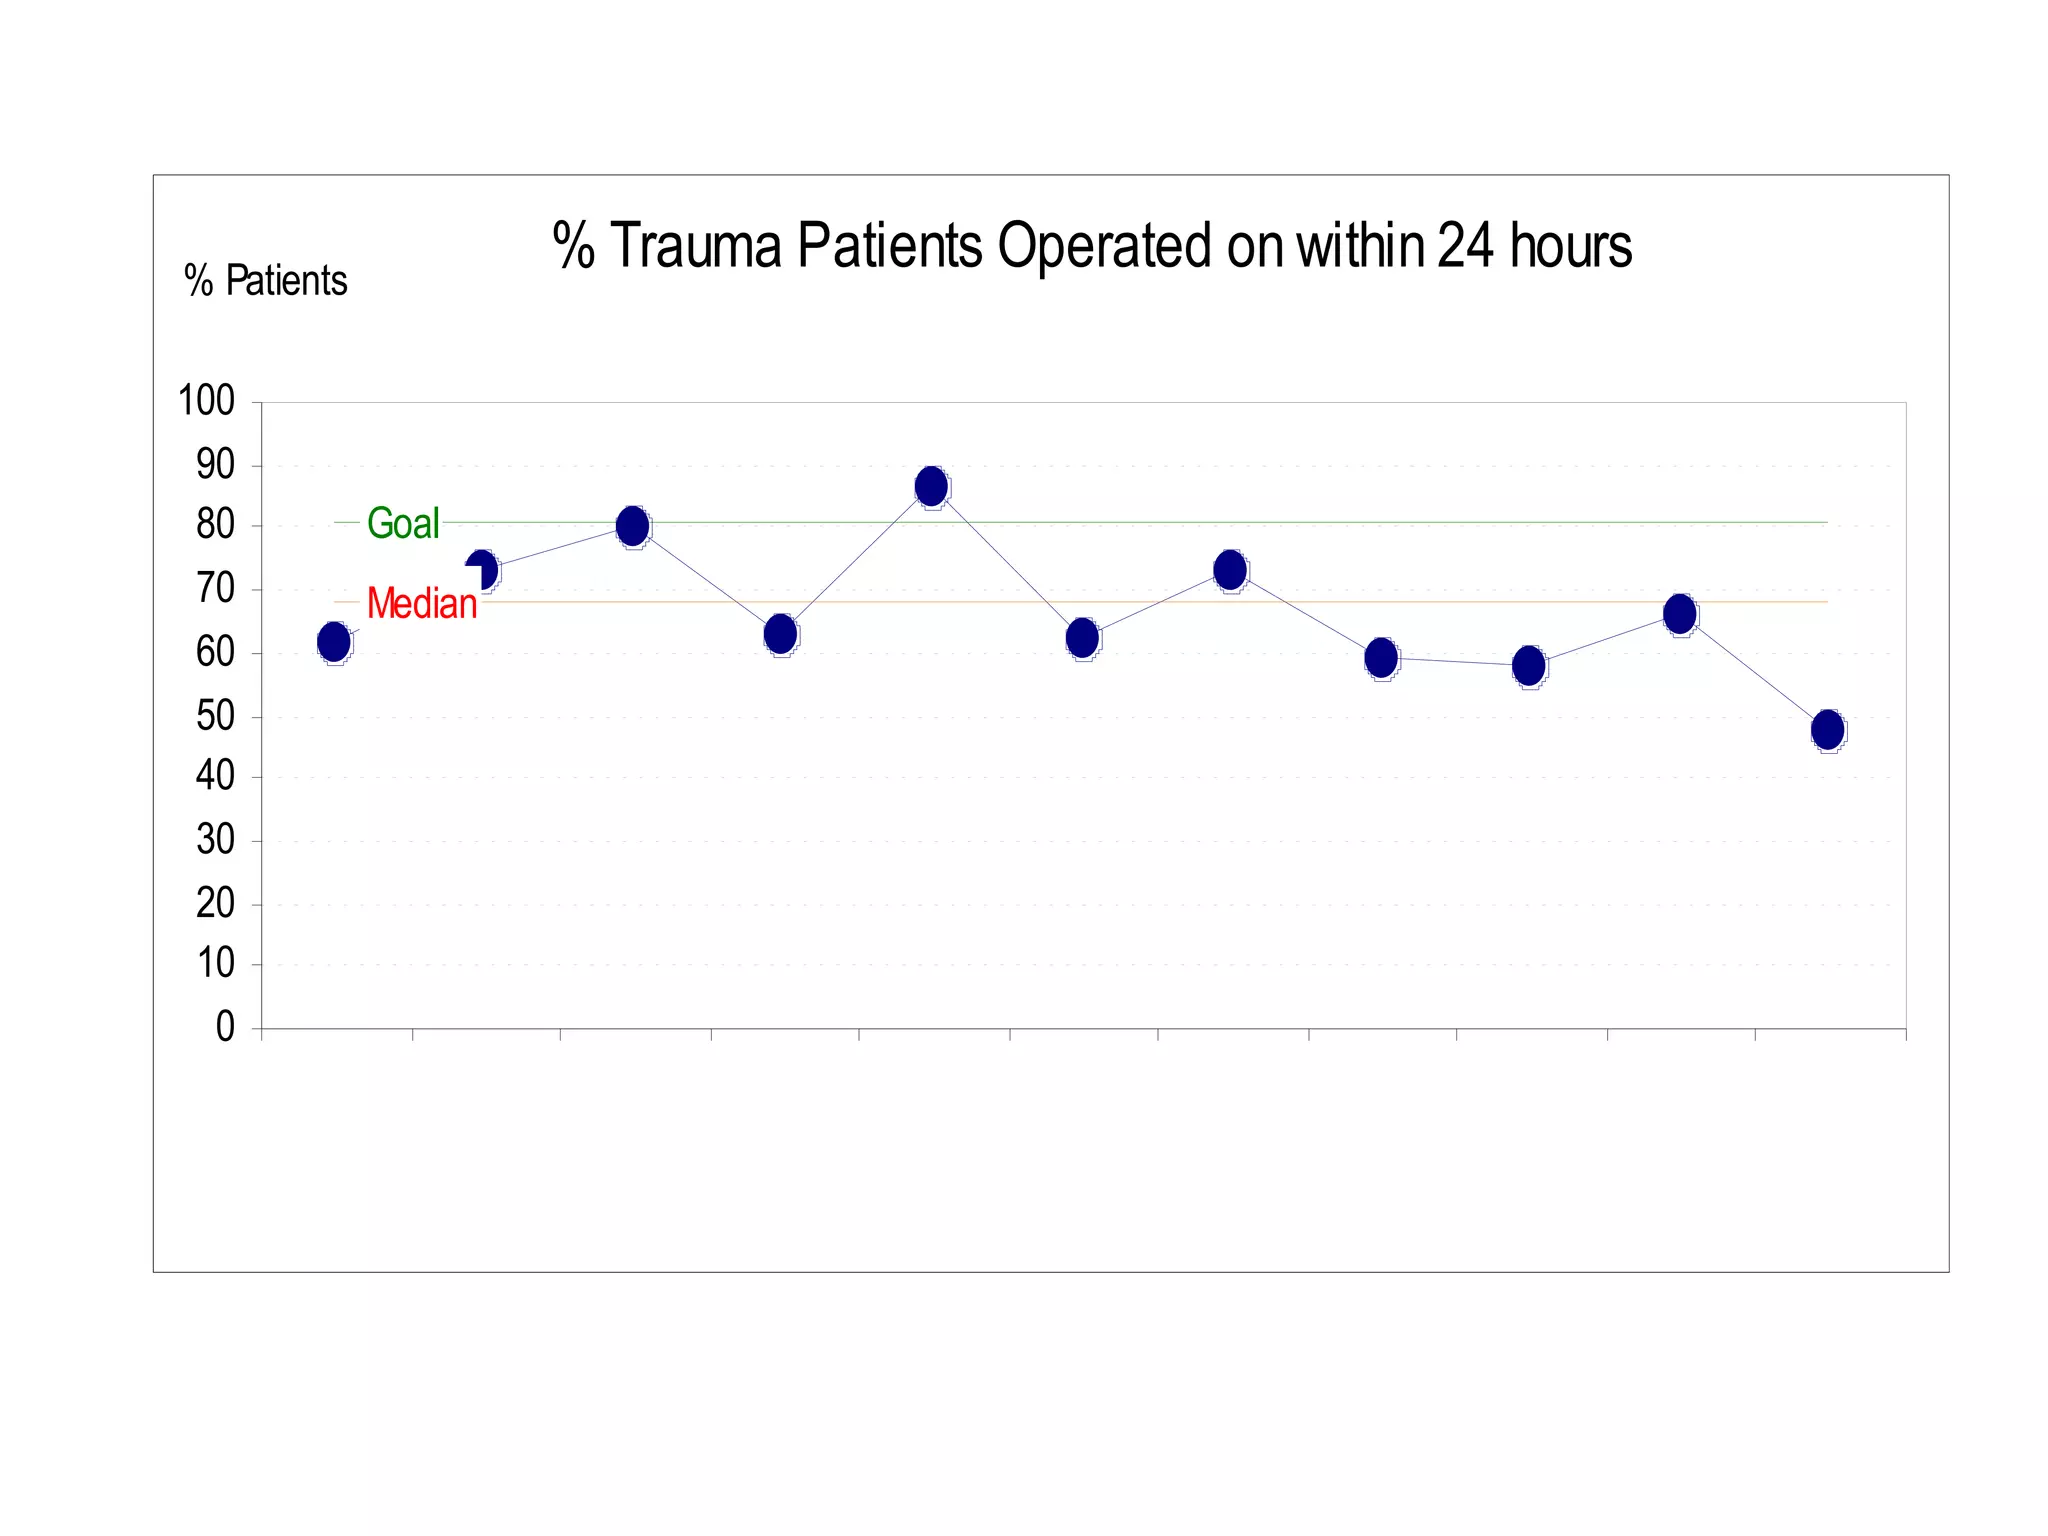
Theory Burst Using Your Data for Real Joanne Watson Faculty member The Hospital Pathways Programme A partnership between  The King’s Fund Point of Care and The Health Foundation
Engaging Heart & Minds ‘ If you want to build a ship do not gather men together and assign tasks. Instead teach them the longing for the wide endless sea’.  (Saint Exupery, Little Prince)
Run Charts & the Principles of Statistical Process Control How do you know that a change is an improvement?
 
Data for Improvement, Accountability and Research in Health Care “ The Three Faces of Performance Measurement: Improvement, Accountability and Research.” Solberg, Leif I., Mosser, Gordon and McDonald, Susan  Journal on Quality Improvement .  March 1997, Vol.23, No. 3. Aspect Improvement Accountability Research Aim Improvement of care Comparison, choice, reassurance, spur for change New knowledge Methods: Test Observability Test observable No test, evaluate current performance Test blinded or controlled Bias Accept consistent bias Measure and adjust to reduce bias Design to eliminate bias Sample Size “ Just enough” data, small sequential samples Obtain 100% of available,  relevant data “ Just in case” data Flexibility of Hypothesis Hypothesis flexible, changes as learning takes place No hypothesis Fixed hypothesis Testing Strategy Sequential tests No tests One large test Determining if  a change is an improvement Run charts or Shewhart control charts No change focus Hypothesis, statistical  tests (t-test, F-test, chi square),  p-values Confidentiality of the data Data used only by those involved with improvement Data available for public consumption and review Research subjects’ identities protected
Clinical Research Study
Clinical Research Study Sample
Improvement  Study
Improvement  Study Sample
Two fundamental questions that data can help answer What will happen in the future? Why are things working as they are (or NOT)?
Cycle time results for units 1, 2 and 3
Cycle time results for units 1, 2 and 3 Unit 2 Unit 1 Unit 3 Unit 2
Dynamic View of a Process Run chart Tells the story over time Predicts the future Spread Centre Sequence
Control Chart Points equally likely above or below the centre line Shows different types of variation
Two types of variation Common Cause Is inherent in the design process Reflects ‘business as usual’ state of the process Is due to ordinary causes Affects all outcomes of the process Results in a ‘stable’ distribution which is predictable Also known as random variation Special Cause Due to irregular or unnatural causes that are not inherent in the design of the process Reflects a ‘different mode’ of the process Affects some but not necessarily all of the process Results in an ‘unstable’ process that is not predictable Also known as non-random variation
Common Cause Variation Points equally likely above or below the centre line No shifts or trends
Special Cause Variation Intentional- when we are trying to change  the system Unintentional – when the system is out of  control
Reading Run Charts What will happen in the future? Why are things working as they are (or NOT)?
Shift - 6 or More Consecutive Data Points All Above or All Below the Median
Trend - 5 or More Consecutive Points Up/Down
 
HPP


Using Data for Real

  • 1.
    Theory Burst UsingYour Data for Real Joanne Watson Faculty member The Hospital Pathways Programme A partnership between The King’s Fund Point of Care and The Health Foundation
  • 2.
    Engaging Heart &Minds ‘ If you want to build a ship do not gather men together and assign tasks. Instead teach them the longing for the wide endless sea’. (Saint Exupery, Little Prince)
  • 3.
    Run Charts &the Principles of Statistical Process Control How do you know that a change is an improvement?
  • 4.
  • 5.
    Data for Improvement,Accountability and Research in Health Care “ The Three Faces of Performance Measurement: Improvement, Accountability and Research.” Solberg, Leif I., Mosser, Gordon and McDonald, Susan Journal on Quality Improvement . March 1997, Vol.23, No. 3. Aspect Improvement Accountability Research Aim Improvement of care Comparison, choice, reassurance, spur for change New knowledge Methods: Test Observability Test observable No test, evaluate current performance Test blinded or controlled Bias Accept consistent bias Measure and adjust to reduce bias Design to eliminate bias Sample Size “ Just enough” data, small sequential samples Obtain 100% of available, relevant data “ Just in case” data Flexibility of Hypothesis Hypothesis flexible, changes as learning takes place No hypothesis Fixed hypothesis Testing Strategy Sequential tests No tests One large test Determining if a change is an improvement Run charts or Shewhart control charts No change focus Hypothesis, statistical tests (t-test, F-test, chi square), p-values Confidentiality of the data Data used only by those involved with improvement Data available for public consumption and review Research subjects’ identities protected
  • 6.
  • 7.
  • 8.
  • 9.
  • 10.
    Two fundamental questionsthat data can help answer What will happen in the future? Why are things working as they are (or NOT)?
  • 11.
    Cycle time resultsfor units 1, 2 and 3
  • 12.
    Cycle time resultsfor units 1, 2 and 3 Unit 2 Unit 1 Unit 3 Unit 2
  • 13.
    Dynamic View ofa Process Run chart Tells the story over time Predicts the future Spread Centre Sequence
  • 14.
    Control Chart Pointsequally likely above or below the centre line Shows different types of variation
  • 15.
    Control Chart Pointsequally likely above or below the centre line Shows different types of variation
  • 16.
    Two types ofvariation Common Cause Is inherent in the design process Reflects ‘business as usual’ state of the process Is due to ordinary causes Affects all outcomes of the process Results in a ‘stable’ distribution which is predictable Also known as random variation Special Cause Due to irregular or unnatural causes that are not inherent in the design of the process Reflects a ‘different mode’ of the process Affects some but not necessarily all of the process Results in an ‘unstable’ process that is not predictable Also known as non-random variation
  • 17.
    Common Cause VariationPoints equally likely above or below the centre line No shifts or trends
  • 18.
    Special Cause VariationIntentional- when we are trying to change the system Unintentional – when the system is out of control
  • 19.
    Reading Run ChartsWhat will happen in the future? Why are things working as they are (or NOT)?
  • 20.
    Shift - 6or More Consecutive Data Points All Above or All Below the Median
  • 21.
    Trend - 5or More Consecutive Points Up/Down
  • 22.
  • 23.
  • 24.
  • 25.
  • 26.
  • 27.
  • 28.
  • 29.
  • 30.
  • 31.
  • 32.
  • 33.

Editor's Notes

  • #5 It is messy in there- sometimes mess is fun and sometimes it makes you nervous. Embrace it!
  • #6 The challenge-how do we start to use accountability data for improvement? Data for improvement, accountability and research are different Go thru slide We are focusing on harvesting learning from accountability data to help us with our improvement work
  • #19 First graph is the effect of training on JW 10 k race time whoopee! Second graph the Nikkei Index before & after 11 March 2011
  • #24 Apology- can’t format X axis correctly- won’t take % alone