The Hydrodynamic Performance Examination of a New Floating Breakwater Configu...
URC Poster
1. Tyler Haddock and Peter Wingate
Undergrad Researchers: Kaelin Chancey and Jamison Couture
Advisors: Professor Martin Wosnik, Professor Rob Swift, Ian Gagnon
Tidal Turbine Deployment Platform: Seakeeping and Safety
Background: The Living Bridge Project
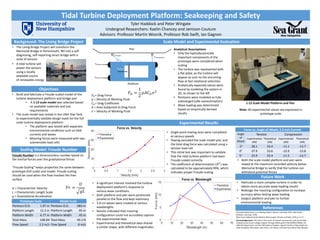
Future Work
Objectives
References
Scaling Model: Froude Number
Experimental Results
• The Living Bridge Project will transform the
Memorial Bridge in Portsmouth, NH into a self-
diagnosing, self-reporting smart bridge with a
suite of sensors
• A tidal turbine will
power the sensors
using a locally
available source
of renewable energy
Froude Number is a dimensionless number based on
the inertial forces over the gravitational forces
“Froude-Scaling” keeps properties the same between
prototype (full scale) and model. Froude scaling
should be used when the flow involves the free
surface
U = Characteristic Velocity
L = Characteristic Length Scale
g = Gravitational Acceleration
Prototype Scale Model Scale
Pontoon O.D. 1.07 m Pontoon O.D. .083 m
Platform Length 12.3 m Platform Length .95 m
Platform Width 6.77 m Platform Width .45 m
Total Mass 108 kN Total Mass 49.2 N
Flow Speed 2.2 m/s Flow Speed .6 m/s
Horizontal Wave Force on a Floating Object, Winzler and Kelly, 1979, after Brater,
McNown, and Stair, 1958.
Wave Force Adjustment for Relative Body Length, Winzler and Kelly, 1979, p. III-17
• Build and fabricate a Froude-scaled model of the
turbine deployment platform and bridge pier
• A 1:13 scale model was selected based
on available materials and size
requirements
• The scale model was tested in the UNH Tow Tank
to experimentally validate design loads for the full
scale turbine deployment platform
• The platform was tested with expected
environmental conditions such as tidal
currents and waves
• Mooring forces were measured with two
submersible load cells
Acknowledgements: This work is the result of research sponsored in part by the New
Hampshire Sea Grant College Program through NOAA grant # NA10OAR4170082, the
UNH ME Department, and the UNH Marine Program. Special thanks to Toby Dewhurst,
Scott Campbell, Paul Lavoie, John Ahern, Jim Abare, and Hard Core Spiral Tube Winders.
Scale Model and Experimental Evaluation
1:13 Scale Model Platform and Pier
• Fabricate a more complex turbine in order to
obtain more accurate wave loading results
• Redesign the mooring configuration to increase
accuracy when testing wave loading
• Subject platform and pier to further
environmental loading
𝐹 𝐷 =
1
2
𝜌𝐴𝐶 𝐷 𝑣2
𝐹𝑟 =
𝑈
𝑔𝐿
𝐹 𝐷= Drag Force
𝜌 = Density of Working Fluid
𝐶 𝐷= Drag Coefficient
A = Area Subjected to Drag Force
𝑣 = Velocity of Working Fluid
Analytical Assumptions
• Only the hydrodynamically
important components of the
prototype were considered when
scaling
• The turbine was represented with
a flat plate, as the turbine will
appear as such to the oncoming
flow at fast rotational velocities
• Analytically expected values were
found by modeling the system in
2D, as shown to the left
• Pontoons were modeled as fully
submerged (safe overestimation)
• Wave loading was determined
based on empirically derived
results
• Single point towing tests were completed
at various speeds
• Towing excluded the scale model pier, and
the total drag force was calculated using a
tension load cell
• This initial test was important to validate
that the tidal turbine platform had been
Froude-scaled correctly
• The coefficient of determination (𝑅2
) was
calculated to be approximately 99%, which
indicates proper Froude-scaling
• A significant interest involved the turbine
deployment platform’s response to
various wave conditions
• Both platform and pier were positioned
parallel to the flow and kept stationary
• 5.8 cm waves were created at various
wavelengths
• Results indicated that mooring
configuration could not accurately capture
the experimental data
• Experimental and theoretical data shared
a similar shape, with different magnitudes
Force vs. Angle of Attack, 2.2 m/s Current
Angle
of
Attack
Tension Compression
Experimental
(kN)
Theoretical
(kN)
Experimental
(kN)
Theoretical
(kN)
-5° 28.1 33.4 -11.1 -13.7
0° 27.9 33.6 -12.0 -13.8
5° 25.9 33.4 -11.5 -13.7
• Both the scale model platform and pier were
towed at the maximum recorded velocity below
Memorial Bridge to verify that the turbine can
withstand potential forces
Note: All experimental values are expressed in
prototype scale