Download as PDF, PPTX
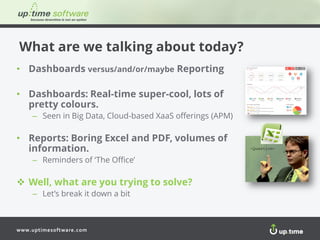
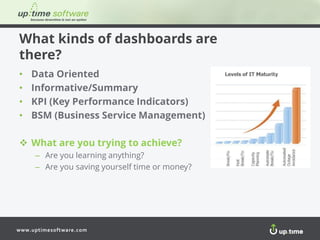
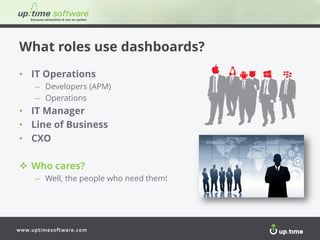
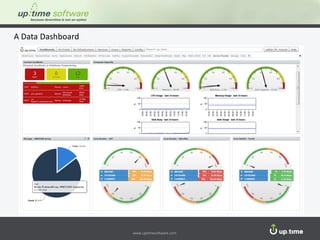
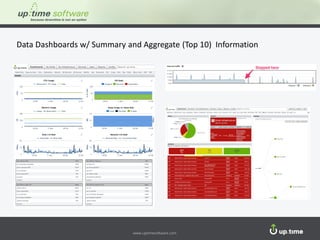
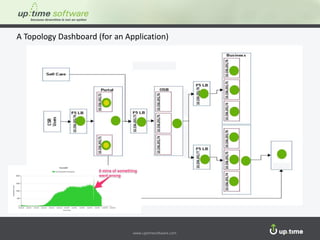
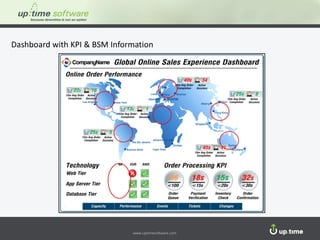
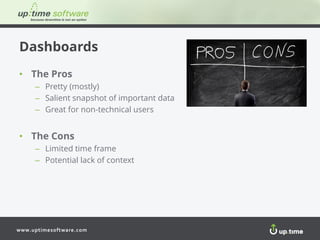
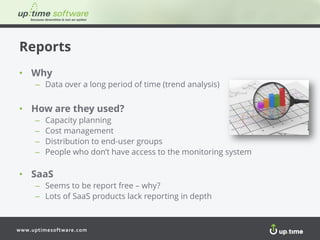
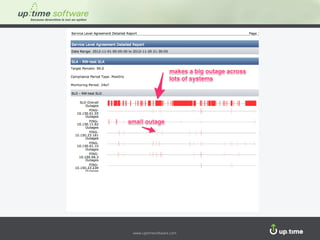
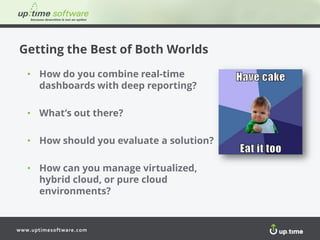
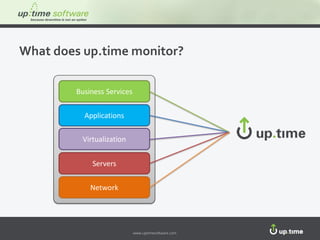

The document discusses the differences between dashboards and reports for IT monitoring. Dashboards provide a real-time snapshot with visualizations and KPIs, while reports contain more in-depth historical data over long periods of time. Both are useful - dashboards for operations teams to monitor current performance, and reports for capacity planning, cost analysis, and distribution to non-technical teams. An effective monitoring solution combines real-time dashboards with deep reporting capabilities to support all user roles.


