University technology transfer success chart, normalized by Michael Odza (2000)
•
1 like•132 views

Michael Odza developed this approach to quantifying the relative success of the technology licensing offices of universities to put smaller schools on an even footing with larger research universities, for his newsletter Technology Access Report. It's not the only way to compare institutions, of course, but it was the first of its kind.
Recommended

Recommended
More Related Content
Similar to University technology transfer success chart, normalized by Michael Odza (2000)
Similar to University technology transfer success chart, normalized by Michael Odza (2000) (20)
Recently uploaded
Recently uploaded (20)
University technology transfer success chart, normalized by Michael Odza (2000)
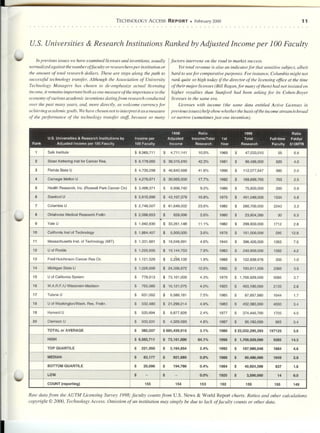
- 1. TECHNOLOGY ACCESS REPORT. February 2000 11 . . . . . . . . . . . . . . . . . . . . . . . . . . . . . . . . . . . . . . . . . . . . . . . . . . . . . . . . . . . . . . . . u.s. Universities &Research Institutions Ranked by Adjusted Income per 100 Faculty In previous issues we have examined licenses and inventions, usually normalized against the number offaculty or researchers per institution or the amount of total research dollars. These are steps along the path to successful technology transfer. Although the Association of University Technology Managers has chosen to de-emphasize actual licensing income, it remains important both as one measure of the importance to the economy of various academic inventions dating from research conducted over the past many years, and; more directly, as welcome currency for achieving academic goals. We have chosen not to interpret it as a measure of the performance of the technology transfer staff, because so many factors intervene on the road to market success. Yet total revenue is also an indicatorfor that sensitive subject, albeit hard to usefor comparative purposes. For instance, Columbia might not rank quite so high today if the director of the licensing office at the time of their major licenses (Bill Ragan,for many of them) had not insisted on higher royalties than Stanford had been asking for its Cohen-Boyer licenses in the same era. Licenses with income (the same data entitled Active Licenses in previous issues) helpshow whether thebasis ofthe incomestream isbroad or narrow (sometimesjust one invention). Raw data from the AUTM Licensing Survey 1998; faculty counts from u.s. News & World Report charts. Ratios and other calculations copyright @2000, Technology Access. Omission of an institution may simply be due to lack offaculty counts or other data. 1998 Ratio 1998 Ratio U.S. Universities & Research Institutions by Income per Adjusted Income/Total 1st Total Full-time PatApl Rank Adjusted Income per 100 Faculty 100 Faculty Income Research Year Research Faculty 510MTR 1 Salk Institute $ 8,565,711 $ 4,711,141 10.0% 1969 $ 47,033,010 55 6.8 2 Sloan Kettering Inst for Cancer Res. $ 6,179,985 $ 38,315,910 42.3% 1981 $ 90,486,000 620 4.0 3 Florida State U $ 4,735,298 $ 46,642,688 41.6% 1996 $ 112,077,647 985 2.0 4 Carnegie Mellon U $ 4,276,671 $ 30,065,000 17.7% 1992 $ 169,899,765 703 2.5 5 Health Research, Inc. (Roswell Park Cancer Ctr) $ 3,498,371 $ 6,996,742 9.2% 1986 $ 75,800,000 200 0.9 6 Stanford U $ 2,815,996 $ 43,197,379 10.8% 1970 $ 401,049,000 1534 5.8 7 Columbia U $ 2,748,507 $ 61,649,002 23.6% 1982 $ 260,700,000 2243 3.3 8 Oklahoma Medical Research Fndtn $ 2,096,653 $ 628,996 2.6% 1990 $ 23,804,380 30 6.3 9 YaieU $ 1,942,830 $ 33,261,148 11.1% 1982 $ 299,800,000 1712 2.8 10 California Inst of Technology $ 1,864,407 $ 5,500,000 3.6% 1978 $ 151,000,000 295 12.8 11 Massachusetts Ins!. of Technology (MIT) $ 1,331,881 $ 18,046,991 4.6% 1940 $ 396,400,000 1355 7.5 12 U of Florida $ 1,225,656 $ 19,144,753 7.9% 1983 $ 240,900,000 1562 4.2 13 Fred Hutchinson Cancer Res Ctr. $ 1,121,529 $ 2,299,135 1.9% 1988 $ 122,839,97? 205 1.0 14 Michigan State U $ 1,028,608 $ 24,336,872 12.6% 1992 $ 193,611,000 2366 3.5 15 U of California System $ 778,913 $ 73,101,000 4.3% 1979 $ 1,709,929,000 9385 3.7 16 W.A.R.F.lU Wisconsin-Madison $ 755,085 $ 16,121,075 4.0% 1925 $ 403,100,000 2135 2.8 17 Tulane U $ 631,052 $ 6,588,181 7.5% 1985 $ 87,857,880 1044 1.7 18 U of Washington/Wash. Res. Fndtn. $ 532,480 $ 21,299,214 4.9% 1983 $ 432,383,000 4000 3.4 19 Harvard U $ 520,694 $ 8,877,826 2.4% 1977 $ 374,446,700 1705 4.0 20 Clemson U $ 500,531 $ 4,329,593 4.8% 1987 $ 90,150,000 865 0.4 TOTALor AVERAGE $ 382,037 $ 685,439,916 3.1% 1986 $ 22,032,295,393 197129 3.6 HIGH $ 8,565,711 $ 73,101,000 64.1% 1998 $ 1,709,929,000 9385 14.3 TOP QUARTILE $ 221,950 $ 3,164,654 2.4% 1992 $ 187,980,648 1684 4.6 MEDIAN $ 63,177 $ 921,685 0.9% 1988 $ 90,486,000 1049 2.9 BOTTOM QUARTILE $ 20,696 $ 194,786 0.4% 1984 $ 40,924,599 637 1.6 LOW $ - $ - 0.0% 1925 $ 3,500,000 14 0.0 COUNT (reporting) 155 154 153 152 155 155 149