Download to read offline
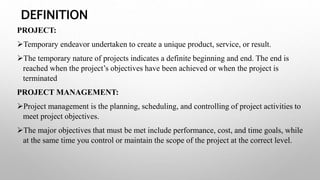


The document defines project management and the project life cycle. It discusses that a project has a definite beginning and end, is temporary in nature, and creates a unique product or service. The four phases of a project life cycle are initiation, planning, implementation, and closure. During planning, the scope, schedule, budget, resources, and risks are defined. Implementation involves executing the project plan and controlling the project. Closure includes finalizing deliverables, documentation, and conducting lessons learned.