This document summarizes a research paper presented by Zabir Al Nazi at Khulna University of Engineering and Technology in Bangladesh. The paper discusses using influence functions to explain the predictions of black box machine learning models. It describes how influence functions can be used to identify influential training examples and features, debug models, and generate adversarial examples. The methodology scales the approach to large models using approximations of influence functions. Results show influence functions enabling analysis of different models that reach the same results through different paths, creation of adversarial examples, and debugging of a model that mispredicted hospital readmissions.


![Scaling Up (2/3)
𝜃 𝜀, 𝑧 = arg minθ
1
𝑛 𝑖=1
𝑛
𝐿 𝑧𝑖, 𝜃 + 𝜀. 𝐿(𝑧, 𝜃)
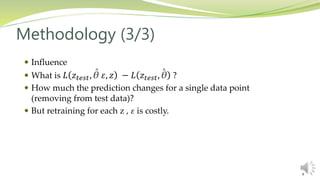
Influence of upweighting z on parameters 𝜃 is given by –
𝐼 𝑢𝑝, 𝑙𝑜𝑠𝑠 =
𝜕𝐿(𝑧𝑡𝑒𝑠𝑡, 𝜃𝜀,𝑧)
𝜕 𝜀
= 𝛻𝜃 𝐿 𝑧𝑡𝑒𝑠𝑡 , 𝜃
𝑇
𝐻 𝜃
−1
𝛻𝜃 𝐿 𝑧 , 𝜃 [1]
𝐻 𝜃 =
1
𝑛 𝑖=1
𝑛
𝛻𝜃
2 𝐿 𝑧𝑖, 𝜃
[1] Cook & Weisberg, 1982
10](https://image.slidesharecdn.com/presentation-180523093256/85/Understanding-Black-box-Predictions-via-Influence-Functions-10-320.jpg)
![Scaling Up (3/3)
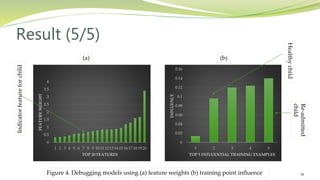
Don’t explicitly form 𝐻 𝜃
−1
, instead compute 𝐻 𝜃
−1
𝑣
𝑣 𝐻 𝜃 𝑣 𝐻 𝜃
−1
𝑣
Pearlmutter trick [1] CG [2]
Taylor [3]
[1] Pearlmutter, 1994
[2] Martens, 2010
[3] Agarwal, Bullins, 2016
11](https://image.slidesharecdn.com/presentation-180523093256/85/Understanding-Black-box-Predictions-via-Influence-Functions-11-320.jpg)


![Deformable DETR Review [CDM]](https://cdn.slidesharecdn.com/ss_thumbnails/deformabledetrreviewcdm-201113070345-thumbnail.jpg?width=640&height=640&fit=bounds)