Download to read offline

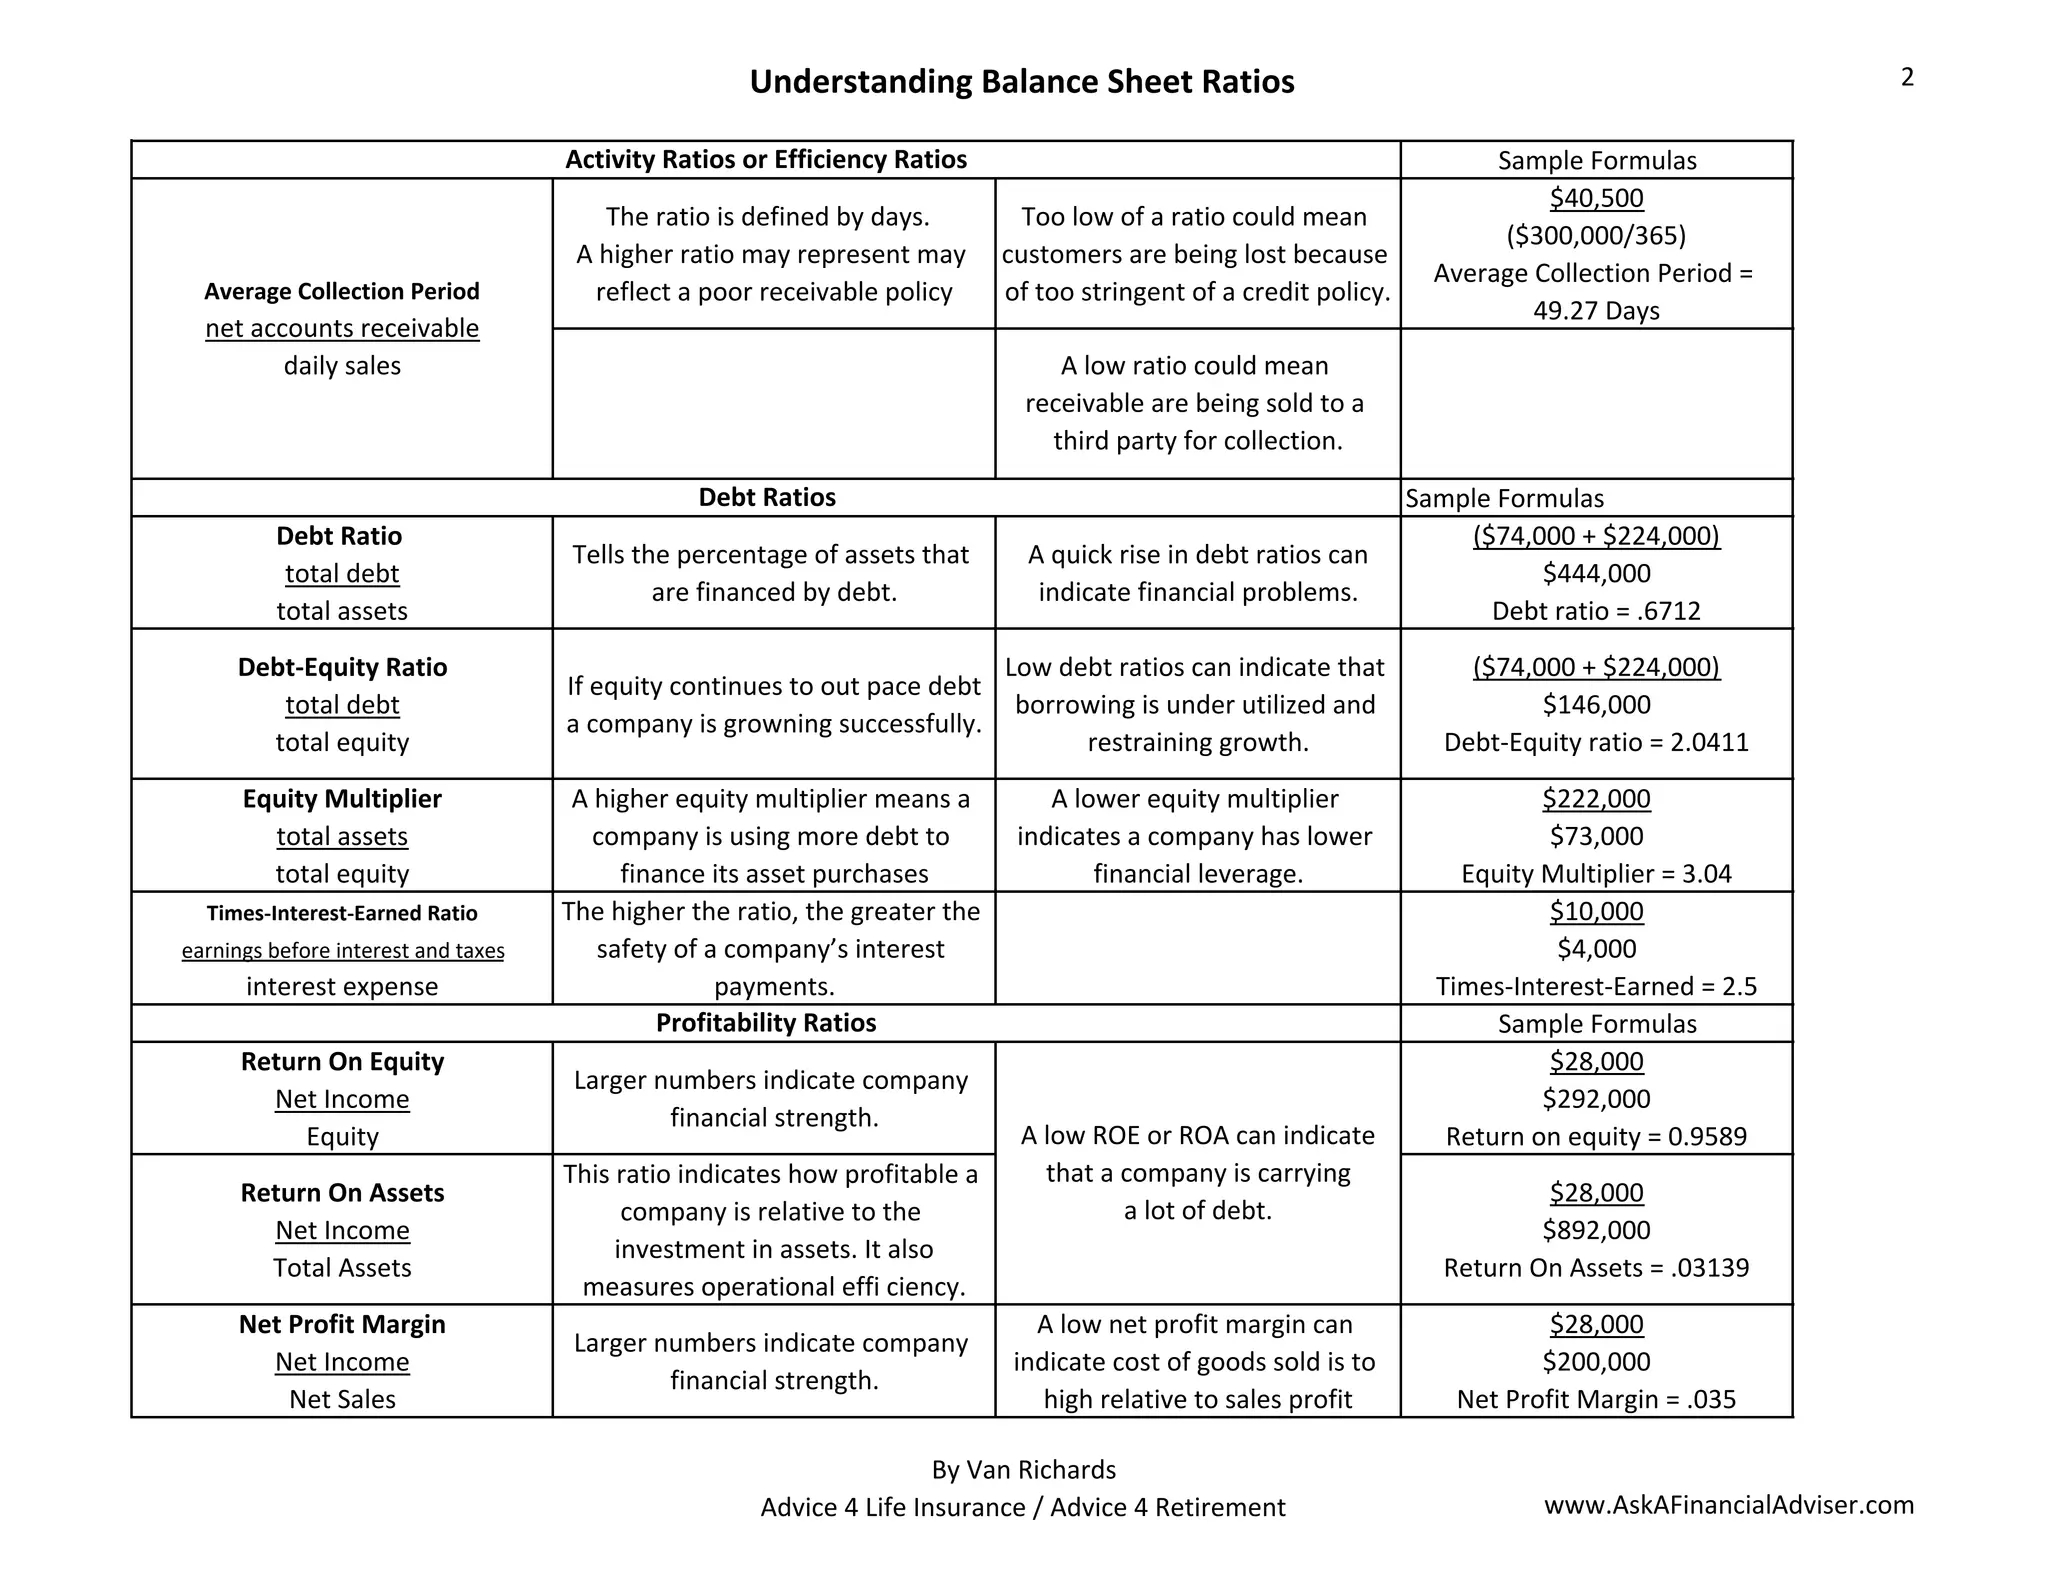

The document explains various balance sheet ratios, including liquidity, efficiency, debt, and profitability ratios, and their implications for financial health. It outlines key formulas and examples to assess a company's financial condition, emphasizing the importance of ratios like current ratio, debt ratio, and return on equity. High or low values for these ratios can indicate effective management or potential financial issues.


