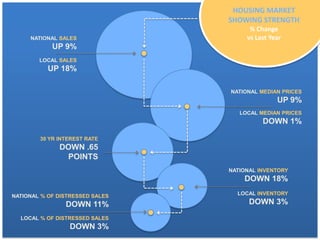
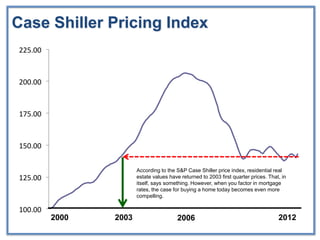
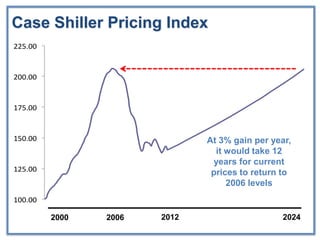
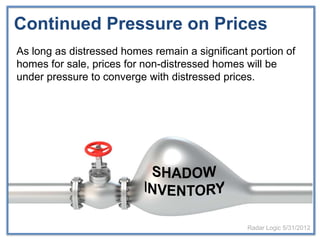
2012 UNCW Economic Outlook Conference


        Residential Real Estate
             Market Brief
HOUSING MARKET
                                 SHOWING STRENGTH
                                       % Change
     NATIONAL SALES                   vs Last Year
            UP 9%
        LOCAL SALES
           UP 18%

                                 NATIONAL MEDIAN PRICES
                                                UP 9%
                                    LOCAL MEDIAN PRICES
                                           DOWN 1%

        30 YR INTEREST RATE
              DOWN .65
               POINTS
                                 NATIONAL INVENTORY
                                     DOWN 18%

NATIONAL % OF DISTRESSED SALES     LOCAL INVENTORY

                DOWN 11%               DOWN 3%
  LOCAL % OF DISTRESSED SALES
                 DOWN 3%
U.S. HOUSING SUMMARY 2012 (In Millions)


     133               13
   Housing           Vacant
    Units

                                                        26                                     2.5
                                                                                      30-60 days delinquent
                                             79     No Mortgage
                                            Owned
                                                                                              4.1
                                                                          12             90+ days or in
                     120                                            Negative Equity       foreclosure
                  Households
                   Occupied                               53
                                                    with Mortgage
                                                                          41                   5.4
                                                                                             current
                                                                      with Equity


                                       41 Rented


Source: John Burns Real Estate Consulting
Supply & Demand
Case Shiller Pricing Index
225.00


200.00


175.00


150.00

                       According to the S&P Case Shiller price index, residential real
125.00                 estate values have returned to 2003 first quarter prices. That, in
                       itself, says something. However, when you factor in mortgage
                       rates, the case for buying a home today becomes even more
                       compelling.

100.00
         2000   2003                    2006                                         2012
Month’s Inventory of Homes for Sale
                                                                                                    Months Supply         Pricing


                                                                                          SELLERS
                                                                                                     1-2              Double Digit Appreciation


                                                                                          MARKET
                                                                                                     3-4              Single Digit Appreciation

                                                                                                     5-6              Balanced


                                                                                          MARKET
                                                                                          BUYERS
                                                                                                     7-8              Single Digit Depreciation

                                                                                                     9+               Double Digit Depreciation
18
16
14
12
10
 8
 6
 4
 2          National
            Wilmington Area
 0
     Nov   Dec   Jan   Feb   Mar   Apr   May   un   Jul   Aug   Sep   Oct   Nov   Dec   Jan    Feb    Mar   Apr     May   Jun       Jul   Aug   Sep


                                                                                                                                                      NAR
Projected Annual % Change in Home Prices


     Source           2012 2013 2014
    Home Price
 Expectation Survey   -.4    1.4   2.6
    Urban Land
     Institute        Flat   2.0   3.5
 Demand Institute
     Study            1.0    1.8   2.5
Case Shiller Pricing Index
225.00


200.00


175.00


150.00                        At 3% gain per year,
                                it would take 12
                               years for current
125.00                         prices to return to
                                   2006 levels
100.00

         2000   2006   2012                     2024
Continued Pressure on Prices
As long as distressed homes remain a significant portion of
homes for sale, prices for non-distressed homes will be
under pressure to converge with distressed prices.


                                                Radar Logic 5/31/2012
Existing Home Sales

           12,247 Homes
           Sell Every Day
           and 8,940 Buyers
           Receive a Mortgage


                                NAR 5/2012
Mortgage Rates – 30 Year Fixed
5.25


  5


4.75


 4.5


4.25


  4


3.75

       1/01/2011                      Today
                                 Federal Reserve
Cost of Owning a Home (Last 20yrs)
         Mortgage
                         Payment-to-                     Payment-to-
Year      Payment
                        Income Ratio                      Rent Ratio
       (2011 Dollars)

1990      $1,183                .28                              1.45


2000      $1,125                .24                              1.37


2006      $1,240                .28                              1.44


2011       $669                 .15                                .77

                        Joint Center For Housing Studies Of Harvard University 6/2012
Where Do You Want to Invest Your $
Over the Next 12 Years?
50
      ROI January 2000 – September 2012
                                                   42%
30

         20%
10
                        1%

-10


-30
                                     -22%

-50
         Dow           S&P         NASDAQ      Real Estate
                                            MSN Money.com, Case Shiller

Uncw 2012 economic conference final draft

  • 1.
    2012 UNCW EconomicOutlook Conference Residential Real Estate Market Brief
  • 3.
    HOUSING MARKET SHOWING STRENGTH % Change NATIONAL SALES vs Last Year UP 9% LOCAL SALES UP 18% NATIONAL MEDIAN PRICES UP 9% LOCAL MEDIAN PRICES DOWN 1% 30 YR INTEREST RATE DOWN .65 POINTS NATIONAL INVENTORY DOWN 18% NATIONAL % OF DISTRESSED SALES LOCAL INVENTORY DOWN 11% DOWN 3% LOCAL % OF DISTRESSED SALES DOWN 3%
  • 4.
    U.S. HOUSING SUMMARY2012 (In Millions) 133 13 Housing Vacant Units 26 2.5 30-60 days delinquent 79 No Mortgage Owned 4.1 12 90+ days or in 120 Negative Equity foreclosure Households Occupied 53 with Mortgage 41 5.4 current with Equity 41 Rented Source: John Burns Real Estate Consulting
  • 5.
  • 6.
    Case Shiller PricingIndex 225.00 200.00 175.00 150.00 According to the S&P Case Shiller price index, residential real 125.00 estate values have returned to 2003 first quarter prices. That, in itself, says something. However, when you factor in mortgage rates, the case for buying a home today becomes even more compelling. 100.00 2000 2003 2006 2012
  • 7.
    Month’s Inventory ofHomes for Sale Months Supply Pricing SELLERS 1-2 Double Digit Appreciation MARKET 3-4 Single Digit Appreciation 5-6 Balanced MARKET BUYERS 7-8 Single Digit Depreciation 9+ Double Digit Depreciation 18 16 14 12 10 8 6 4 2 National Wilmington Area 0 Nov Dec Jan Feb Mar Apr May un Jul Aug Sep Oct Nov Dec Jan Feb Mar Apr May Jun Jul Aug Sep NAR
  • 8.
    Projected Annual %Change in Home Prices Source 2012 2013 2014 Home Price Expectation Survey -.4 1.4 2.6 Urban Land Institute Flat 2.0 3.5 Demand Institute Study 1.0 1.8 2.5
  • 9.
    Case Shiller PricingIndex 225.00 200.00 175.00 150.00 At 3% gain per year, it would take 12 years for current 125.00 prices to return to 2006 levels 100.00 2000 2006 2012 2024
  • 10.
    Continued Pressure onPrices As long as distressed homes remain a significant portion of homes for sale, prices for non-distressed homes will be under pressure to converge with distressed prices. Radar Logic 5/31/2012
  • 12.
    Existing Home Sales 12,247 Homes Sell Every Day and 8,940 Buyers Receive a Mortgage NAR 5/2012
  • 13.
    Mortgage Rates –30 Year Fixed 5.25 5 4.75 4.5 4.25 4 3.75 1/01/2011 Today Federal Reserve
  • 14.
    Cost of Owninga Home (Last 20yrs) Mortgage Payment-to- Payment-to- Year Payment Income Ratio Rent Ratio (2011 Dollars) 1990 $1,183 .28 1.45 2000 $1,125 .24 1.37 2006 $1,240 .28 1.44 2011 $669 .15 .77 Joint Center For Housing Studies Of Harvard University 6/2012
  • 15.
    Where Do YouWant to Invest Your $ Over the Next 12 Years? 50 ROI January 2000 – September 2012 42% 30 20% 10 1% -10 -30 -22% -50 Dow S&P NASDAQ Real Estate MSN Money.com, Case Shiller

Editor's Notes

  • #15 http://www.jchs.harvard.edu/sites/jchs.harvard.edu/files/son2012.pdf