2010-March TREB Market Watch Report
•
0 likes•318 views

- The document provides housing market statistics for the Greater Toronto Area (GTA) in March 2010, including sales, new listings, prices and housing type breakdowns. - Total March sales were 10,430, pushing first quarter 2010 sales to a record 22,418. The average price in March was $434,696. - By housing type, single detached homes made up 47.6% of sales, with a median price of $458,000, while condo apartments were 23.1% of sales at a median price of $282,800. - The annual rate of growth for new listings continued to accelerate in March, up 42% from March 2009. The median price increased 14.4

Recommended
More Related Content
What's hot
Viewers also liked
Viewers also liked (16)
Similar to 2010-March TREB Market Watch Report
Similar to 2010-March TREB Market Watch Report (20)
2010-March TREB Market Watch Report
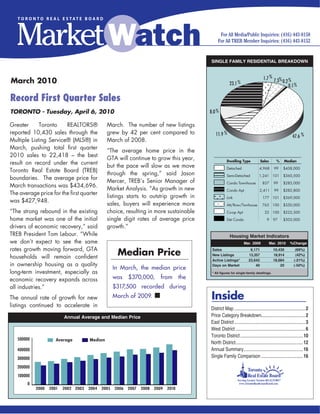
- 1. SINGLE FAMILY RESIDENTIAL BREAKDOWN 1.7 % 7.3% % March 2010 23.1 % 0.2 0.1 % Record First Quarter Sales TORONTO - Tuesday, April 6, 2010 8.0 % Greater Toronto REALTORS® March. The number of new listings reported 10,430 sales through the grew by 42 per cent compared to 11.9 % 47.6 % Multiple Listing Service® (MLS®) in March of 2008. March, pushing total first quarter “The average home price in the 2010 sales to 22,418 – the best GTA will continue to grow this year, 2.3 % 7.0 % Dwelling Type Sales % Median result on record under the current but the pace% will slow as we 0.3 % % 21.5 move 0.1 Single Detached 4,968 Detached 99 $458,000 Toronto Real Estate Board (TREB) through the spring,” said Jason Semi Detached Semi-Detached 1,241 101 $360,500 boundaries. The average price for Mercer, TREB’s Senior Manager of Condo T.H. Condo Townhouse 837 99 $285,000 March transactions was $434,696. Market Analysis. “As growth in new Condo Apt. Condo Apt 2,411 99 $282,800 The average price for the first quarter 8.5 % listings starts to outstrip growth in Link Link 177 101 $369,000 was $427,948. sales, buyers will experience more Attached/Row Att/Row/Twnhouse 765 100 $350,000 “The strong rebound in the existing choice, resulting in more sustainable % 12.0 % Co-op Apt. Co-op Apt 22 100 $222,500 48.3 home market was one of the initial single digit rates of average price Detached Condo Det Condo 9 97 $503,000 drivers of economic recovery,” said growth.” TREB President Tom Lebour. “While Housing Market Indicators we don’t expect to see the same Mar. 2009 Mar. 2010 %Change rates growth moving forward, GTA households will remain confident Median Price Sales New Listings 6,171 13,357 10,430 18,914 (69%) (42%) Active Listings* 23,642 18,684 (-21%) in ownership housing as a quality Days on Market 40 20 (-50%) In March, the median price long-term investment, especially as * All figures for single-family dwellings. economic recovery expands across was $370,000, from the all industries.” $317,500 recorded during The annual rate of growth for new March of 2009. n Inside listings continued to accelerate in District Map ............................................................. 2 Annual Average and Median Price Price Category Breakdown......................................2 East District ............................................................. 3 West District ............................................................ 6 Toronto District ......................................................10 500000 Average Median North District..........................................................12 400000 Annual Summary ...................................................16 300000 Single Family Comparison ....................................16 200000 100000 0 2000 2001 2002 2003 2004 2005 2006 2007 2008 2009 2010
- 2. District Map Price Category Breakdown - March 2010 Price Range Total S.F.D %S.F.D Condo Apt. %Condo Apt. Condo T.H. %Condo T.H. - - $90,000 44 0.4 28 1.2 7 0.8 $90,001 - $100,000 12 0.1 7 0.3 - - $100,001 - $110,000 12 0.1 9 0.4 1 0.1 $110,001 - $120,000 27 0.3 19 0.8 6 0.7 $120,001 - $130,000 41 0.4 32 1.3 4 0.5 $130,001 - $140,000 48 0.5 40 1.7 5 0.6 $140,001 - $150,000 57 0.5 36 1.5 16 1.9 $150,001 - $160,000 72 0.7 40 1.7 15 1.8 $160,001 - $170,000 105 1.0 55 2.3 24 2.9 $170,001 - $180,000 132 1.3 83 3.4 24 2.9 $180,001 - $190,000 97 0.9 61 2.5 17 2.0 $190,001 - $200,000 124 1.2 65 2.7 23 2.7 $200,001 - $225,000 388 3.7 207 8.6 65 7.8 $225,001 - $250,000 545 5.2 229 9.5 86 10.3 $250,001 - $300,000 1,325 12.7 456 18.9 187 22.3 $300,001 - $400,000 3,007 28.8 670 27.8 250 29.9 $400,001 - $500,000 1,925 18.5 219 9.1 57 6.8 $500,001 - $750,000 1,705 16.3 122 5.1 39 4.7 $750,001 - $1,000,000 432 4.1 19 0.8 9 1.1 $1,000,001 - $1,500,000 204 2.0 8 0.3 2 0.2 $1,500,001 - - 128 1.2 6 0.2 - - Total: 10,430 100 2,411 100 837 100 2 TORONTO REAL ESTATE BOARD
- 3. East District Current Month: March 2010 Area Active New Sales $ Volume Avg Price Med Price Avg DOM Avg %List E01 113 184 110 $55,652,176 $505,929 $464,611 10 106 E02 117 177 107 $69,410,959 $648,701 $560,000 8 104 E03 189 258 138 $57,926,917 $419,760 $403,850 15 103 E04 195 211 106 $31,452,696 $296,724 $306,500 21 99 E05 162 211 117 $38,736,502 $331,081 $295,000 16 102 E06 121 129 67 $31,156,955 $465,029 $367,000 16 108 E07 162 198 115 $40,739,912 $354,260 $365,000 15 101 E08 198 180 96 $30,696,571 $319,756 $310,000 19 99 E09 263 254 153 $42,547,405 $278,088 $270,000 20 99 E10 90 102 56 $22,357,208 $399,236 $383,750 14 101 E11 263 244 118 $35,151,602 $297,895 $292,350 23 98 E12 48 49 30 $9,487,000 $316,233 $296,500 23 98 E13 218 213 114 $41,317,348 $362,433 $362,550 18 99 E14 315 382 227 $77,841,168 $342,913 $327,000 16 99 E15 275 313 213 $70,237,005 $329,751 $305,000 17 99 E16 606 538 267 $62,871,747 $235,475 $232,500 26 98 E17 258 246 146 $37,872,178 $259,398 $247,000 24 98 E18 28 13 5 $2,690,000 $538,000 $675,000 57 96 E19 101 91 43 $17,392,271 $404,471 $363,000 32 100 E20 119 79 21 $6,546,200 $311,724 $250,000 28 98 E21 164 92 44 $13,560,835 $308,201 $285,000 42 96 TOTAL 4,005 4,164 2,293 $795,644,655 $346,989 $316,000 19 100 Year-to-Date: March 2010 Area Listed Sales $ Volume Avg Price Med Price Avg DOM Avg %List E01 366 205 $100,743,460 $491,432 $461,000 13 105 E02 345 206 $128,660,312 $624,565 $551,450 13 104 E03 525 297 $123,751,195 $416,671 $400,000 18 102 E04 448 237 $68,213,416 $287,820 $298,000 22 99 E05 416 247 $80,217,000 $324,765 $291,000 20 101 E06 288 146 $61,551,056 $421,583 $359,500 17 104 E07 380 222 $75,903,229 $341,906 $351,000 22 101 E08 422 219 $66,837,091 $305,192 $313,000 24 99 E09 600 348 $93,234,598 $267,916 $259,000 24 99 E10 233 142 $56,450,296 $397,537 $380,500 18 100 E11 524 278 $81,476,304 $293,080 $283,000 26 98 E12 109 59 $18,307,700 $310,300 $290,000 22 98 E13 475 240 $83,644,870 $348,520 $340,750 21 99 E14 861 500 $166,056,265 $332,113 $315,000 20 99 E15 742 421 $133,320,459 $316,676 $297,000 19 99 E16 1,225 602 $138,336,045 $229,794 $222,975 30 98 E17 574 335 $85,443,508 $255,055 $243,000 28 98 E18 35 10 $4,969,500 $496,950 $534,250 63 95 E19 218 102 $39,388,069 $386,158 $349,500 27 99 E20 152 59 $17,012,200 $288,342 $259,900 45 97 E21 215 95 $30,814,235 $324,360 $286,500 46 96 TOTAL 9,153 4,970 $1,654,330,808 $332,863 $305,700 23 100 TORONTO REAL ESTATE BOARD 3
- 4. SINGLE FAMILY EAST BREAKDOWN - MARCH 2010 East District East District East District 80 Days on Market 80 Sales Active Listing Ratio 60 60 40 40 20 20 0 0 Mar Apr May Jun Jul Aug Sep Oct Nov Dec Jan Feb Mar Mar Apr May Jun Jul Aug Sep Oct Nov Dec Jan Fab Mar 2009 2010 2009 2010 Detached Houses Semi-Detached Houses Area Act Sales Av. Price Med. Price % S-A Av. % List Area Act Sales Av. Price Med. Price % S-A Av. % List E01 18 23 $596,643 $527,000 127.8 103 E01 57 61 $507,530 $470,000 107.0 107 E02 49 40 $883,587 $795,000 81.6 103 E02 40 47 $517,700 $471,000 117.5 107 E03 88 71 $502,774 $449,000 80.7 103 E03 29 30 $455,780 $432,500 103.5 106 E04 75 46 $380,519 $370,000 61.3 100 E04 12 9 $298,667 $280,000 75.0 98 E05 34 27 $506,192 $500,000 79.4 105 E05 14 5 $394,038 $380,888 35.7 103 E06 99 56 $490,790 $369,900 56.6 109 E06 13 5 $392,800 $438,000 38.5 99 E07 55 49 $476,138 $467,500 89.1 103 E07 14 10 $362,560 $357,850 71.4 103 E08 100 46 $413,878 $372,500 46.0 100 E08 5 4 $279,250 $276,500 80.0 98 E09 69 48 $357,192 $354,500 69.6 100 E09 2 4 $300,875 $304,750 200.0 98 E10 73 42 $434,328 $409,950 57.5 101 E10 2 4 $345,025 $350,000 200.0 101 E11 94 53 $405,366 $397,000 56.4 99 E11 19 8 $276,688 $269,500 42.1 97 E12 23 15 $348,000 $307,000 65.2 97 E12 2 2 $269,750 $269,750 100.0 99 E13 129 74 $423,455 $408,374 57.4 99 E13 8 5 $334,640 $341,500 62.5 100 E14 224 163 $372,413 $366,888 72.8 99 E14 15 19 $294,553 $290,000 126.7 100 E15 185 147 $369,329 $335,000 79.5 99 E15 6 9 $265,356 $255,900 150.0 100 E16 463 194 $255,808 $244,950 41.9 97 E16 47 38 $187,691 $192,550 80.9 98 E17 200 86 $297,854 $277,500 43.0 98 E17 8 5 $187,000 $192,000 62.5 99 E18 28 5 $538,000 $675,000 17.9 96 E18 - - - - - - E19 93 37 $426,578 $369,500 39.8 100 E19 - - - - - - E20 110 19 $320,221 $300,000 17.3 97 E20 - 1 $220,000 $220,000 - 100 E21 160 42 $311,020 $285,000 26.3 96 E21 1 1 $200,000 $200,000 100.0 93 4 TORONTO REAL ESTATE BOARD
- 5. SINGLE FAMILY EAST BREAKDOWN - MARCH 2010 East District Condo Apartment Link Area Act Sales Av. Price Med. Price % S-A Av. % List Area Act Sales Av. Price Med. Price % S-A Av. % List E01 23 6 $279,733 $332,200 26.1 99 E01 - - - - - - E02 6 10 $526,265 $527,450 166.7 103 E02 - - - - - - E03 64 29 $196,843 $170,000 45.3 98 E03 - - - - - - E04 79 35 $191,026 $190,000 44.3 97 E04 - - - - - - E05 84 44 $229,798 $224,500 52.4 98 E05 6 12 $415,225 $431,500 200.0 105 E06 4 6 $284,783 $279,950 150.0 101 E06 - - - - - - E07 66 38 $206,573 $218,500 57.6 98 E07 15 8 $382,125 $388,500 53.3 103 E08 64 30 $212,859 $179,750 46.9 97 E08 - 1 $315,000 $315,000 - 97 E09 154 90 $240,238 $238,000 58.4 98 E09 - 1 $325,000 $325,000 - 131 E10 4 2 $178,500 $178,500 50.0 95 E10 - 1 $281,000 $281,000 - 104 E11 98 27 $139,881 $129,000 27.6 96 E11 5 1 $291,900 $291,900 20.0 101 E12 3 3 $184,667 $190,000 100.0 97 E12 - 1 $239,000 $239,000 - 99 E13 19 11 $218,491 $188,000 57.9 99 E13 5 - - - - - E14 10 9 $198,667 $182,500 90.0 99 E14 3 1 $256,000 $256,000 33.3 98 E15 32 10 $207,000 $183,000 31.3 97 E15 14 10 $267,470 $275,200 71.4 99 E16 27 5 $148,600 $127,000 18.5 95 E16 9 7 $227,571 $230,000 77.8 99 E17 9 6 $167,442 $168,450 66.7 98 E17 26 15 $236,313 $232,450 57.7 98 E18 - - - - - - E18 - - - - - - E19 - - - - - - E19 4 2 $302,500 $302,500 50.0 98 E20 3 - - - - - E20 1 1 $242,000 $242,000 100.0 98 E21 2 - - - - - E21 1 - - - - - Condo Townhouse Detached Condo Area Act Sales Av. Price Med. Price % S-A Av. % List Area Act Sales Av. Price Med. Price % S-A Av. % List E01 3 3 $351,333 $334,000 100.0 103 E01 - - - - - - E02 7 4 $474,475 $467,000 57.1 99 E02 - - - - - - E03 2 1 $224,000 $224,000 50.0 95 E03 - - - - - - E04 21 13 $264,308 $281,000 61.9 98 E04 - - - - - - E05 17 28 $273,405 $265,700 164.7 103 E05 - - - - - - E06 2 - - - - - E06 - - - - - - E07 10 8 $270,900 $265,900 80.0 101 E07 - - - - - - E08 26 10 $222,290 $220,000 38.5 99 E08 - - - - - - E09 31 10 $225,230 $210,750 32.3 98 E09 - - - - - - E10 7 3 $249,400 $225,000 42.9 102 E10 - - - - - - E11 30 13 $199,808 $198,500 43.3 98 E11 1 - - - - - E12 13 4 $234,900 $236,950 30.8 99 E12 - - - - - - E13 36 14 $220,243 $226,500 38.9 98 E13 - - - - - - E14 30 10 $235,789 $228,500 33.3 99 E14 2 - - - - - E15 15 12 $204,817 $204,450 80.0 99 E15 - - - - - - E16 52 18 $154,042 $145,250 34.6 97 E16 - - - - - - E17 8 5 $164,300 $164,000 62.5 98 E17 - - - - - - E18 - - - - - - E18 - - - - - - E19 - 1 $252,000 $252,000 - 97 E19 - - - - - - E20 5 - - - - - E20 - - - - - - E21 - 1 $298,000 $298,000 - 98 E21 - - - - - - TORONTO REAL ESTATE BOARD 5
- 6. SINGLE FAMILY EAST BREAKDOWN - MARCH 2010 East District Co-op Apartment Attached/Row/Townhouse Area Act Sales Av. Price Med. Price % S-A Av. % List Area Act Sales Av. Price Med. Price % S-A Av. % List E01 - - - - - - E01 12 17 $484,568 $465,000 141.7 108 E02 - 1 $285,000 $285,000 - 95 E02 15 5 $458,000 $445,000 33.3 108 E03 1 1 $185,700 $185,700 100.0 100 E03 5 6 $406,400 $410,000 120.0 100 E04 - - - - - - E04 8 3 $379,633 $372,900 37.5 100 E05 - - - - - - E05 7 1 $350,000 $350,000 14.3 98 E06 - - - - - - E06 3 - - - - - E07 - - - - - - E07 2 2 $354,800 $354,800 100.0 119 E08 - - - - - - E08 3 5 $323,500 $324,500 166.7 102 E09 - - - - - - E09 7 - - - - - E10 - - - - - - E10 4 4 $337,282 $335,564 100.0 99 E11 - - - - - - E11 16 16 $299,219 $294,500 100.0 100 E12 - - - - - - E12 7 5 $398,980 $437,000 71.4 97 E13 - - - - - - E13 21 10 $282,170 $276,150 47.6 100 E14 - - - - - - E14 31 25 $285,576 $285,000 80.7 100 E15 - - - - - - E15 23 25 $254,200 $255,000 108.7 100 E16 - - - - - - E16 8 5 $200,800 $210,000 62.5 98 E17 - - - - - - E17 7 29 $205,203 $200,000 414.3 99 E18 - - - - - - E18 - - - - - - E19 - - - - - - E19 4 3 $250,633 $250,000 75.0 100 E20 - - - - - - E20 - - - - - - E21 - - - - - - E21 - - - - - - West District Current Month: March 2010 Area Active New Sales $ Volume Avg Price Med Price Avg DOM Avg %List W01 90 116 71 $40,236,134 $566,706 $515,500 16 104 W02 130 169 90 $46,238,449 $513,761 $445,000 18 105 W03 173 173 91 $30,186,451 $331,719 $325,000 24 99 W04 236 194 87 $27,637,360 $317,671 $315,000 23 99 W05 415 294 142 $46,354,400 $326,439 $339,500 28 98 W06 263 237 125 $51,663,969 $413,312 $362,000 21 100 W07 124 141 77 $37,417,925 $485,947 $490,000 15 101 W08 225 243 136 $80,909,989 $594,926 $528,750 16 100 W09 127 87 57 $23,381,399 $410,200 $425,900 27 98 W10 337 267 119 $33,829,620 $284,283 $310,000 28 98 W12 245 201 106 $55,559,080 $524,142 $453,750 21 99 W13 228 180 104 $57,946,638 $557,179 $441,750 22 97 W14 102 106 84 $30,599,586 $364,281 $358,500 21 99 W15 428 429 254 $67,498,228 $265,741 $240,000 22 98 W16 134 179 104 $40,793,210 $392,242 $385,000 17 99 W17 - - - - - - - - W18 120 96 44 $12,841,300 $291,848 $306,000 26 97 W19 388 436 288 $116,910,423 $405,939 $385,550 17 99 W20 394 515 339 $141,179,378 $416,458 $390,000 14 100 W21 479 410 195 $100,262,896 $514,169 $470,000 19 99 W22 152 223 161 $67,439,633 $418,880 $368,000 12 100 W23 877 1,043 603 $205,091,786 $340,119 $330,000 17 99 W24 691 768 459 $163,424,090 $356,044 $337,500 19 98 W25 126 104 64 $23,809,125 $372,018 $352,500 21 99 W26 35 20 6 $4,364,500 $727,417 $568,250 40 97 W27 167 151 92 $37,340,100 $405,871 $398,500 22 99 W28 247 179 74 $37,169,194 $502,286 $467,000 33 99 W29 119 96 82 $26,585,400 $324,212 $295,750 39 98 TOTAL 7,052 7,057 4,054 $1,606,670,263 $396,317 $355,000 20 99 6 TORONTO REAL ESTATE BOARD
- 7. SINGLE FAMILY WEST BREAKDOWN - MARCH 2010 West District West District West District 80 Days on Market 80 Sales Active Listing Ratio 60 60 40 40 20 20 0 0 Mar Apr May Jun Jul Aug Sep Oct Nov Dec Jan Feb Mar Mar Apr May Jun Jul Aug Sep Oct Nov Dec Jan Feb Mar 2009 2010 2009 2010 Year-to-Date: March 2010 Area Listed Sales $ Volume Avg Price Med Price Avg DOM Avg %List W01 229 138 $73,608,665 $533,396 $459,000 18 104 W02 327 189 $93,152,945 $492,873 $440,000 18 105 W03 370 185 $60,812,075 $328,714 $328,000 24 100 W04 416 211 $66,961,810 $317,355 $308,000 30 98 W05 695 292 $91,469,450 $313,252 $329,950 29 98 W06 526 292 $116,187,203 $397,901 $364,750 26 100 W07 306 172 $84,202,643 $489,550 $486,944 18 101 W08 516 303 $185,304,389 $611,566 $486,000 22 100 W09 228 127 $48,386,815 $380,999 $398,000 28 98 W10 597 258 $68,723,470 $266,370 $271,000 31 98 W12 478 245 $120,936,166 $493,617 $410,000 26 99 W13 436 204 $132,890,038 $651,422 $460,000 24 98 W14 264 156 $56,002,089 $358,988 $335,000 22 98 W15 1,003 577 $155,152,649 $268,895 $242,000 23 98 W16 369 229 $93,217,070 $407,061 $388,000 20 99 W17 - - - - - - - W18 198 109 $30,822,951 $282,779 $292,000 33 97 W19 999 569 $230,447,781 $405,005 $388,500 17 99 W20 1,123 661 $269,603,308 $407,872 $385,000 15 99 W21 900 461 $261,236,542 $566,674 $495,000 24 99 W22 542 369 $147,086,062 $398,607 $368,000 13 100 W23 2,252 1,261 $429,214,367 $340,376 $330,000 20 99 W24 1,648 921 $332,799,375 $361,346 $342,000 21 98 W25 227 131 $50,571,113 $386,039 $355,000 27 98 W26 42 16 $9,965,000 $622,813 $526,250 66 96 W27 373 244 $100,565,730 $412,155 $392,500 27 99 W28 383 179 $87,850,108 $490,783 $460,000 31 99 W29 239 159 $49,511,313 $311,392 $285,000 36 98 TOTAL 15,686 8,658 $3,446,681,127 $398,092 $354,950 22 99 TORONTO REAL ESTATE BOARD 7
- 8. SINGLE FAMILY WEST BREAKDOWN - MARCH 2010 West District Detached Houses Semi-Detached Houses Area Act Sales Av. Price Med. Price % S-A Av. % List Area Act Sales Av. Price Med. Price % S-A Av. % List W01 29 23 $837,830 $789,900 79.3 103 W01 13 14 $584,321 $579,750 107.7 110 W02 56 34 $666,954 $674,500 60.7 105 W02 39 33 $439,610 $440,000 84.6 105 W03 105 58 $350,594 $331,000 55.2 100 W03 46 16 $367,525 $352,500 34.8 99 W04 103 48 $408,404 $385,000 46.6 100 W04 11 2 $390,500 $390,500 18.2 104 W05 75 41 $442,329 $415,000 54.7 99 W05 76 54 $357,944 $340,000 71.1 99 W06 60 42 $485,046 $421,500 70.0 102 W06 8 2 $424,000 $424,000 25.0 99 W07 51 32 $629,639 $617,250 62.8 102 W07 1 - - - - - W08 129 80 $805,042 $727,500 62.0 101 W08 1 5 $408,600 $400,000 500.0 100 W09 44 32 $564,609 $492,500 72.7 100 W09 3 - - - - - W10 71 53 $371,507 $355,000 74.7 99 W10 11 10 $297,130 $276,500 90.9 98 W12 155 56 $646,439 $560,000 36.1 100 W12 7 5 $454,200 $430,000 71.4 100 W13 163 51 $826,013 $715,000 31.3 96 W13 12 12 $330,125 $334,500 100.0 99 W14 30 22 $556,449 $541,500 73.3 100 W14 10 12 $403,333 $395,000 120.0 100 W15 17 14 $560,972 $526,000 82.4 99 W15 8 13 $381,023 $355,000 162.5 100 W16 75 47 $501,497 $472,000 62.7 100 W16 24 19 $369,884 $362,000 79.2 101 W17 - - - - - - W17 - - - - - - W18 41 15 $338,700 $345,000 36.6 97 W18 34 18 $303,583 $305,000 52.9 98 W19 123 106 $557,880 $547,500 86.2 100 W19 49 50 $395,718 $389,250 102.0 99 W20 180 138 $546,087 $497,000 76.7 99 W20 65 67 $387,090 $387,000 103.1 100 W21 321 124 $609,082 $551,000 38.6 99 W21 17 9 $347,400 $350,000 52.9 99 W22 102 78 $515,652 $439,450 76.5 99 W22 22 29 $347,041 $340,000 131.8 99 W23 563 344 $384,566 $377,550 61.1 99 W23 165 144 $304,303 $307,750 87.3 99 W24 411 237 $433,386 $432,000 57.7 98 W24 103 115 $314,995 $317,000 111.7 99 W25 73 29 $464,085 $433,800 39.7 99 W25 5 4 $357,500 $354,000 80.0 102 W26 35 6 $727,417 $568,250 17.1 97 W26 - - - - - - W27 143 72 $440,969 $430,000 50.4 99 W27 4 2 $343,500 $343,500 50.0 102 W28 225 59 $545,424 $485,000 26.2 98 W28 11 8 $347,050 $350,000 72.7 100 W29 88 67 $351,751 $318,000 76.1 98 W29 10 7 $222,443 $224,000 70.0 99 Condo Apartment Link Area Act Sales Av. Price Med. Price % S-A Av. % List Area Act Sales Av. Price Med. Price % S-A Av. % List W01 36 22 $356,957 $325,500 61.1 102 W01 - - - - - - W02 18 7 $415,286 $361,000 38.9 99 W02 - - - - - - W03 17 13 $202,977 $192,500 76.5 96 W03 - - - - - - W04 80 26 $161,272 $150,000 32.5 97 W04 - - - - - - W05 137 25 $157,940 $160,000 18.3 95 W05 - - - - - - W06 171 71 $359,444 $311,000 41.5 99 W06 - - - - - - W07 65 35 $325,174 $308,000 53.9 100 W07 - - - - - - W08 86 44 $284,105 $250,750 51.2 99 W08 - - - - - - W09 73 20 $166,250 $144,750 27.4 95 W09 - - - - - - W10 200 34 $187,863 $171,000 17.0 98 W10 3 2 $314,500 $314,500 66.7 98 W12 53 21 $271,629 $239,000 39.6 98 W12 - - - - - - W13 13 7 $165,286 $165,000 53.9 96 W13 - - - - - - W14 20 22 $241,745 $241,250 110.0 98 W14 1 1 $467,900 $467,900 100.0 97 W15 370 195 $231,452 $230,000 52.7 98 W15 - 1 $345,000 $345,000 - 96 W16 8 16 $225,678 $196,750 200.0 98 W16 1 2 $394,200 $394,200 200.0 103 W17 - - - - - - W17 - - - - - - W18 27 3 $158,833 $135,500 11.1 99 W18 - - - - - - W19 132 55 $242,511 $214,500 41.7 98 W19 2 1 $379,000 $379,000 50.0 98 W20 55 25 $217,620 $230,500 45.5 98 W20 3 5 $386,980 $380,000 166.7 103 W21 91 13 $238,845 $242,000 14.3 97 W21 2 3 $363,133 $365,000 150.0 99 W22 1 1 $206,100 $206,100 100.0 98 W22 1 - - - - - W23 23 17 $199,206 $207,000 73.9 97 W23 6 2 $301,750 $301,750 33.3 96 W24 72 32 $171,144 $163,000 44.4 97 W24 4 1 $280,000 $280,000 25.0 97 W25 19 11 $219,409 $215,000 57.9 98 W25 4 2 $366,000 $366,000 50.0 99 W26 - - - - - - W26 - - - - - - W27 2 4 $213,625 $213,750 200.0 99 W27 - 3 $316,667 $330,000 - 98 W28 - - - - - - W28 2 1 $330,000 $330,000 50.0 99 W29 14 5 $133,000 $128,000 35.7 97 W29 1 1 $272,000 $272,000 100.0 99 8 TORONTO REAL ESTATE BOARD
- 9. SINGLE FAMILY WEST BREAKDOWN - MARCH 2010 West District Condo Townhouse Detached Condo Area Act Sales Av. Price Med. Price % S-A Av. % List Area Act Sales Av. Price Med. Price % S-A Av. % List W01 6 7 $408,286 $385,000 116.7 102 W01 - - - - - - W02 7 4 $313,588 $307,475 57.1 104 W02 - - - - - - W03 2 2 $346,450 $346,450 100.0 100 W03 - - - - - - W04 37 8 $249,363 $237,450 21.6 100 W04 - - - - - - W05 113 19 $215,311 $210,000 16.8 96 W05 - - - - - - W06 12 4 $396,500 $403,000 33.3 103 W06 - - - - - - W07 - - - - - - W07 - - - - - - W08 4 5 $246,600 $228,000 125.0 100 W08 - - - - - - W09 2 2 $487,950 $487,950 100.0 99 W09 - - - - - - W10 52 15 $156,607 $170,100 28.9 95 W10 - - - - - - W12 23 19 $436,858 $359,900 82.6 99 W12 5 3 $767,667 $810,000 60.0 97 W13 37 30 $307,120 $260,950 81.1 98 W13 1 - - - - - W14 37 19 $251,632 $265,000 51.4 97 W14 - - - - - - W15 33 31 $297,200 $275,000 93.9 99 W15 - - - - - - W16 24 19 $287,042 $285,000 79.2 98 W16 - - - - - - W17 - - - - - - W17 - - - - - - W18 15 7 $219,400 $195,000 46.7 93 W18 - - - - - - W19 65 65 $306,534 $318,000 100.0 99 W19 - - - - - - W20 68 77 $292,214 $273,000 113.2 99 W20 2 1 $245,000 $245,000 50.0 98 W21 14 15 $333,141 $305,000 107.1 99 W21 1 - - - - - W22 1 3 $225,717 $226,000 300.0 99 W22 - - - - - - W23 71 41 $225,851 $225,000 57.8 98 W23 - - - - - - W24 58 34 $206,872 $195,125 58.6 98 W24 4 1 $469,900 $469,900 25.0 98 W25 14 7 $317,321 $310,250 50.0 99 W25 - - - - - - W26 - - - - - - W26 - - - - - - W27 13 7 $262,186 $243,000 53.9 100 W27 - - - - - - W28 1 - - - - - W28 - - - - - - W29 4 - - - - - W29 - - - - - - Co-op Apartment Attached/Row/Townhouse Area Act Sales Av. Price Med. Price % S-A Av. % List Area Act Sales Av. Price Med. Price % S-A Av. % List W01 2 - - - - - W01 4 5 $414,900 $418,000 125.0 104 W02 - 2 $412,500 $412,500 - 105 W02 10 10 $406,855 $418,500 100.0 110 W03 - - - - - - W03 3 2 $320,000 $320,000 66.7 99 W04 - - - - - - W04 5 3 $355,000 $350,000 60.0 103 W05 8 1 $100,500 $100,500 12.5 87 W05 6 2 $375,000 $375,000 33.3 97 W06 4 - - - - - W06 8 6 $556,250 $580,000 75.0 99 W07 3 - - - - - W07 4 10 $588,840 $590,500 250.0 99 W08 3 1 $145,000 $145,000 33.3 97 W08 2 1 $585,000 $585,000 50.0 105 W09 4 1 $170,000 $170,000 25.0 98 W09 1 2 $421,500 $421,500 200.0 99 W10 - - - - - - W10 - 5 $360,600 $363,000 - 97 W12 - - - - - - W12 2 2 $390,000 $390,000 100.0 98 W13 - - - - - - W13 2 4 $371,975 $319,950 200.0 97 W14 - 1 $130,000 $130,000 - 96 W14 4 7 $402,914 $386,400 175.0 99 W15 - - - - - - W15 - - - - - - W16 - - - - - - W16 2 1 $342,000 $342,000 50.0 104 W17 - - - - - - W17 - - - - - - W18 - - - - - - W18 3 1 $284,000 $284,000 33.3 98 W19 1 - - - - - W19 16 11 $395,218 $399,000 68.8 102 W20 - - - - - - W20 21 26 $375,517 $375,000 123.8 100 W21 - - - - - - W21 33 31 $400,600 $385,000 93.9 99 W22 - - - - - - W22 25 50 $325,427 $325,000 200.0 100 W23 - - - - - - W2 3 49 55 $286,031 $289,500 112.2 99 W24 - - - - - - W24 39 39 $287,871 $294,500 100.0 99 W25 2 - - - - - W25 9 11 $323,082 $310,000 122.2 99 W26 - - - - - - W26 - - - - - - W27 - - - - - - W27 5 4 $315,875 $306,250 80.0 100 W28 4 - - - - - W28 4 6 $313,800 $326,000 150.0 102 W29 - - - - - - W29 2 2 $262,000 $262,000 100.0 99 TORONTO REAL ESTATE BOARD 9
- 10. Central District Current Month: March 2010 Area Active New Sales $ Volume Avg Price Med Price Avg DOM Avg%List C01 857 920 459 $187,785,280 $409,118 $355,000 17 101 C02 201 178 98 $82,333,712 $840,140 $575,000 18 101 C03 123 116 70 $54,129,128 $773,273 $467,500 21 101 C04 186 190 130 $111,681,231 $859,086 $750,000 20 100 C06 77 68 36 $23,058,298 $640,508 $540,000 18 101 C07 294 318 150 $67,316,832 $448,779 $369,444 20 100 C08 307 361 195 $79,330,662 $406,824 $362,500 15 101 C09 70 52 34 $42,525,500 $1,250,750 $780,000 40 101 C10 132 158 105 $85,438,639 $813,701 $605,000 14 101 C11 63 70 42 $19,484,212 $463,910 $253,000 23 100 C12 150 111 47 $80,178,700 $1,705,930 $1,225,000 24 98 C13 168 165 80 $33,319,592 $416,495 $358,000 18 100 C14 322 415 225 $103,756,128 $461,138 $370,200 16 101 C15 263 335 188 $82,687,843 $439,829 $392,500 15 101 TOTAL 3,213 3,457 1,859 $1,053,025,757 $566,447 $399,900 18 101 Central District Central District 80 Days on Market 80 Sales Active Listing Ratio 60 60 40 40 20 20 0 0 Mar Apr May Jun Jul Aug Sep Oct Nov Dec Jan Feb Mar Mar Apr May Jun Jul Aug Sep Oct Nov Dec Jan Feb Mar 2009 2010 2009 2010 Year-to-Date: March 2010 Area Listed Sales $ Volume Avg Price Med Price Avg DOM Avg%List C01 2,011 1,025 $425,270,601 $414,898 $362,500 17 101 C02 414 191 $153,452,757 $803,418 $582,013 22 101 C03 257 147 $115,707,389 $787,125 $540,000 23 100 C04 510 303 $250,199,138 $825,740 $750,000 19 101 C06 152 72 $44,208,088 $614,001 $528,250 20 100 C07 668 370 $163,557,947 $442,049 $369,444 21 100 C08 812 437 $169,889,190 $388,762 $349,000 16 101 C09 150 80 $105,009,329 $1,312,617 $885,625 25 101 C10 393 230 $169,208,239 $735,688 $584,500 15 102 C11 162 95 $46,582,482 $490,342 $354,901 21 100 C12 239 104 $157,249,100 $1,512,011 $1,205,500 29 99 C13 360 161 $64,872,256 $402,933 $353,500 19 100 C14 866 504 $242,640,923 $481,430 $370,350 17 101 C15 704 387 $175,804,441 $454,275 $380,000 20 101 TOTAL 7,698 4,106 $2,283,651,880 $556,174 $400,000 19 101 10 TORONTO REAL ESTATE BOARD
- 11. SINGLE FAMILY CENTRAL BREAKDOWN - MARCH 2010 Central District Detached Houses Semi-Detached Houses Area Act Sales Av. Price Med. Price % S-A Av. % List Area Act Sales Av. Price Med. Price % S-A Av.% List C01 17 9 $938,111 $775,000 52.9 104 C01 32 21 $666,790 $668,000 65.6 102 C02 36 21 $1,497,351 $1,321,000 58.3 101 C02 32 28 $741,986 $567,500 87.5 103 C03 79 35 $1,000,654 $625,000 44.3 101 C03 12 12 $760,082 $593,250 100.0 100 C04 126 84 $1,110,037 $995,000 66.7 101 C04 7 7 $761,571 $710,000 100.0 104 C06 46 27 $748,811 $629,000 58.7 102 C06 2 1 $390,000 $390,000 50.0 88 C07 94 36 $756,178 $667,500 38.3 101 C07 12 8 $441,988 $453,250 66.7 100 C08 12 2 $900,000 $900,000 16.7 99 C08 11 6 $626,231 $690,000 54.6 100 C09 34 13 $2,263,154 $2,365,000 38.2 99 C09 6 2 $1,489,000 $1,489,000 33.3 116 C10 49 34 $1,462,897 $1,197,500 69.4 101 C10 8 18 $687,669 $665,370 225.0 105 C11 17 12 $993,333 $944,000 70.6 103 C11 1 4 $622,752 $619,950 400.0 107 C12 119 33 $2,176,512 $1,539,900 27.7 98 C12 1 2 $521,500 $521,500 200.0 102 C13 23 21 $669,582 $560,000 91.3 100 C13 4 9 $372,333 $370,000 225.0 101 C14 101 40 $854,370 $752,500 39.6 101 C14 - - - - - - C15 57 42 $738,358 $698,500 73.7 101 C15 18 30 $441,002 $438,000 166.7 102 Condo Apartment Link Area Act Sales Av. Price Med. Price % S-A Av. % List Area Act Sales Av. Price Med. Price % S-A Av.% List C01 736 378 $375,948 $340,000 51.4 101 C01 - - - - - - C02 103 36 $569,798 $455,000 35.0 99 C02 - - - - - - C03 23 17 $496,853 $450,000 73.9 100 C03 - - - - - - C04 36 29 $351,748 $275,000 80.6 99 C04 - - - - - - C06 25 8 $306,300 $309,450 32.0 99 C06 - - - - - - C07 162 85 $331,090 $315,500 52.5 99 C07 2 1 $455,000 $455,000 50.0 103 C08 256 173 $380,776 $350,000 67.6 101 C08 - - - - - - C09 22 14 $476,357 $482,000 63.6 100 C09 - - - - - - C10 60 48 $427,213 $377,000 80.0 101 C10 - - - - - - C11 34 23 $175,143 $163,000 67.7 97 C11 - - - - - - C12 24 8 $629,875 $497,500 33.3 97 C12 - - - - - - C13 136 44 $287,633 $271,875 32.4 99 C13 - - - - - - C14 202 164 $359,632 $334,750 81.2 101 C14 - - - - - - C15 146 73 $329,661 $318,000 50.0 100 C15 2 2 $473,289 $473,289 100.0 109 Condo Townhouse Detached Condo Area Act Sales Av. Price Med. Price % S-A Av. % List Area Act Sales Av. Price Med. Price % S-A Av.% List C01 45 38 $417,071 $412,500 84.4 104 C01 - 1 $278,000 $278,000 - 96 C02 6 4 $864,750 $822,000 66.7 99 C02 - - - - - - C03 - - - - - - C03 - - - - - - C04 6 6 $379,081 $320,000 100.0 99 C04 - - - - - - C06 2 - - - - - C06 - - - - - - C07 18 15 $355,400 $350,000 83.3 100 C07 - - - - - - C08 10 4 $495,375 $431,250 40.0 102 C08 - - - - - - C09 2 1 $1,152,000 $1,152,000 50.0 105 C09 - - - - - - C10 8 5 $563,180 $407,000 62.5 99 C10 1 - - - - - C11 9 2 $241,951 $241,951 22.2 97 C11 - - - - - - C12 6 4 $567,950 $608,400 66.7 100 C12 - - - - - - C13 3 1 $470,513 $470,513 33.3 99 C13 - - - - - - C14 13 16 $443,672 $388,950 123.1 102 C14 - - - - - - C15 40 41 $327,680 $330,000 102.5 100 C15 - - - - - - TORONTO REAL ESTATE BOARD 11
- 12. SINGLE FAMILY CENTRAL BREAKDOWN - MARCH 2010 Central District Co-op Apartment Attached/Row/Townhouse Area Act Sales Av. Price Med. Price % S-A Av. % List Area Act Sales Av. Price Med. Price % S-A Av. % List C01 - - - - - - C01 27 12 $592,067 $534,400 44.4 103 C02 8 2 $247,500 $247,500 25.0 97 C02 16 7 $806,714 $810,000 43.8 101 C03 8 4 $252,188 $255,375 50.0 105 C03 1 2 $265,000 $265,000 200.0 96 C04 9 4 $158,000 $156,000 44.4 97 C04 2 - - - - - C06 - - - - - - C06 2 - - - - - C07 - - - - - - C07 6 5 $525,978 $570,000 83.3 99 C08 1 - - - - - C08 17 10 $591,744 $550,500 58.8 103 C09 6 4 $576,375 $622,250 66.7 102 C09 - - - - - - C10 5 - - - - - C10 1 - - - - - C11 1 - - - - - C11 1 1 $561,003 $561,003 100.0 106 C12 - - - - - - C12 - - - - - - C13 1 - - - - - C13 1 5 $556,200 $548,000 500.0 102 C14 1 - - - - - C14 5 5 $700,578 $659,000 100.0 104 C15 - - - - - - C15 - - - - - - North District Current Month: March 2010 Area Active New Sales $ Volume Avg Price Med Price Avg DOM Avg %List N01 116 124 87 $49,334,450 $567,063 $560,000 19 101 N02 205 192 112 $59,278,100 $529,269 $468,250 21 99 N03 358 518 297 $158,712,163 $534,384 $468,000 17 100 N04 221 288 139 $74,703,388 $537,434 $502,000 14 100 N05 213 229 91 $50,127,888 $550,856 $535,000 16 99 N06 171 180 123 $59,338,317 $482,425 $418,500 23 99 N07 215 279 181 $67,457,370 $372,693 $351,000 17 99 N08 567 593 300 $155,145,810 $517,153 $475,000 17 99 N10 186 244 103 $52,827,238 $512,886 $505,000 13 101 N11 452 634 368 $198,711,033 $539,976 $485,750 14 101 N12 113 101 52 $22,583,160 $434,292 $379,500 19 99 N13 104 42 12 $9,994,388 $832,866 $659,950 81 98 N14 133 63 25 $14,282,000 $571,280 $530,000 47 95 N15 91 60 26 $10,403,910 $400,150 $377,000 24 97 N16 132 79 45 $19,397,342 $431,052 $410,000 46 97 N17 300 197 87 $23,661,193 $271,968 $268,000 32 98 N18 147 90 45 $14,373,055 $319,401 $315,000 33 98 N19 167 86 50 $14,260,530 $285,211 $282,500 48 98 N20 34 15 4 $1,720,500 $430,125 $438,750 82 98 N21 45 21 9 $2,941,500 $326,833 $313,500 62 97 N22 116 57 14 $3,977,000 $284,071 $260,500 70 98 N23 206 98 36 $9,906,350 $275,176 $264,000 55 97 N24 122 46 18 $5,405,200 $300,289 $257,500 53 96 TOTAL 4,414 4,236 2,224 $1,078,541,885 $484,956 $440,000 21 99 12 TORONTO REAL ESTATE BOARD
- 13. North District North District North District 80 Days on Market 80 Sales Active Listing Ratio 60 60 40 40 20 20 0 0 Mar Apr May Jun Jul Aug Sep Oct Nov Dec Jan Feb Mar Mar Apr May Jun Jul Aug Sep Oct Nov Dec Jan Feb Mar 2009 2010 2009 2010 Year-to-Date: March 2010 Area Listed Sales $ Volume Avg Price Med Price Avg DOM Avg %List N01 269 167 $92,067,450 $551,302 $520,000 20 101 N02 493 261 $127,329,336 $487,852 $431,000 20 100 N03 1,027 583 $293,786,634 $503,922 $452,500 18 100 N04 562 293 $156,433,076 $533,901 $515,000 17 100 N05 456 218 $119,928,186 $550,129 $529,350 21 99 N06 394 235 $112,105,358 $477,044 $415,000 26 99 N07 585 362 $135,599,678 $374,585 $350,000 19 99 N08 1,293 683 $344,155,890 $503,889 $470,000 20 99 N10 415 190 $95,731,494 $503,850 $495,844 16 100 N11 1,179 705 $367,156,726 $520,790 $479,000 18 101 N12 236 131 $57,939,910 $442,289 $395,000 27 99 N13 98 29 $20,842,788 $718,717 $539,000 88 97 N14 153 67 $42,600,800 $635,833 $530,000 52 96 N15 144 71 $30,979,210 $436,327 $375,000 39 97 N16 184 92 $37,471,942 $407,304 $368,500 51 97 N17 411 188 $50,972,143 $271,128 $263,700 37 97 N18 227 103 $33,275,955 $323,068 $308,500 42 98 N19 210 112 $30,688,253 $274,002 $266,000 47 98 N20 33 19 $8,145,600 $428,716 $386,400 72 96 N21 44 17 $5,289,000 $311,118 $318,000 61 98 N22 131 37 $13,597,400 $367,497 $290,000 69 97 N23 242 89 $24,283,450 $272,848 $240,000 58 97 N24 123 32 $8,690,752 $271,586 $240,000 54 96 TOTAL 8,909 4,684 $2,209,071,031 $471,621 $432,000 25 99 TORONTO REAL ESTATE BOARD 13
- 14. SINGLE FAMILY NORTH BREAKDOWN - MARCH 2010 North District Detached Houses Semi-Detached Houses Area Act Sales Av. Price Med. Price % S-A Av. % List Area Act Sales Av. Price Med. Price % S-A Av. % List N01 66 47 $736,716 $661,000 71.2 101 N01 4 1 $450,000 $450,000 25.0 98 N02 110 56 $722,341 $571,250 50.9 99 N02 - - - - - - N03 166 134 $753,946 $691,400 80.7 100 N03 9 5 $463,760 $458,000 55.6 101 N04 161 96 $600,277 $583,500 59.6 100 N04 13 13 $381,838 $355,000 100.0 99 N05 175 69 $596,700 $598,000 39.4 99 N05 8 5 $421,980 $414,900 62.5 100 N06 121 80 $562,024 $485,000 66.1 98 N06 9 13 $336,846 $337,500 144.4 100 N07 149 100 $434,580 $418,000 67.1 99 N07 21 29 $309,931 $321,100 138.1 99 N08 373 171 $609,536 $537,500 45.8 98 N08 50 53 $424,225 $425,000 106.0 100 N10 91 60 $581,721 $567,500 65.9 100 N10 7 7 $384,271 $385,000 100.0 100 N11 273 203 $645,366 $585,000 74.4 101 N11 34 35 $428,008 $422,000 102.9 101 N12 97 33 $490,797 $430,000 34.0 99 N12 5 7 $349,029 $345,000 140.0 99 N13 104 12 $832,866 $659,950 11.5 98 N13 - - - - - - N14 129 23 $596,304 $570,000 17.8 94 N14 - 1 $349,000 $349,000 - 100 N15 84 25 $407,936 $385,000 29.8 97 N15 - - - - - - N16 108 38 $462,034 $427,500 35.2 97 N16 - - - - - - N17 287 83 $273,738 $271,000 28.9 98 N17 5 2 $232,950 $232,950 40.0 98 N18 122 28 $349,904 $340,000 23.0 98 N18 5 2 $263,000 $263,000 40.0 98 N19 107 33 $305,016 $293,800 30.8 98 N19 4 3 $217,333 $215,000 75.0 98 N20 34 4 $430,125 $438,750 11.8 98 N20 - - - - - - N21 45 9 $326,833 $313,500 20.0 97 N21 - - - - - - N22 98 12 $296,667 $271,500 12.2 98 N22 2 - - - - - N23 199 35 $276,610 $270,000 17.6 97 N23 - - - - - - N24 111 17 $309,012 $270,000 15.3 96 N24 - - - - - - Condo Apartment Link Area Act Sales Av. Price Med. Price % S-A Av. % List Area Act Sales Av. Price Med. Price % S-A Av. % List N01 19 22 $375,727 $299,000 115.8 100 N01 2 5 $449,380 $479,900 250.0 100 N02 76 46 $319,957 $299,000 60.5 98 N02 4 3 $376,167 $383,500 75.0 97 N03 117 78 $284,325 $275,050 66.7 99 N03 10 7 $447,714 $468,000 70.0 107 N04 18 6 $315,467 $265,900 33.3 100 N04 - - - - - - N05 - - - - - - N05 2 2 $440,250 $440,250 100.0 99 N06 10 5 $293,300 $309,000 50.0 98 N06 1 1 $269,000 $269,000 100.0 98 N07 6 12 $232,367 $222,950 200.0 98 N07 2 - - - - - N08 83 13 $311,127 $311,500 15.7 98 N08 1 2 $502,500 $502,500 200.0 100 N10 37 4 $272,000 $266,750 10.8 99 N10 44 30 $447,370 $447,500 68.2 103 N11 69 34 $329,072 $297,750 49.3 99 N11 11 19 $462,336 $460,000 172.7 102 N12 - - - - - - N12 - 1 $350,960 $350,960 - 103 N13 - - - - - - N13 - - - - - - N14 1 1 $218,000 $218,000 100.0 95 N14 - - - - - - N15 - - - - - - N15 - - - - - - N16 10 3 $220,000 $265,000 30.0 97 N16 - 1 $289,000 $289,000 - 97 N17 1 - - - - - N17 1 - - - - - N18 6 2 $175,000 $175,000 33.3 95 N18 7 12 $291,396 $302,750 171.4 99 N19 10 - - - - - N19 3 5 $240,200 $245,000 166.7 98 N20 - - - - - - N20 - - - - - - N21 - - - - - - N21 - - - - - - N22 - - - - - - N22 11 - - - - - N23 - - - - - - N23 2 - - - - - N24 - - - - - - N24 - - - - - - 14 TORONTO REAL ESTATE BOARD
- 15. SINGLE FAMILY NORTH BREAKDOWN - MARCH 2010 North District Condo Townhouse Detached Condo Area Act Sales Av. Price Med. Price % S-A Av. % List Area Act Sales Av. Price Med. Price % S-A Av. % List N01 25 11 $301,900 $300,000 44.0 101 N01 - - - - - - N02 11 5 $395,300 $366,000 45.5 99 N02 1 - - - - - N03 27 29 $343,772 $370,000 107.4 100 N03 - - - - - - N04 5 4 $352,500 $367,000 80.0 99 N04 - - - - - - N05 - - - - - - N05 - - - - - - N06 13 7 $339,614 $304,000 53.9 101 N06 - - - - - - N07 16 13 $274,338 $263,900 81.3 98 N07 - - - - - - N08 11 7 $327,286 $328,000 63.6 99 N08 - - - - - - N10 4 - - - - - N10 - - - - - - N11 24 22 $425,932 $386,500 91.7 102 N11 - 1 $550,000 $550,000 - 98 N12 2 1 $217,000 $217,000 50.0 98 N12 1 - - - - - N13 - - - - - - N13 - - - - - - N14 3 - - - - - N14 - - - - - - N15 - - - - - - N15 - - - - - - N16 7 1 $275,242 $275,242 14.3 95 N16 - - - - - - N17 1 - - - - - N17 1 - - - - - N18 3 1 $203,000 $203,000 33.3 98 N18 - - - - - - N19 8 - - - - - N19 31 2 $411,500 $411,500 6.5 97 N20 - - - - - - N20 - - - - - - N21 - - - - - - N21 - - - - - - N22 - - - - - - N22 - - - - - - N23 - - - - - - N23 - - - - - - N24 8 1 $152,000 $152,000 12.5 95 N24 - - - - - - Co-op Apartment Attached/Row/Townhouse Area Act Sales Av. Price Med. Price % S-A Av. % List Area Act Sales Av. Price Med. Price % S-A Av. % List N01 - - - - - - N01 - 1 $425,000 $425,000 - 112 N02 - - - - - - N02 3 2 $502,000 $502,000 66.7 102 N03 - - - - - - N03 29 44 $456,450 $456,500 151.7 101 N04 - - - - - - N04 24 20 $440,505 $433,250 83.3 100 N05 - - - - - - N05 28 15 $397,680 $400,000 53.6 100 N06 - - - - - - N06 17 17 $346,153 $345,000 100.0 99 N07 - - - - - - N07 21 27 $320,615 $320,000 128.6 100 N08 - - - - - - N08 49 54 $390,567 $385,000 110.2 100 N10 - - - - - - N10 3 2 $362,500 $362,500 66.7 109 N11 - - - - - - N11 41 54 $422,744 $409,700 131.7 102 N12 - - - - - - N12 8 10 $337,570 $334,750 125.0 100 N13 - - - - - - N13 - - - - - - N14 - - - - - - N14 - - - - - - N15 - - - - - - N15 7 1 $205,500 $205,500 14.3 98 N16 - - - - - - N16 7 2 $307,900 $307,900 28.6 100 N17 - - - - - - N17 4 2 $237,500 $237,500 50.0 98 N18 - - - - - - N18 4 - - - - - N19 - - - - - - N19 4 7 $217,000 $216,000 175.0 98 N20 - - - - - - N20 - - - - - - N21 - - - - - - N21 - - - - - - N22 - - - - - - N22 5 2 $208,500 $208,500 40.0 98 N23 - - - - - - N23 5 1 $225,000 $225,000 20.0 98 N24 - - - - - - N24 3 - - - - - TORONTO REAL ESTATE BOARD 15
- 16. District Totals New Active Listed Sales $ Volume Avg Price Med Price Avg DOM Avg Month Grand Total 18,914 18,684 N/A 10,430 4,533,882,560 434,696 370,000 20 100 Year N/A N/A 41,446 22,418 9,593,734,846 427,948 365,000 22 100 Annual Summary - Single Family Year *Number of Sales *Average Price Year *Number of Sales *Average Price 1976 19,025 $61,389 2009 1977 20,512 $64,559 January 2,670 $343,632 1978 21,184 $67,333 February 4,120 $361,305 1979 23,466 $70,830 March 6,171 $362,050 1980 26,017 $75,694 April 8,107 $385,641 1981 29,625 $90,203 May 9,589 $395,609 1982 25,336 $95,496 June 10,955 $403,972 1983 30,046 $101,626 July 9,967 $395,414 1984 31,905 $102,318 August 8,035 $387,921 1985 45,509 $109,094 September 8,196 $406,877 1986 52,919 $138,925 October 8,476 $423,559 1987 43,475 $189,105 November 7,446 $418,460 1988 49,381 $229,635 December 5,541 $411,931 1989 38,960 $273,698 1990 26,779 $255,020 Total** 87,308 $395,460 1991 38,144 $234,313 1992 41,703 $214,971 2010 1993 38,990 $206,490 January 4,986 $409,058 1994 44,237 $208,921 February 7,291 $431,509 1995 39,273 $203,028 March 10,430 $434,696 1996 55,779 $198,150 1997 58,014 $211,307 Year-to-Date** 22,418 $427,948 1998 55,344 $216,815 1999 58,957 $228,372 2000 58,343 $243,255 2001 67,612 $251,508 2002 74,759 $275,231 2003 78,898 $293,067 2004 83,501 $315,231 2005 84,145 $335,907 2006 83,084 $351,941 2007 93,193 $376,236 2008 74,552 $379,347 * Due to District revisions, caution should be exercised when undertaking historical comparisons. Please refer to appropriate maps. **This figure may not equal the sum of all monthly totals, as the year-to-date total reflects sales reported in error and deals that have fallen through since January 1st. Single Family Dwelling Sales Comparison Sales Active Listing Average Price 15000 500000 35000 13500 30000 12000 425000 10500 25000 9000 20000 7500 350000 6000 15000 4500 10000 275000 3000 5000 1500 0 0 200000 Mar Apr May Jun Jul Aug Sep Oct Nov Dec Jan Feb Mar Mar Apr May Jun Jul Aug Sep Oct Nov Dec Jan Feb Mar 2000 2001 2002 2003 2004 2005 2006 2007 2008 2009 2010 2009 2010 2009 2010 16 TORONTO REAL ESTATE BOARD