Download to read offline

![57
References
References
I. CMS at a glance
[1] Bauer and Hoye. 2014. Migratory animals couple biodiversity and
ecosystem functioning worldwide. Science, 344(6179): 1242552.
[2] UNEP/CMS/ScC-SC6/Inf.12.4.1c
[3] Kunz et al. 2011. Ecosystem services provided by bats. Annals of the New
York Academy of Sciences, 1223(1): 1-38.
[4] Stara et al. 2016. Bound eagles, evil vultures and cuckoo horses.
Preserving the bio-cultural diversity of carrion eating birds. Human
Ecology, 44(6):751-764.
[5] Kothari et al. 2022. Of the Wheel of Life and Guardian Deities: How
Buddhism Shapes the Conservation Discourse in the Indian Trans-
Himalayas. In: Borde et al. (Eds). Religion and Nature Conservation.
Routledge, London. 29-40.
[6] Dzombak, 2022. A look inside the monumental effort to save the
Andean condor. National Geographic. Available at: https://www.
nationalgeographic.com/animals/article/a-look-inside-the-monumental-
effort-to-save-the-andean-condor.
[7] Pike et al. 2020. Anguilla anguilla. The IUCN Red List of Threatened
Species 2020: e.T60344A152845178. https://dx.doi.org/10.2305/IUCN.
UK.2020-2.RLTS.T60344A152845178.en. Accessed on 05 June 2023.
[8] Wright et al. 2022. First direct evidence of adult European eels migrating
to their breeding place in the Sargasso Sea. Scientific Reports, 12(1):
1536.
[9] Feunteun. 2002. Management and restoration of European eel population
(Anguilla anguilla): an impossible bargain. Ecological engineering, 18(5):
575-591.
[10] Sonne et al. 2021. European eel population at risk of collapse. Science,
Jun 18;372(6548):1271. PMID: 34140374.
II. State – Conservation status
[1] Cooke, J.G. 2018. Megaptera novaeangliae. The IUCN Red List
of Threatened Species 2018: e.T13006A50362794. https://dx.doi.
org/10.2305/IUCN.UK.2018-2.RLTS.T13006A50362794.en. Accessed on
17 April 2023
[2] Zerbini et al. 2019. Assessing the recovery of an Antarctic predator from
historical exploitation. Royal Society Open Science, 6(10), p.190368
[3] UNEP/CMS/Concerted Action 12.4
[4] Minton et al. 2008. Megaptera novaeangliae (Arabian Sea subpopulation).
The IUCN Red List of Threatened Species 2008: e.T132835A3464679.
https://dx.doi.org/10.2305/IUCN.UK.2008.RLTS.T132835A3464679.en.
Accessed on 17 April 2023.
[5] Pierce et al. 2021. Rhincodon typus (Green Status assessment). The
IUCN Red List of Threatened Species 2021: e.T19488A1948820221.
Accessed on 26 May 2023.
[6] Lotze et al. 2011. Recovery of marine animal populations and ecosystems.
Trends in Ecology Evolution, 26(11), pp.595-605
[7] Thomas et al. 2016. Status of the world’s baleen whales. Marine Mammal
Science, 32(2): 682-734
[8] Rosenberg et al.2019. Decline of the North American avifauna. Science,
366(6461): 120-124.
[9] Vickery et al. 2023. The conservation of Afro-Palearctic migrants:
What are we learning and what do we need to know? Ibis. https://doi.
org/10.1111/ibi.13171.
[10] CMS. 2023. CMS Convention Text. Available at: https://www.cms.int/en/
convention-text.
[11] Hu et al. 2016. Mass seasonal bioflows of high-flying insect migrants.
Science, 354: 1584-1587.
[12] Hawkes et al. 2022. Huge spring migrations of insects from the Middle
East to Europe: quantifying the migratory assemblage and ecosystem
services. Ecography, e06288.
[13] Chowdhury et al. 2021. Migration in butterflies: a global overview.
Biological Reviews, 96: 1462-1483.
[14] Wagner et al. 2021. Insect decline in the Anthropocene: death by a
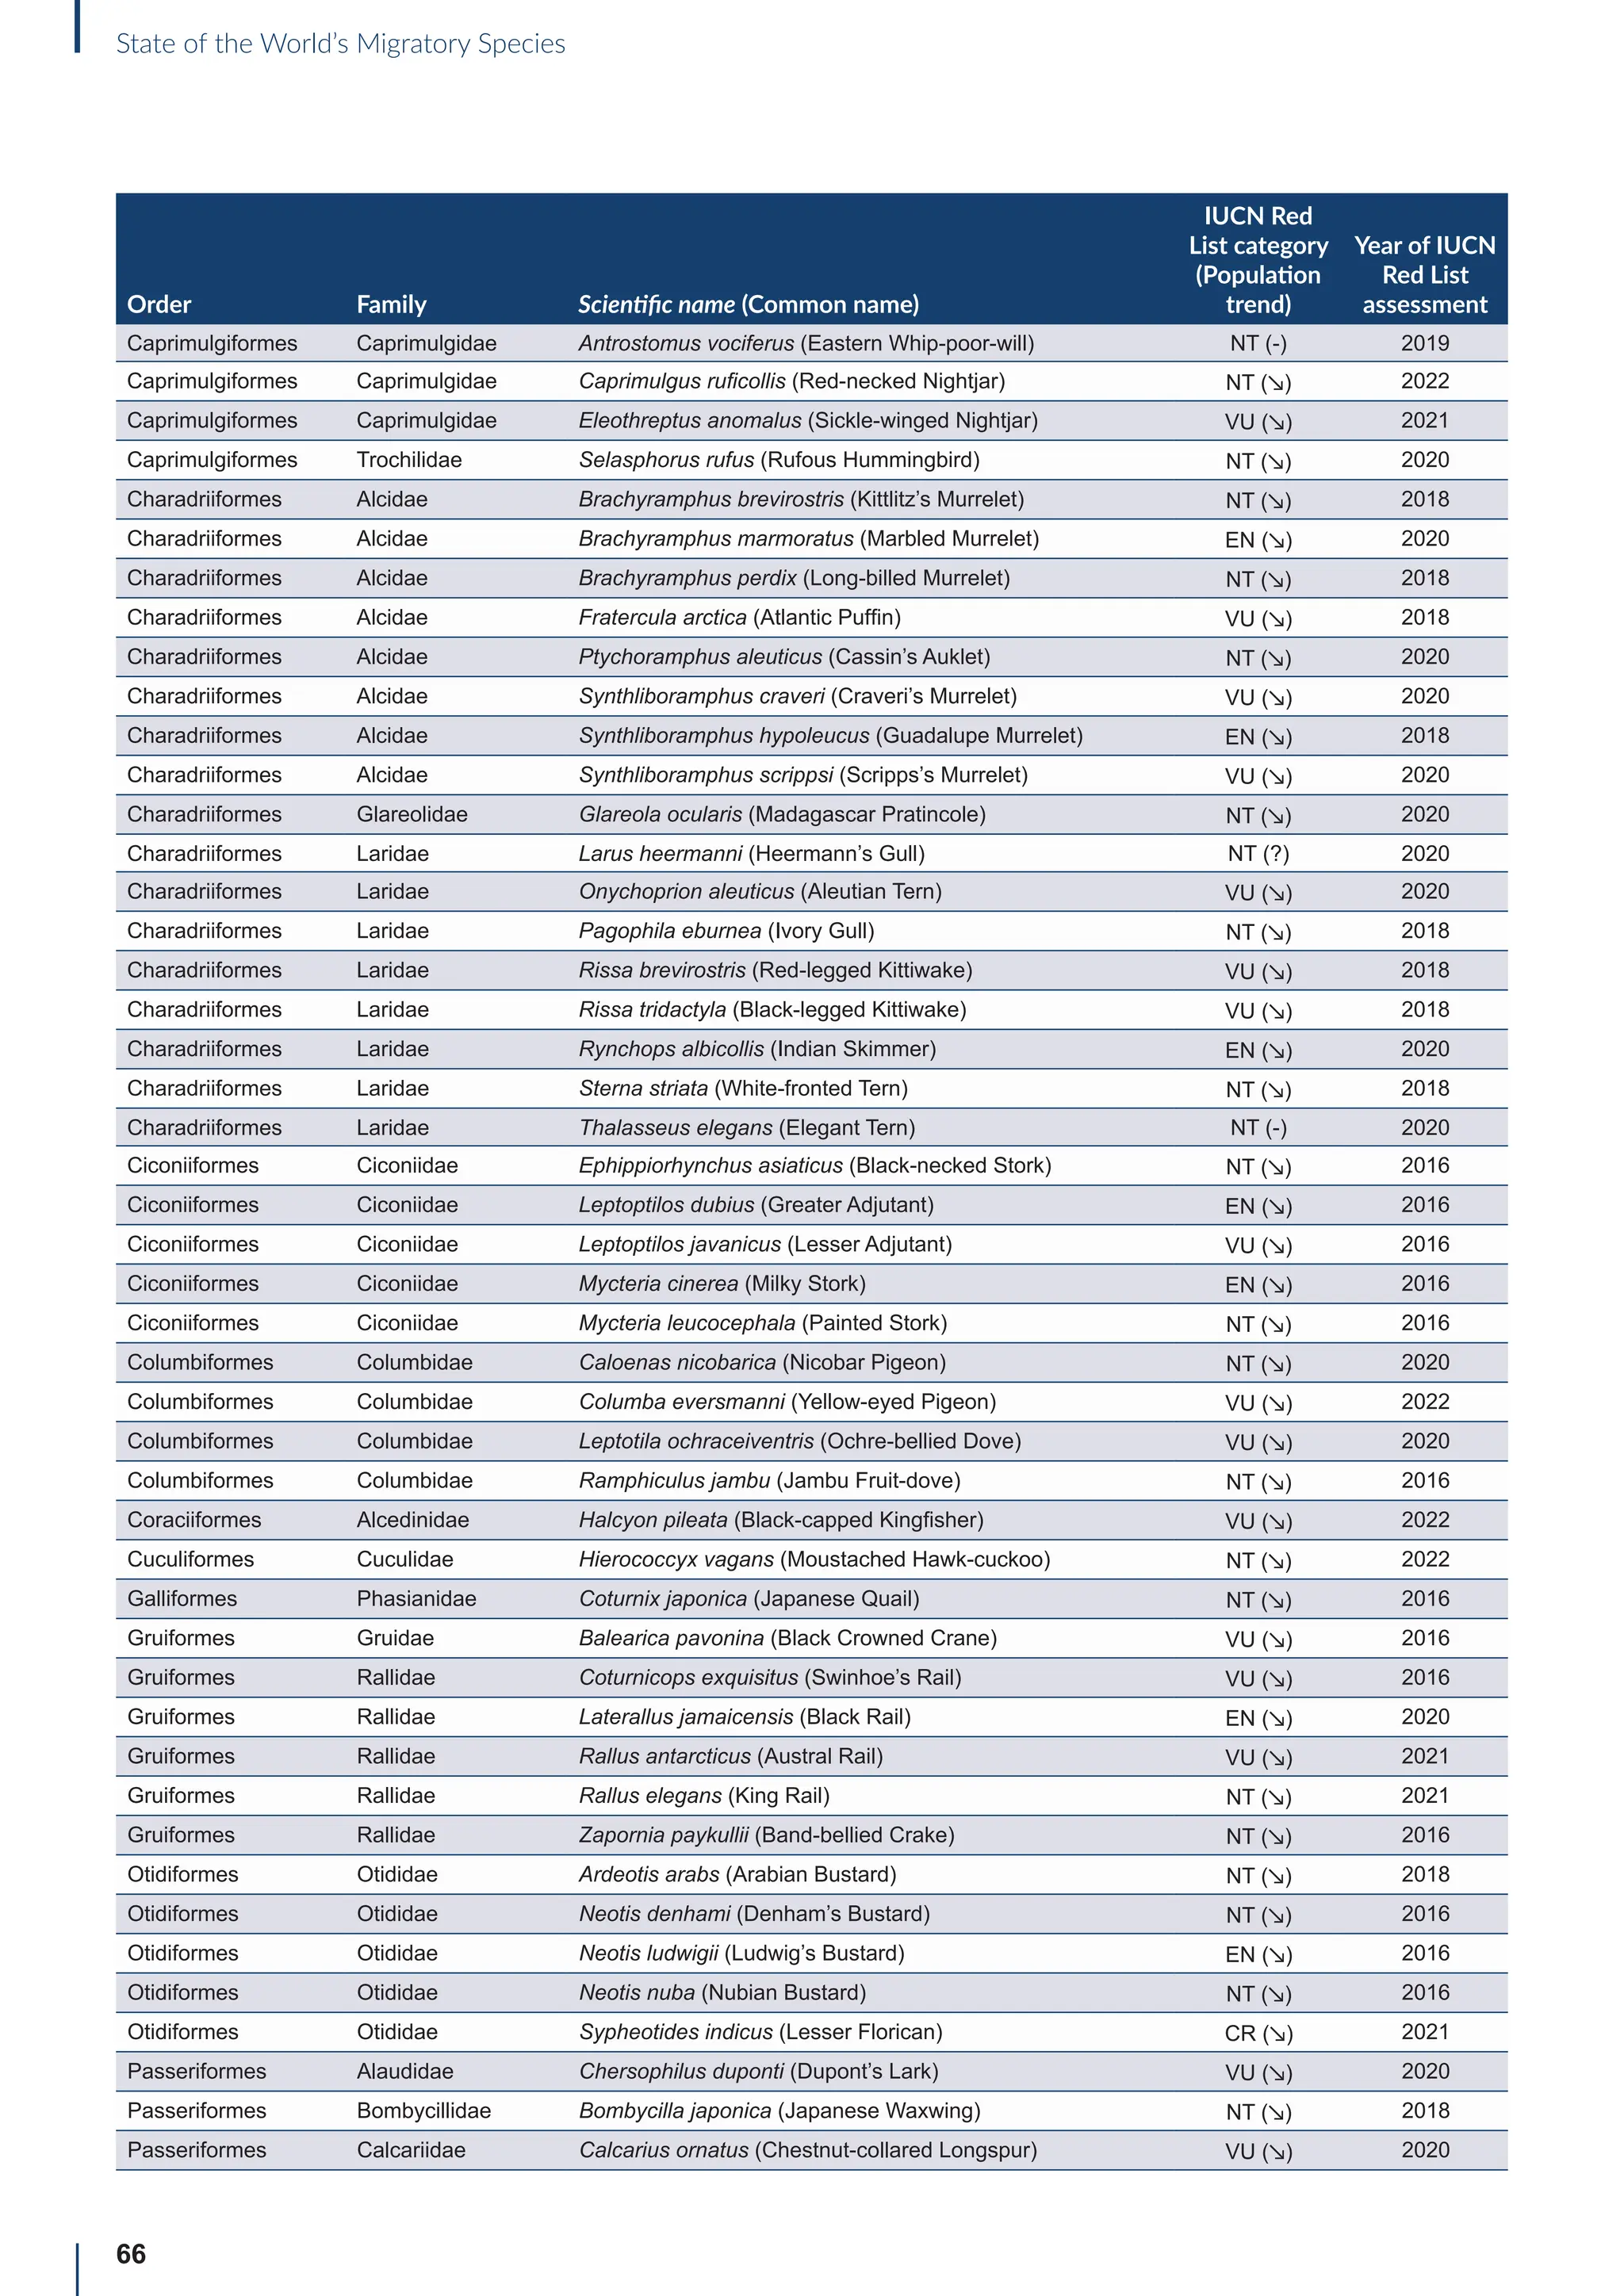
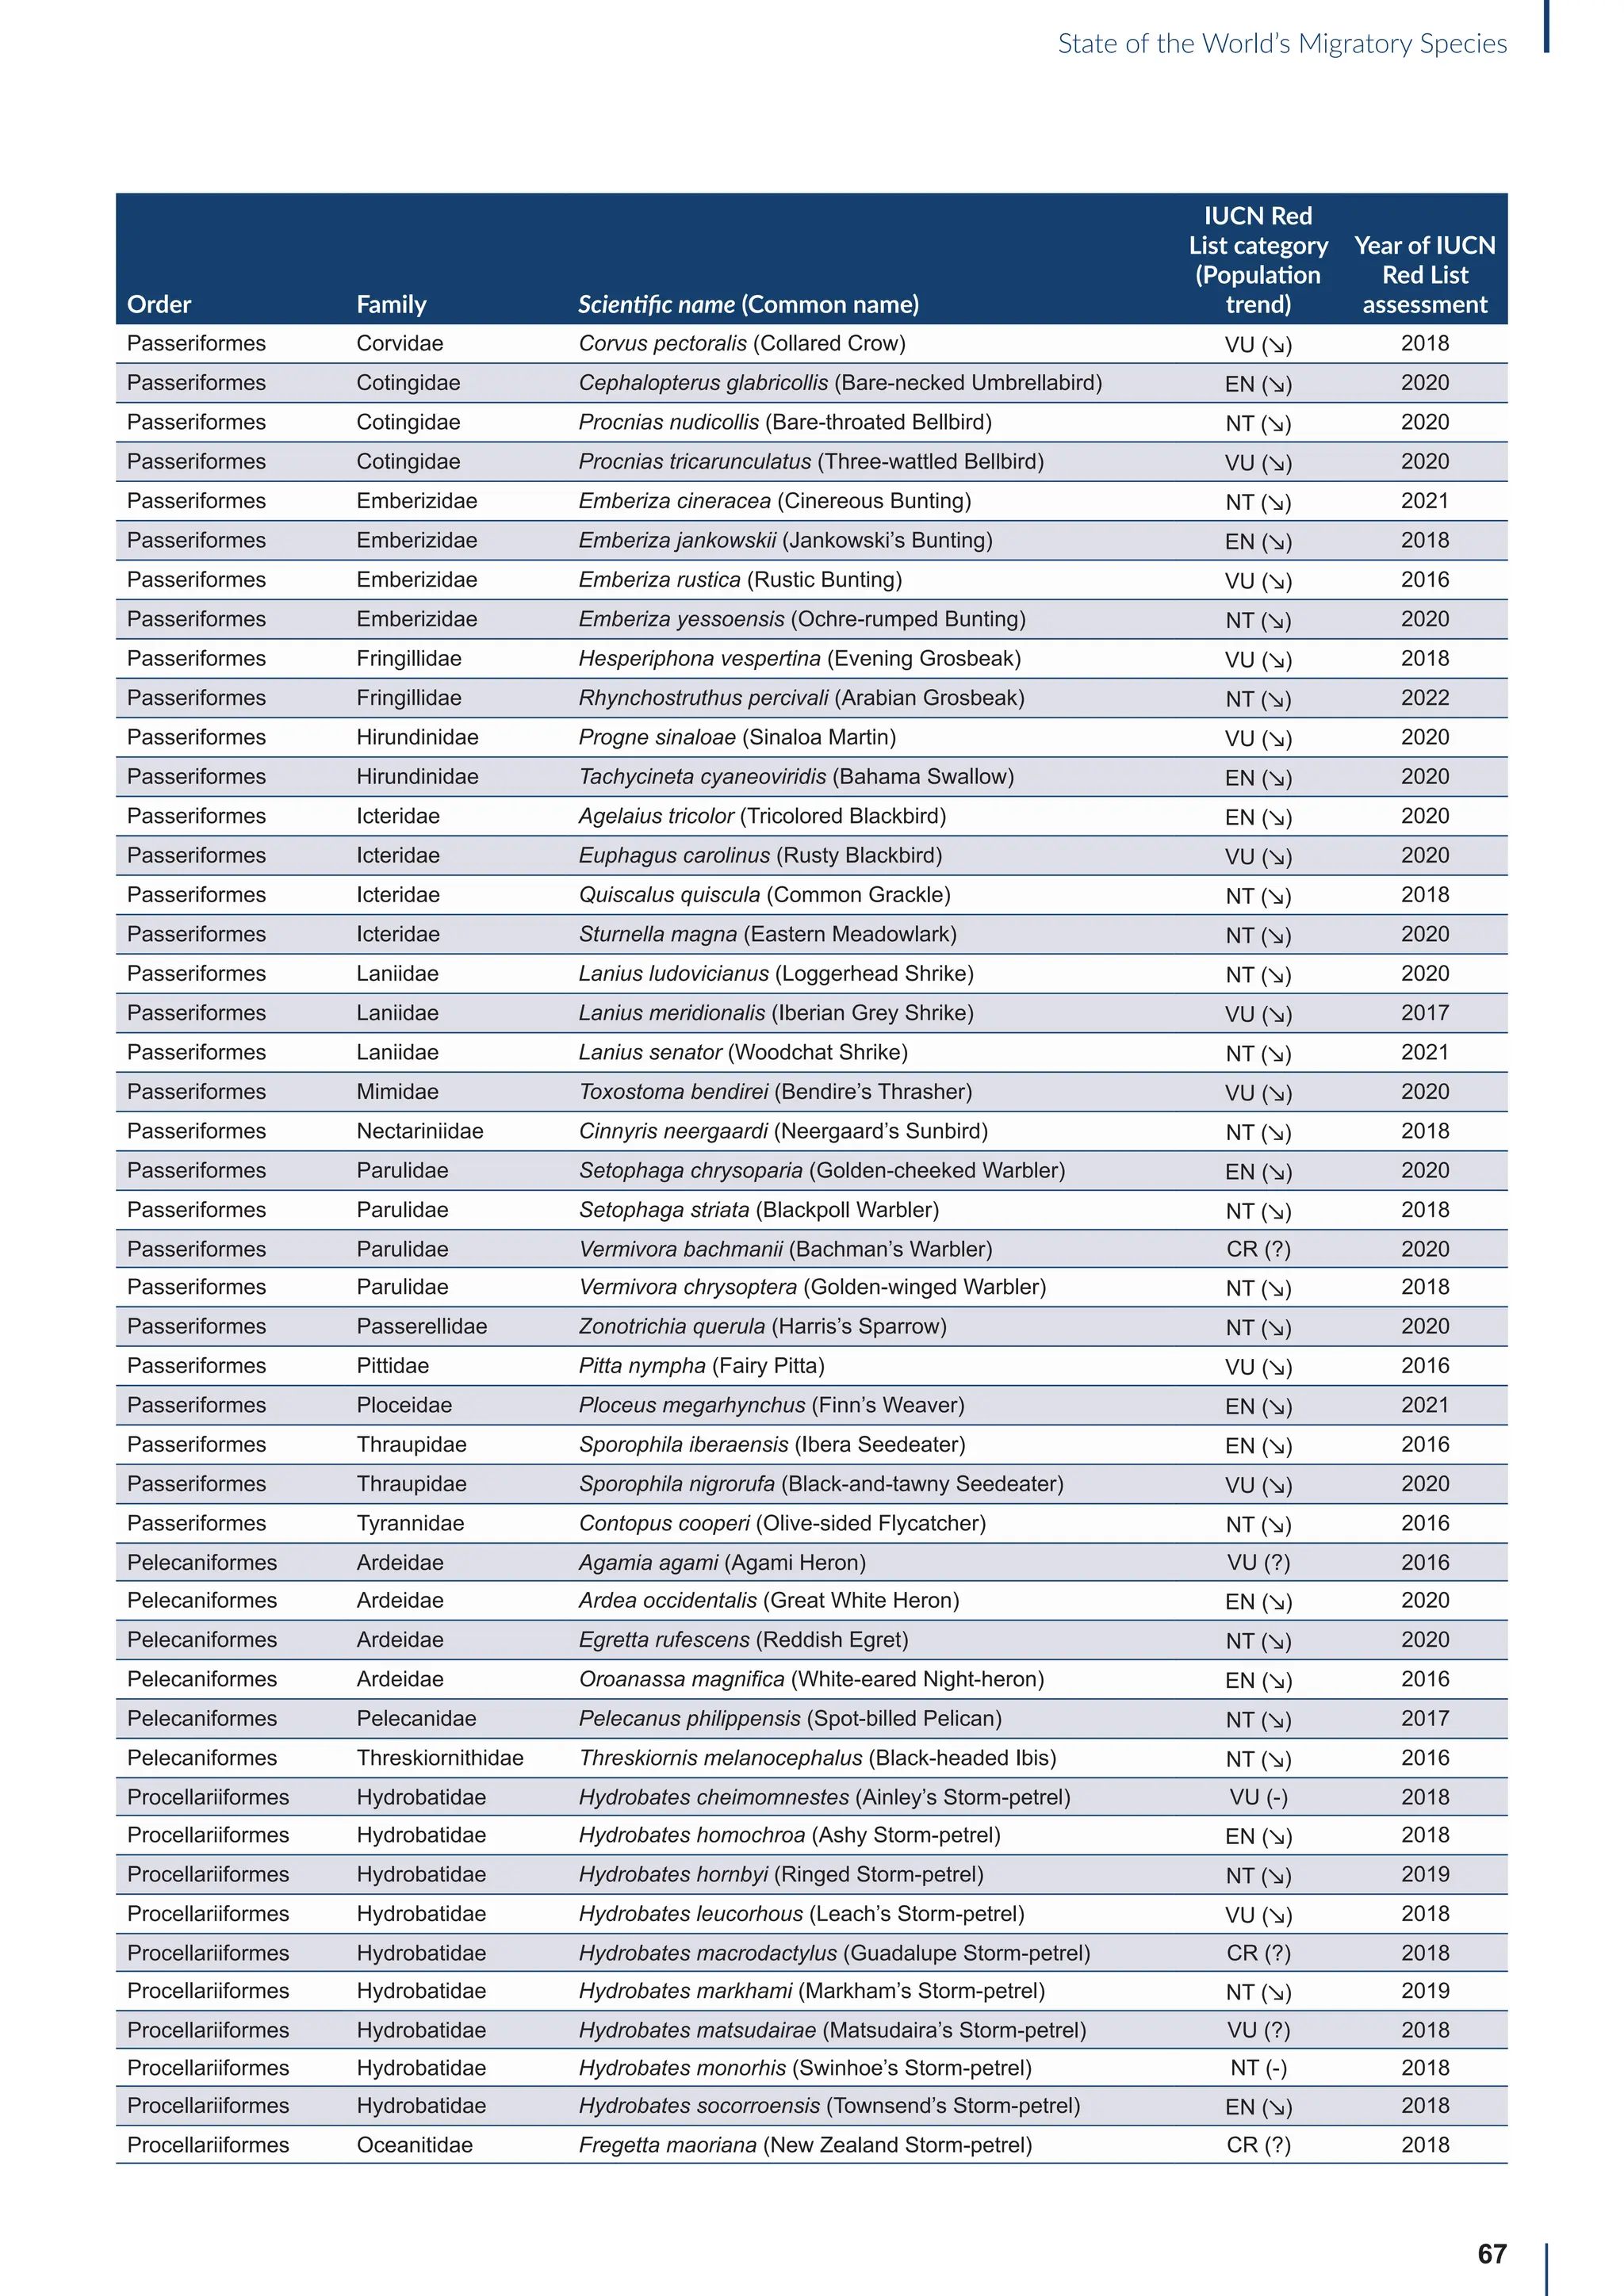
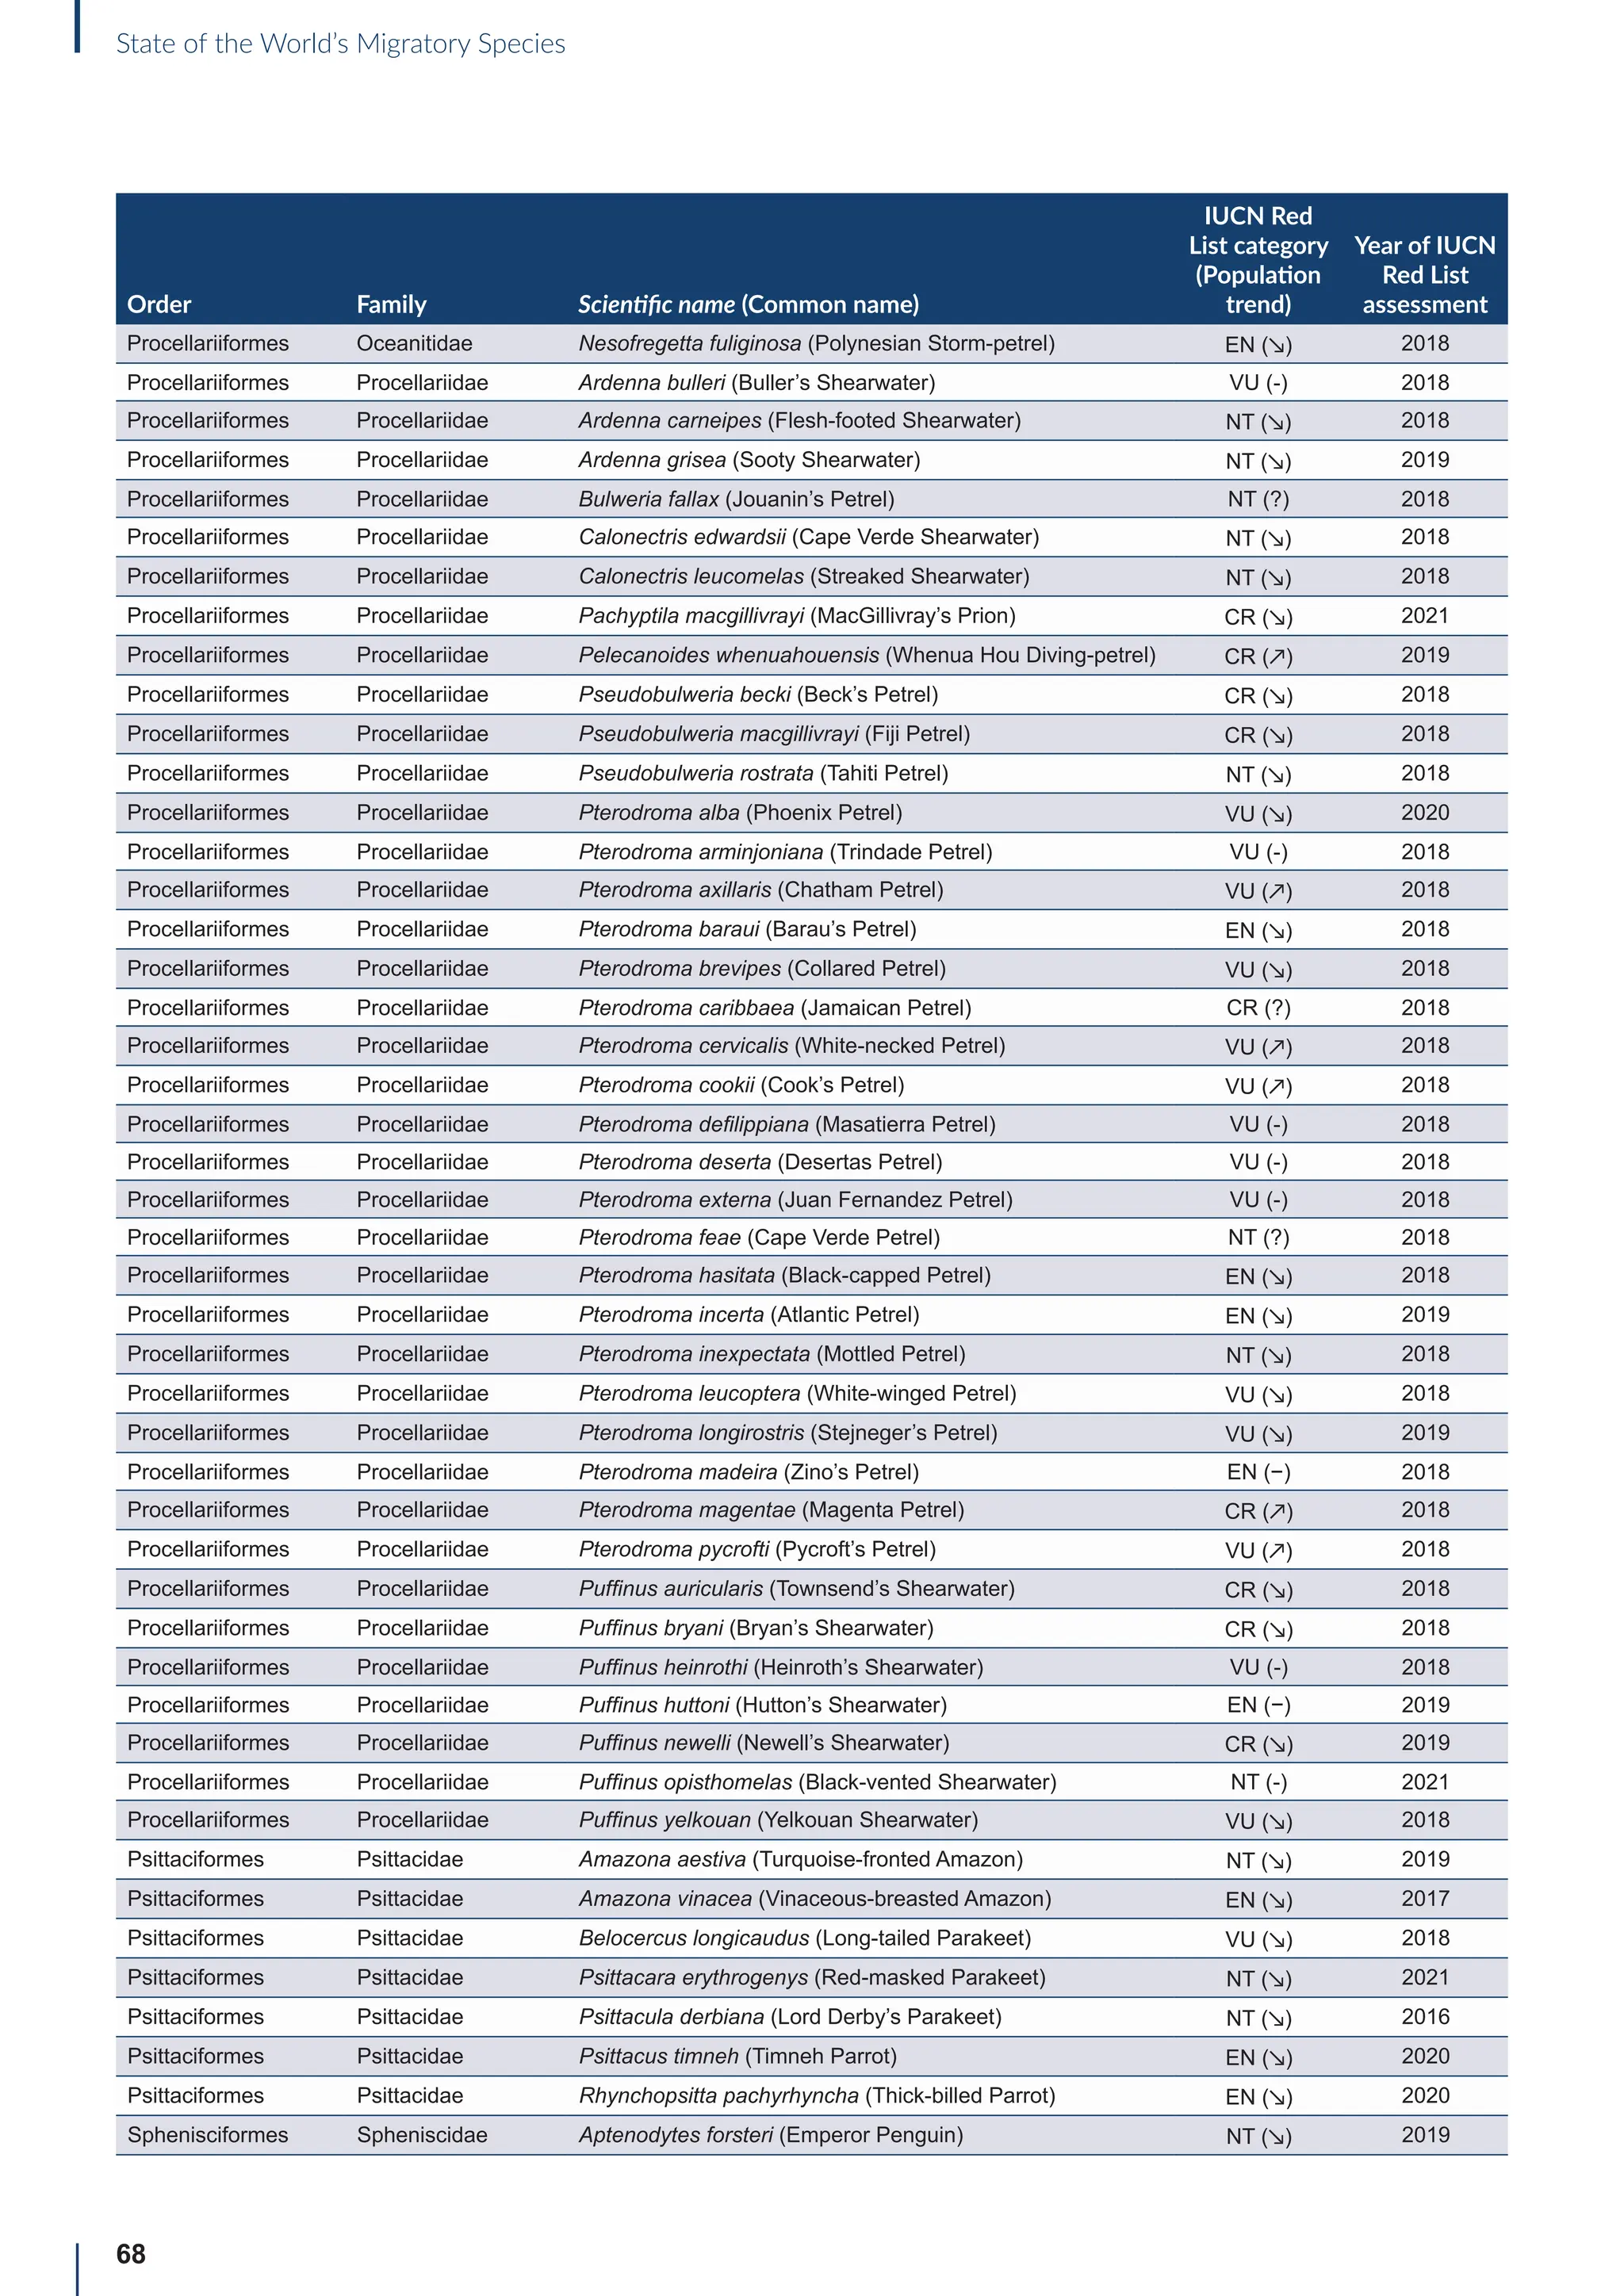
thousand cuts. Proceedings of the National Academy of Sciences of the
U.S.A, 118(2): e2023989118.
[15] Borgelt et al. 2022. More than half of data deficient species predicted to be
threatened by extinction. Communications Biology, 5: 679.](https://image.slidesharecdn.com/stateoftheworldsmigratoryspeciesreporte-240213173509-18b3a010/75/UN-Report-State-of-the-Worlds-Migratory-Species-report_E-pdf-69-2048.jpg)
![58
State of the World’s Migratory Species
III. Pressure – Threats to migratory species
Introduction
[1] Runge et al. 2014. Conserving mobile species. Frontiers in Ecology and
the Environment, 12(7): 395-402.
[2] Tobias and Pigot. 2019. Integrating behaviour and ecology into global
biodiversity conservation strategies. Philosophical Transactions of the
Royal Society B, 374(1781): 20190012.
[3] Barbarossa et al. 2020. Impacts of current and future large dams on the
geographic range connectivity of freshwater fish worldwide. Proceedings
of the National Academy of Sciences of the U.S.A, 117(7): 3648-3655.
[4] Kauffman et al. 2021. Mapping out a future for ungulate populations.
Science, 372(6542): 566-569.
[5] Burt et al. 2023. The effects of light pollution on migratory animal behavior.
Trends in Ecology Evolution, 3096.
[6] Aikens et al. 2022. Viewing migration through a social lens. Trends in
Ecology Evolution, 37(11), 985-996.
Overexploitation
[1] Jaureguiberry et al. 2022. The direct drivers of recent global
anthropogenic biodiversity loss. Science Advances, 8(45), eabm9982.
[2] UNEP-WCMC (2023). Review of direct use and trade for CMS Appendix I
taxa.
[3] Coad et al. 2021. Impacts of taking, trade and consumption of terrestrial
migratory species for wild meat. CMS, Bonn, Germany.
[4] Benítez-López et al. 2017. The impact of hunting on tropical mammal and
bird populations. Science, 356(6334): 180-183.
[5] Yong et al. 2021. The State of Migratory Landbirds in the East Asian
Flyway: Distributions, Threats, and Conservation Needs. Frontiers in
Ecology and Evolution, 9: 613172.
[6] Buchan et al. 2022. Spatially explicit risk mapping reveals direct
anthropogenic impacts on migratory birds. Global Ecology and
Biogeography, 31(9): 1707-1725.
[7] Lormée et al. 2020. Assessing the sustainability of harvest of the
European Turtle-dove along the European western flyway. Bird
Conservation International, 30(4): 506-521.
[8] Brochet et al. 2016. A preliminary assessment of the scope and scale of
illegal killing and taking of birds in the Mediterranean. Bird Conservation
International, 26(1): 1-28.
[9] Brochet et al. 2019. A preliminary assessment of the scope and scale of
illegal killing and taking of birds in the Arabian peninsula, Iran and Iraq.
Sandgrouse, 41: 154-175.
[10] Yong et al. 2022. The specter of empty countrysides and wetlands—
impact of hunting take on birds in Indo-Burma. Conservation Science and
Practice, 4(5): e212668.
[11] Atlantic Flyway Shorebird Initiative (AFSI). 2020. Actions for the Atlantic
Flyway Shorebird Initiative’s shorebird harvest working group 2020-2025.
Available at: https://www.shorebirdplan.org/wp-content/uploads/2020/09/
AFSI-Shorebird-Harvest-Action-Plan-2020_25-April-2020.pdf
[12] Yong et al. 2021. The state of migratory landbirds in the East Asian flyway:
distributions, threats, and conservation needs. Frontiers in Ecology and
Evolution, 9: 613172.
[13] Gallo-Cajiao et al. 2020. Extent and potential impact of hunting on migratory
shorebirds in the Asia-Pacific. Biological Conservation, 246: 108582.
[14] Ingram et al. 2022. Widespread use of migratory megafauna for aquatic wild
meat in the tropics and subtropics. Frontiers in Marine Science, 9: 837447.
[15] Dulvy et al. 2021. Overfishing drives over one-third of all sharks and rays
towards global extinction. Current Biology, 31(21): 4773-4787.
[16] Queiroz et al. 2019. Global spatial risk assessment of sharks under the
footprint of fisheries. Nature, 572(7770): 461–466.
[17] Pacoureau et al. 2021. Half a century of decline in oceanic sharks and
rays. Nature, 589(7843): 567-571.
[18] Kyne et al. 2020. The thin edge of the wedge: extremely high extinction
risk in wedgefishes and giant guitarfishes. Aquatic Conservation: Marine
and Freshwater Ecosystems, 30(7): 1337-1361.
[19] Dias et al. 2019. Threats to seabirds: a global assessment. Biological
Conservation, 237: 525-537.
[20] Croxall and Gales. 1998. An assessment of the conservation status of
albatrosses. In: Robertson, G.; Gales, R., (eds.) Albatross biology and
conservation. Chipping Norton, NSW, Surrey Beatty, pp. 46-65.
[21] Anderson et al. 2011. Global seabird bycatch in longline fisheries.
Endangered Species Research, 14: 91-106.
[22] Žydelis et al. 2013. The incidental catch of seabirds in gillnet fisheries: a
global review. Biological Conservation, 162: 76-78.
[23] Da Rocha et al. 2021. Reduction in seabird mortality in Namibian fisheries
following the introduction of bycatch regulation. Biological Conservation,
253: 108915.
Habitat loss, degradation and fragmentation
[1] IPBES. 2019. Global assessment report on biodiversity and ecosystem
services of the Intergovernmental Science-Policy Platform on Biodiversity
and Ecosystem Services. IPBES Secretariat, Bonn, Germany. 1148 pp.
[2] Jaureguiberry et al. 2022. The direct drivers of recent global
anthropogenic biodiversity loss. Science Advances, 8(45): eabm9982.
[3] WWF. 2022. Living Planet Report 2022 – Building a nature-positive
society. WWF, Gland, Switzerland. 115 pp.
[4] Holdo et al. 2011. Predicted impact of barriers to migration on the
Serengeti wildebeest population. PloS one, 6(1): e16370.
[5] Msoffe et al. 2019. Wildebeest migration in East Africa: Status, threats and
conservation measures. BioRxiv: 546747.
[6] Veldhuis et al. 2019. Cross-boundary human impacts compromise the
Serengeti-Mara ecosystem. Science, 363(6434): 1424-1428.
[7] Pike et al. 2020. Anguilla anguilla. The IUCN Red List of Threatened
Species 2020: e.T60344A152845178. https://dx.doi.org/10.2305/IUCN.
UK.2020-2.RLTS.T60344A152845178.en.
[8] Belletti et al. 2020. More than one million barriers fragment Europe’s
rivers. Nature, 588: 436-441.
[9] Grech et al. 2012. A comparison of threats, vulnerabilities and
management approaches in global seagrass bioregions. Environmental
Research Letters, 7(2): 024006.
[10] Kendrick et al. 2019. A systematic review of how multiple stressors from
an extreme event drove ecosystem-wide loss of resilience in an iconic
seagrass community. Frontiers in Marine Science, 6: 455
[11] Heng et al. 2022. Dugong feeding grounds and spatial feeding patterns in
subtidal seagrass: A case study at Sibu Archipelago, Malaysia. Estuarine,
Coastal and Shelf Science, 264: 107670.
[12] Hallworth et al. 2021. Habitat loss on the breeding grounds is a major
contributor to population declines in a long-distance migratory songbird.
Proceedings of the Royal Society B, 288(1949): 20203164.
[13] Williams et al. 2021. Habitat loss on seasonal migratory range imperils an
endangered ungulate. Ecological Solutions and Evidence, 2(1): e12039.
[14] Tucker et al. 2018. Moving in the Anthropocene: global reductions in
terrestrial mammalian movements. Science 359(6374): 466-496.
[15] Hilty et al. 2020. Guidelines for conserving connectivity through ecological
networks and corridors. Best Practice Protected Area Guidelines Series
No. 30. Gland, Switzerland: IUCN.
[16] Bauer and Hoye. 2014. Migratory animals couple biodiversity and
ecosystem functioning worldwide. Science, 344(6179): 1242552.
[17] Kavwele et al. 2022. Non‐local effects of human activity on the spatial
distribution of migratory wildlife in Serengeti National Park, Tanzania.
Ecological Solutions and Evidence, 3(3): e12159.
[18] Liu et al. 2020. Transboundary frontiers: an emerging priority for
biodiversity conservation. Trends in Ecology Evolution, 35(8): 679-690.
[19] Titley et al. 2021. Global inequities and political borders challenge nature
conservation under climate change. Proceedings of the National Academy
of Sciences of the U.S.A, 118(7): e2011204118.
[20] Deinet et al. 2020. The Living Planet Index (LPI) for migratory freshwater
fish - Technical Report. World Fish Migration Foundation, The Netherlands.
[21] Grill et al. 2019. Mapping the world’s free-flowing rivers. Nature,
569(7755): 215-221.
[22] Gubiani et al. 2007. Persistence of fish populations in the upper Paraná River:
effects of water regulation by dams. Ecology of Freshwater Fish, 16: 161-197.
[23] Barbarossa et al. 2020. Impacts of current and future large dams on the
geographic range connectivity of freshwater fish worldwide. Proceedings
of the National Academy of Sciences of the U.S.A, 117: 3648-3655.](https://image.slidesharecdn.com/stateoftheworldsmigratoryspeciesreporte-240213173509-18b3a010/75/UN-Report-State-of-the-Worlds-Migratory-Species-report_E-pdf-70-2048.jpg)
![59
State of the World’s Migratory Species
[24] Burger et al. 2019. A novel approach for assessing effects of ship traffic
on distributions and movements of seabirds. Journal of Environmental
Management, 251: 109511.
[25] Fliessbach et al. 2019. A ship traffic disturbance vulnerability index for
Northwest European seabirds as a tool for marine spatial planning.
Frontiers in Marine Science, 6: 192.
[26] Mayaud et al. 2022. Traffic in a nursery: Ship strike risk from commercial
vessels to migrating humpback whales (Megaptera novaeangliae) in a rapidly
developing Australian urban embayment. Marine Policy, 146: 105332.
[27] Womersley et al. 2022. Global collision-risk hotspots of marine traffic
and the world’s largest fish, the whale shark. Proceedings of the National
Academy of Sciences, 119(20): e2117440119.
[28] Martin Martin, J., Garrido Lopez, J.R., Clavero Sousa, H. and Barrios,
V. (eds.) 2022. Wildlife and power lines. Guidelines for preventing and
mitigating wildlife mortality associated with electricity distribution networks.
Gland, Switzerland: IUCN. https://doi.org/10.2305/IUCN.CH.2022.10.en.
[29] Cramer et al. 2015. ‘Transportation and large herbivores’. In: van der Ree,
R., Smith, D.J., and Grilo, C. (eds.) Handbook of Road Ecology. Oxford,
UK, John Wiley and Sons Ltd. 344-353.
[30] Mendgen et al. 2023. Nomadic ungulate movements under threat:
Declining mobility of Mongolian gazelles in the Eastern Steppe. Biological
Conservation, 286: 110271.
[31] Aikens et al. 2022. Industrial energy development decouples ungulate
migration from the green wave. Nature Ecology and Evolution,
6(11):1733–1741.
[32] Kauffman et al. 2021. Causes, consequences, and conservation of
ungulate migration. Annual Review of Ecology, Evolution and Systematics,
52: 453-478.
[33] Potapov. et al. 2022. Global maps of cropland extent and change show
accelerated cropland expansion in the twenty-first century. Nature Food,
3(1): 19-28.
[34] Ritchie. 2019. Half of the world’s habitable land is used for agriculture.
Our World in Data. Available at: https://ourworldindata.org/global-land-for-
agriculture. [Accessed 06/03/2023].
[35] Wagner et al. 2021. Insect decline in the Anthropocene: death by a
thousand cuts. Proceedings of the National Academy of Sciences of the
U.S.A., 118(2): e2023989118.
[36] Vickery et al. 2023. The conservation of Afro-Palaearctic migrants: What
we are learning and what we need to know? Ibis. https://doi.org/10.1111/
ibi.13171
[37] Murray et al. 2014. Tracking the rapid loss of tidal wetlands in the Yellow
Sea. Frontiers in Ecology and the Environment, 12(5): 267-272.
[38] Studds et al. 2017. Rapid population decline in migratory shorebirds
relying on Yellow Sea tidal mudflats as stopover sites. Nature
Communications, 8(1): 14895.
[39] Frick et al. 2020. A review of the major threats and challenges to global bat
conservation. Annals of the New York Academy of Sciences, 1469(1): 5-25.
Climate change
[1] IPBES. 2019. Summary for policymakers of the global assessment
report on biodiversity and ecosystem services of the Intergovernmental
Science-Policy Platform on Biodiversity and Ecosystem Services. IPBES
Secretariat, Bonn, Germany. 56 pp.
[2] UNEP/CMS. 2006. Migratory Species and Climate Change: Impacts of a
Changing Environment on Wild Animals. UNEP/ CMS Secretariat, Bonn,
Germany. 68 pages.
[3] Tombre et al. 2019. Northward range expansion in spring‐staging barnacle
geese is a response to climate change and population growth, mediated
by individual experience. Global Change Biology, 25(11): 3680-3693
[4] CMS. 2022. Fact Sheet on Migratory Species and Climate Change. CMS
Secretariat, 2 pp.
[5] Festa et al. 2022. Bat responses to climate change: a systematic review.
Biological Reviews, 98: 19-33.
[6] Robinson et al. 2009. Travelling through a warming world: climate change
and migratory species. Endangered Species Research, 7(2): 87-99.
[7] Hoffmann et al. 2019. Predicted climate shifts within terrestrial protected
areas worldwide. Nature Communications, 10(1): 4787.
[8] Kebke et al. 2022. Climate change and cetacean health: impacts and
future directions. Philosophical Transactions of the Royal Society B,
377(1854): 20210249.
[9] CMS. 2021. Discussion paper for the Scientific Council on Decision
13.128: Climate change and migratory species (Prepared by the COP-
appointed Councillor for Climate Change). UNEP/CMS/ScC-SC5/
Doc.6.4.5. Bonn, Germany.
[10] Chambault et al. 2020. The impact of rising sea temperatures on an Arctic
top predator, the narwhal. Scientific Reports, 10(1): 1-10
[11] Mayor et al. 2017. Increasing phenological asynchrony between spring
green-up and arrival of migratory birds. Scientific Reports, 7(1): 1-10.
[12] Renner and Zohner 2018. Climate change and phenological mismatch
in trophic interactions among plants, insects, and vertebrates. Annual
Review of Ecology, Evolution, and Systematics, 49(1): 165-182.
[13] Møller et al. 2008. Populations of migratory bird species that did not show
a phenological response to climate change are declining. Proceedings of
the National Academy of Sciences, 105(42): 16195-16200.
[14] Lameris et al. 2018. Arctic geese tune migration to a warming climate but still
suffer from a phenological mismatch. Current Biology, 28(15): 2467-2473.
[15] Jensen et al. 2018. Environmental warming and feminization of one of the
largest sea turtle populations in the world. Current Biology, 28(1): 154-159.
[16] Maurer et al., 2021. Population viability of sea turtles in the context of
global warming. BioScience, 71(8): 790-804.
[17] Blechschmidt et al. 2020. Climate change and green sea turtle sex ratio—
preventing possible extinction. Genes, 11(5): 588
[18] Woodroffe,. et al. 2017. Hot dogs: High ambient temperatures impact
reproductive success in a tropical carnivore. Journal of Animal Ecology,
86(6): 1329-1338.
Pollution
[1] WWF. 2020. Living Planet Report: Bending the curve of biodiversity loss.
Almond, R. E. A., Grooten, M. and Petersen, T. (Eds.) Gland, Switzerland: WWF.
[2] Jaureguiberry et al. 2022. The direct drivers of recent global
anthropogenic biodiversity loss. Science Advances, 8(45): eabm9982.
[3] Kyba et al. 2017. Artificially lit surface of Earth at night increasing in
radiance and extent. Science Advances, 3(11): e1701528.
[4] Falchi et al. 2016. The new world atlas of artificial night sky brightness.
Science Advances 2(6): e1600377.
[5] Burt et al. 2023. The effects of light pollution on migratory animal behavior.
Trends in Ecology Evolution, S0169534722003329.
[6] Van Doren et al. 2021. Drivers of fatal bird collisions in an urban center.
Proceedings of the National Academy of Sciences of the U.S.A, 118(24):
e2101666118.
[7] Cabrera-Cruz et al. 2018. Light pollution is greatest within passage areas
for nocturnally-migrating birds around the world. Scientific Reports, 8: 3261.
[8] Price et al. 2018. Exploring The Role of Artificial Lighting in Loggerhead
Turtle (Caretta caretta) Nest-Site Selection and Hatchling Disorientation.
Herpetological Conservation and Biology, 13(2): 415–422.
[9] Kunc, H. P. and Schmidt, R. (2019). The effects of anthropogenic noise on
animals: A meta-analysis. Biology Letters, 15: 20190649.
[10] Duarte et al. 2021. The soundscape of the Anthropocene ocean. Science,
371:(6259), eaba4658.
[11] Jalkanen et al. 2022. Underwater noise emissions from ships during
2014–2020. Environmental Pollution, 311: 119766.
[12] Williams et al. 2021. Reducing vessel noise increases foraging in
endangered killer whales. Marine Pollution Bulletin, 173: 112976.
[13] Wisniewska et al. 2018. High rates of vessel noise disrupt foraging in wild
harbour porpoises. Proc. R. Soc. B, 285, 20172314.
[14] DeRuiter et al. 2013. First direct measurements of behavioural responses
by Cuvier’s beaked whales to mid-frequency active sonar. Biology Letters,
9: 20130223.
[15] Simonis et al. 2020. Co-occurrence of beaked whale strandings and naval
sonar in the Mariana Islands, Western Pacific. Proc. R. Soc. B, 287: 20200070.
[16] Allen et al. 2021. Noise distracts foraging bats. Proc. R. Soc. B. 288:
20202689.
[17] Kühn and van Franeker. 2020. Quantitative overview of marine debris
ingested by marine megafauna. Marine Pollution Bulletin, 151, 110858.
[18] Geyer et al. 2017. Production, use, and fate of all plastics ever made.
Science Advances, 3: e1700782.
[19] Law. 2017. Plastics in the Marine Environment. Annual Review of Marine
Science, 9: 205–229.
[20] CMS. 2021. Impacts of plastic pollution on freshwater aquatic, terrestrial
and avian migratory species in the Asia and Pacific region.
[21] Gilman et al. 2021. Highest risk abandoned, lost and discarded fishing
gear. Scientific Reports, 11: 7195.
[22] Høiberg et al., 2022. Global distribution of potential impact hotspots for
marine plastic debris entanglement. Ecological Indicators, 135: 108509
[23] Wabnitz and Nichols. 2010. Editorial: Plastic Pollution: An Ocean
Emergency. Marine Turtle Newsletter, 129: 1–4.](https://image.slidesharecdn.com/stateoftheworldsmigratoryspeciesreporte-240213173509-18b3a010/75/UN-Report-State-of-the-Worlds-Migratory-Species-report_E-pdf-71-2048.jpg)
![60
State of the World’s Migratory Species
[24] Roman et al. 2020. Plastic ingestion is an underestimated cause of death
for southern hemisphere albatrosses. Conservation Letters, 14: e12785.
[25] Richard et al. 2021. Warning on nine pollutants and their effects on avian
communities. Global Ecology and Conservation, 32: e01898.
[26] International Whaling Commission. 2018. State of the Cetacean
Environment Report (SOCER) Global Compendium 2014-2018.
Cambridge, United Kingdom.
[27] Pain et al. 2019. Effects of lead ammunition on birds and other wildlife: a
review and update. Ambio: 48, 935-953.
[28] Andreotti et al. 2017. Economic assessment of wild bird mortality induced
by the use of lead gunshot in European wetlands. Science of the Total
Environment, 610-611: 1505-1513.
[29] Directorate-General for Environment. 2023. New rules banning hunting
birds with lead shot in wetlands take full effect. Available at: https://
environment.ec.europa.eu/news/new-rules-banning-hunting-birds-lead-
shot-wetlands-take-full-effect-2023-02-16_en [Accessed: 06/03/2023].
[30] Plaza et al. 2018. A review of lead contamination in South American birds:
the need for more research and policy changes. Perspectives in Ecology
and Conservation, 16(4): 201-207.
[31] Deepwater Horizon Natural Resource Damage Assessment Trustees. 2016.
Deepwater Horizon oil spill: Final Programmatic Damage Assessment and
Restoration Plan and Final Programmatic Environmental Impact Statement.
Available at: http://www.gulfspillrestoration.noaa.gov/restoration-planning/
gulf-plan
[32] Haney et al. 2014. Bird mortality from the Deepwater Horizon oil spill. II.
Carcass sampling and exposure probability in the coastal Gulf of Mexico.
Marine Ecology Progress Series, 513: 239-252.
[33] Esler et al. 2018. Timelines and mechanisms of wildlife population
recovery following the Exxon Valdez oil spill. Deep Sea Research Part II:
Topical Studies in Oceanography, 147: 36-42.
[34] Helm et al. 2014. Overview of Effects of Oil Spills on Marine Mammals. In:
Handbook of Oil Spill Science and Technology, M. Fingas (Ed.).
[35] Ashraf. 2017. Persistent organic pollutants (POPs): A global issue, a
global challenge. Environmental Science and Pollution Research, 24(5):
4223–4227.
[36] UNEP. 2023. Why do persistent organic pollutants matter? Available at:
https://www.unep.org/explore-topics/chemicals-waste/what-we-do/persistent-
organic-pollutants/why-do-persistent-organic. [Accessed: 06/03/2023].
[37] Travis et al. 2020. Evidence of continued exposure to legacy persistent
organic pollutants in threatened migratory common terns nesting in the
Great Lakes. Environment International, 144: 106065.
[38] Lehikoinen et al., 2016. Habitat‐specific population trajectories in boreal
waterbirds: Alarming trends and bioindicators for wetlands. Animal
Conservation, 19(1): 88-95.
[39] Wagner et al., 2021. Insect decline in the Anthropocene: Death by a
thousand cuts. Proceedings of the National Academy of Sciences of the
U.S.A, 118(2): e2023989118.
[40] Grames et al. 2023. The effect of insect food availability on songbird
reproductive success and chick body condition: Evidence from a
systematic review and meta-analysis. Ecology Letters, 00: 1– 16.
[41] Hallmann et al. 2014. Declines in insectivorous birds are associated with
high neonicotinoid concentrations. Nature, 511: 341-343.
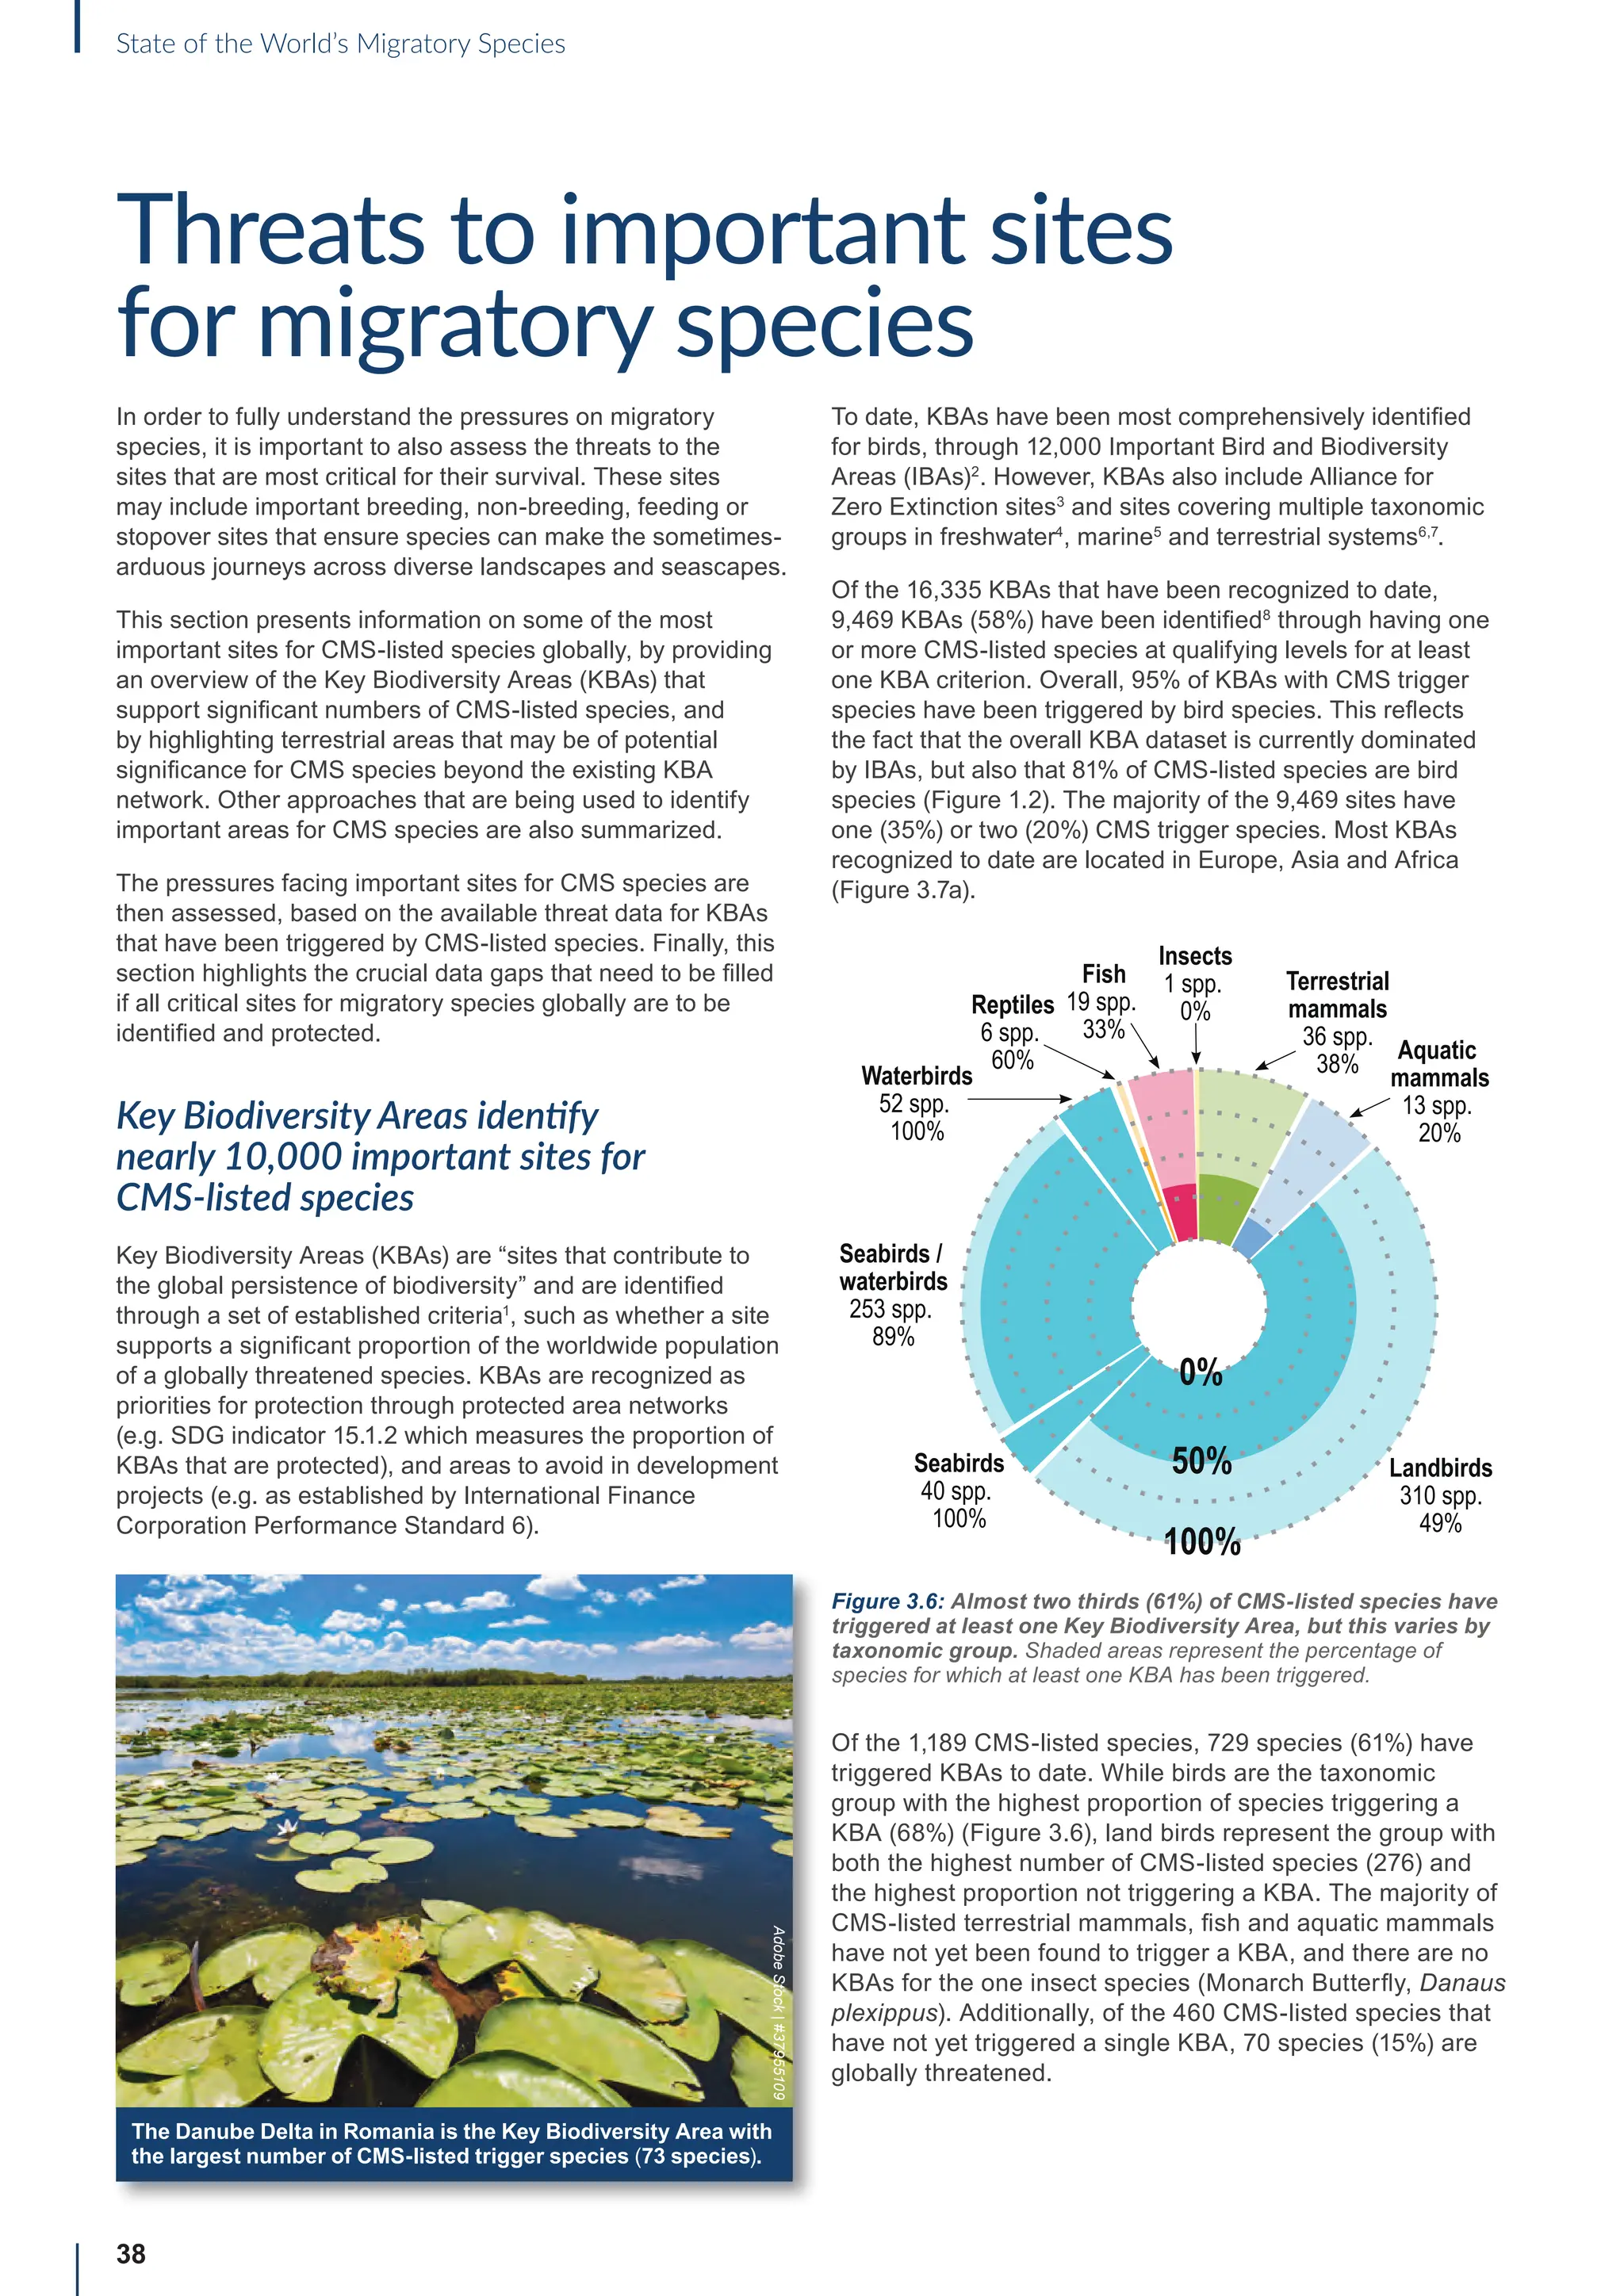
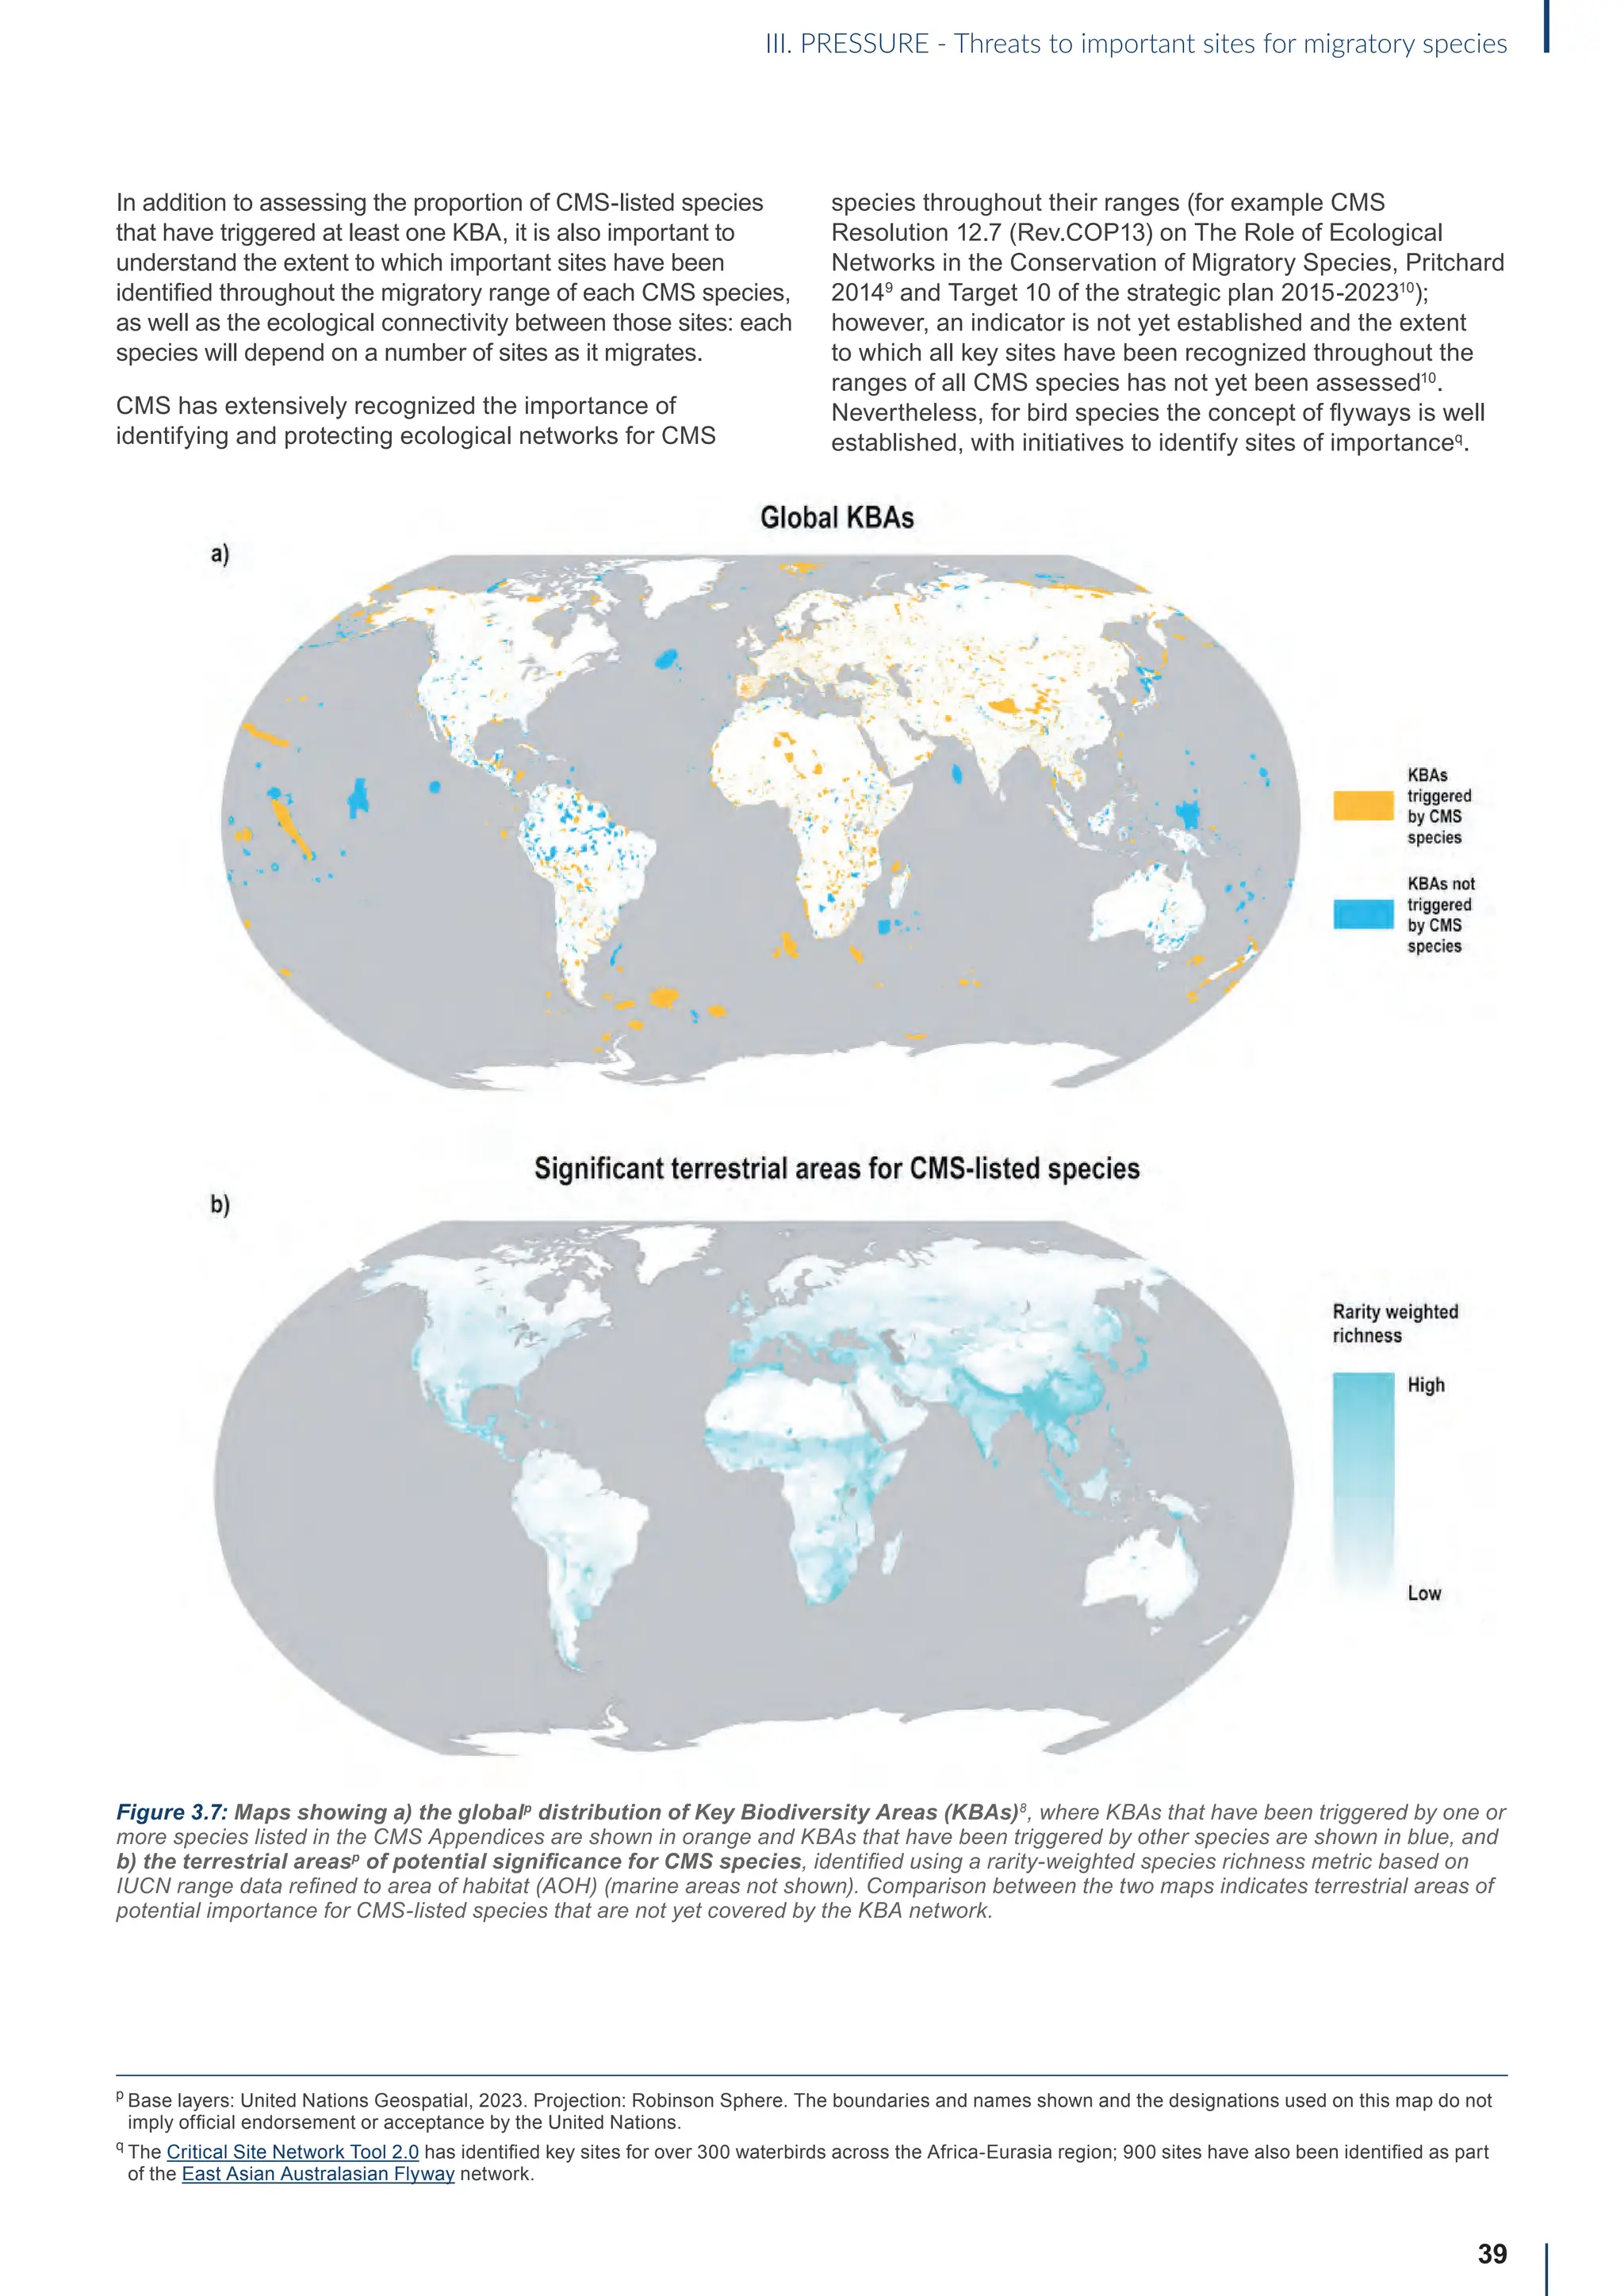
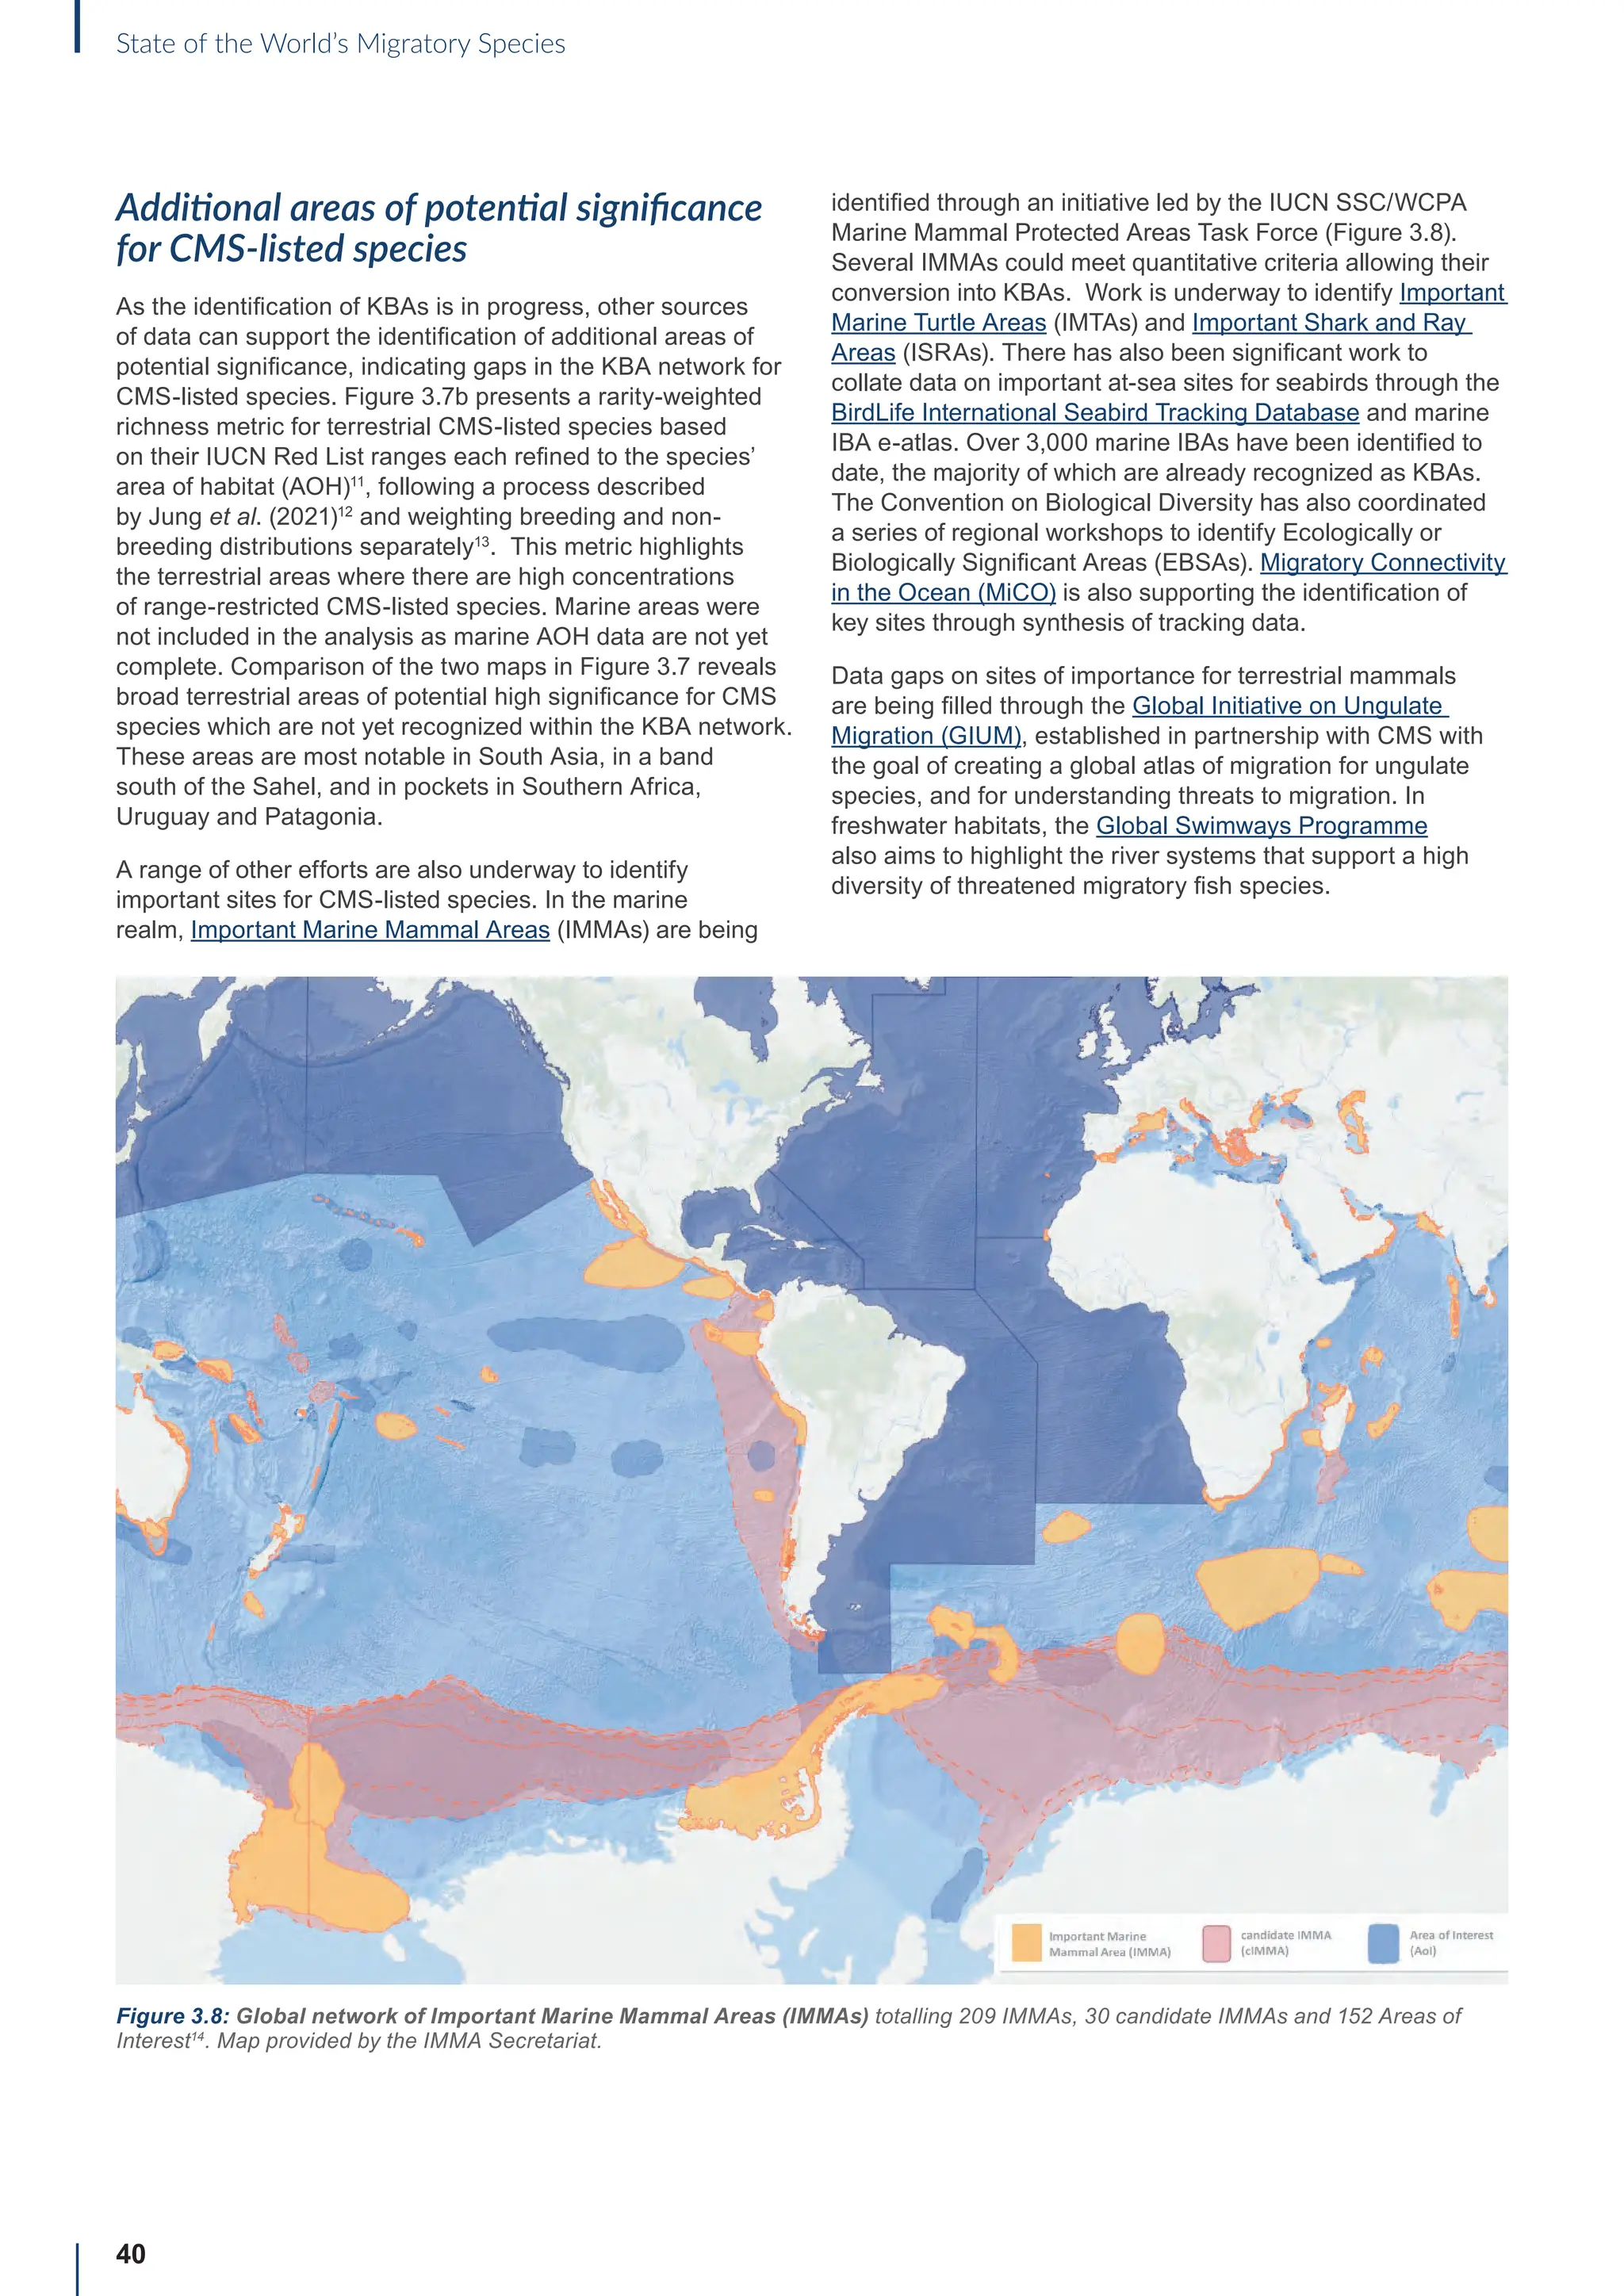
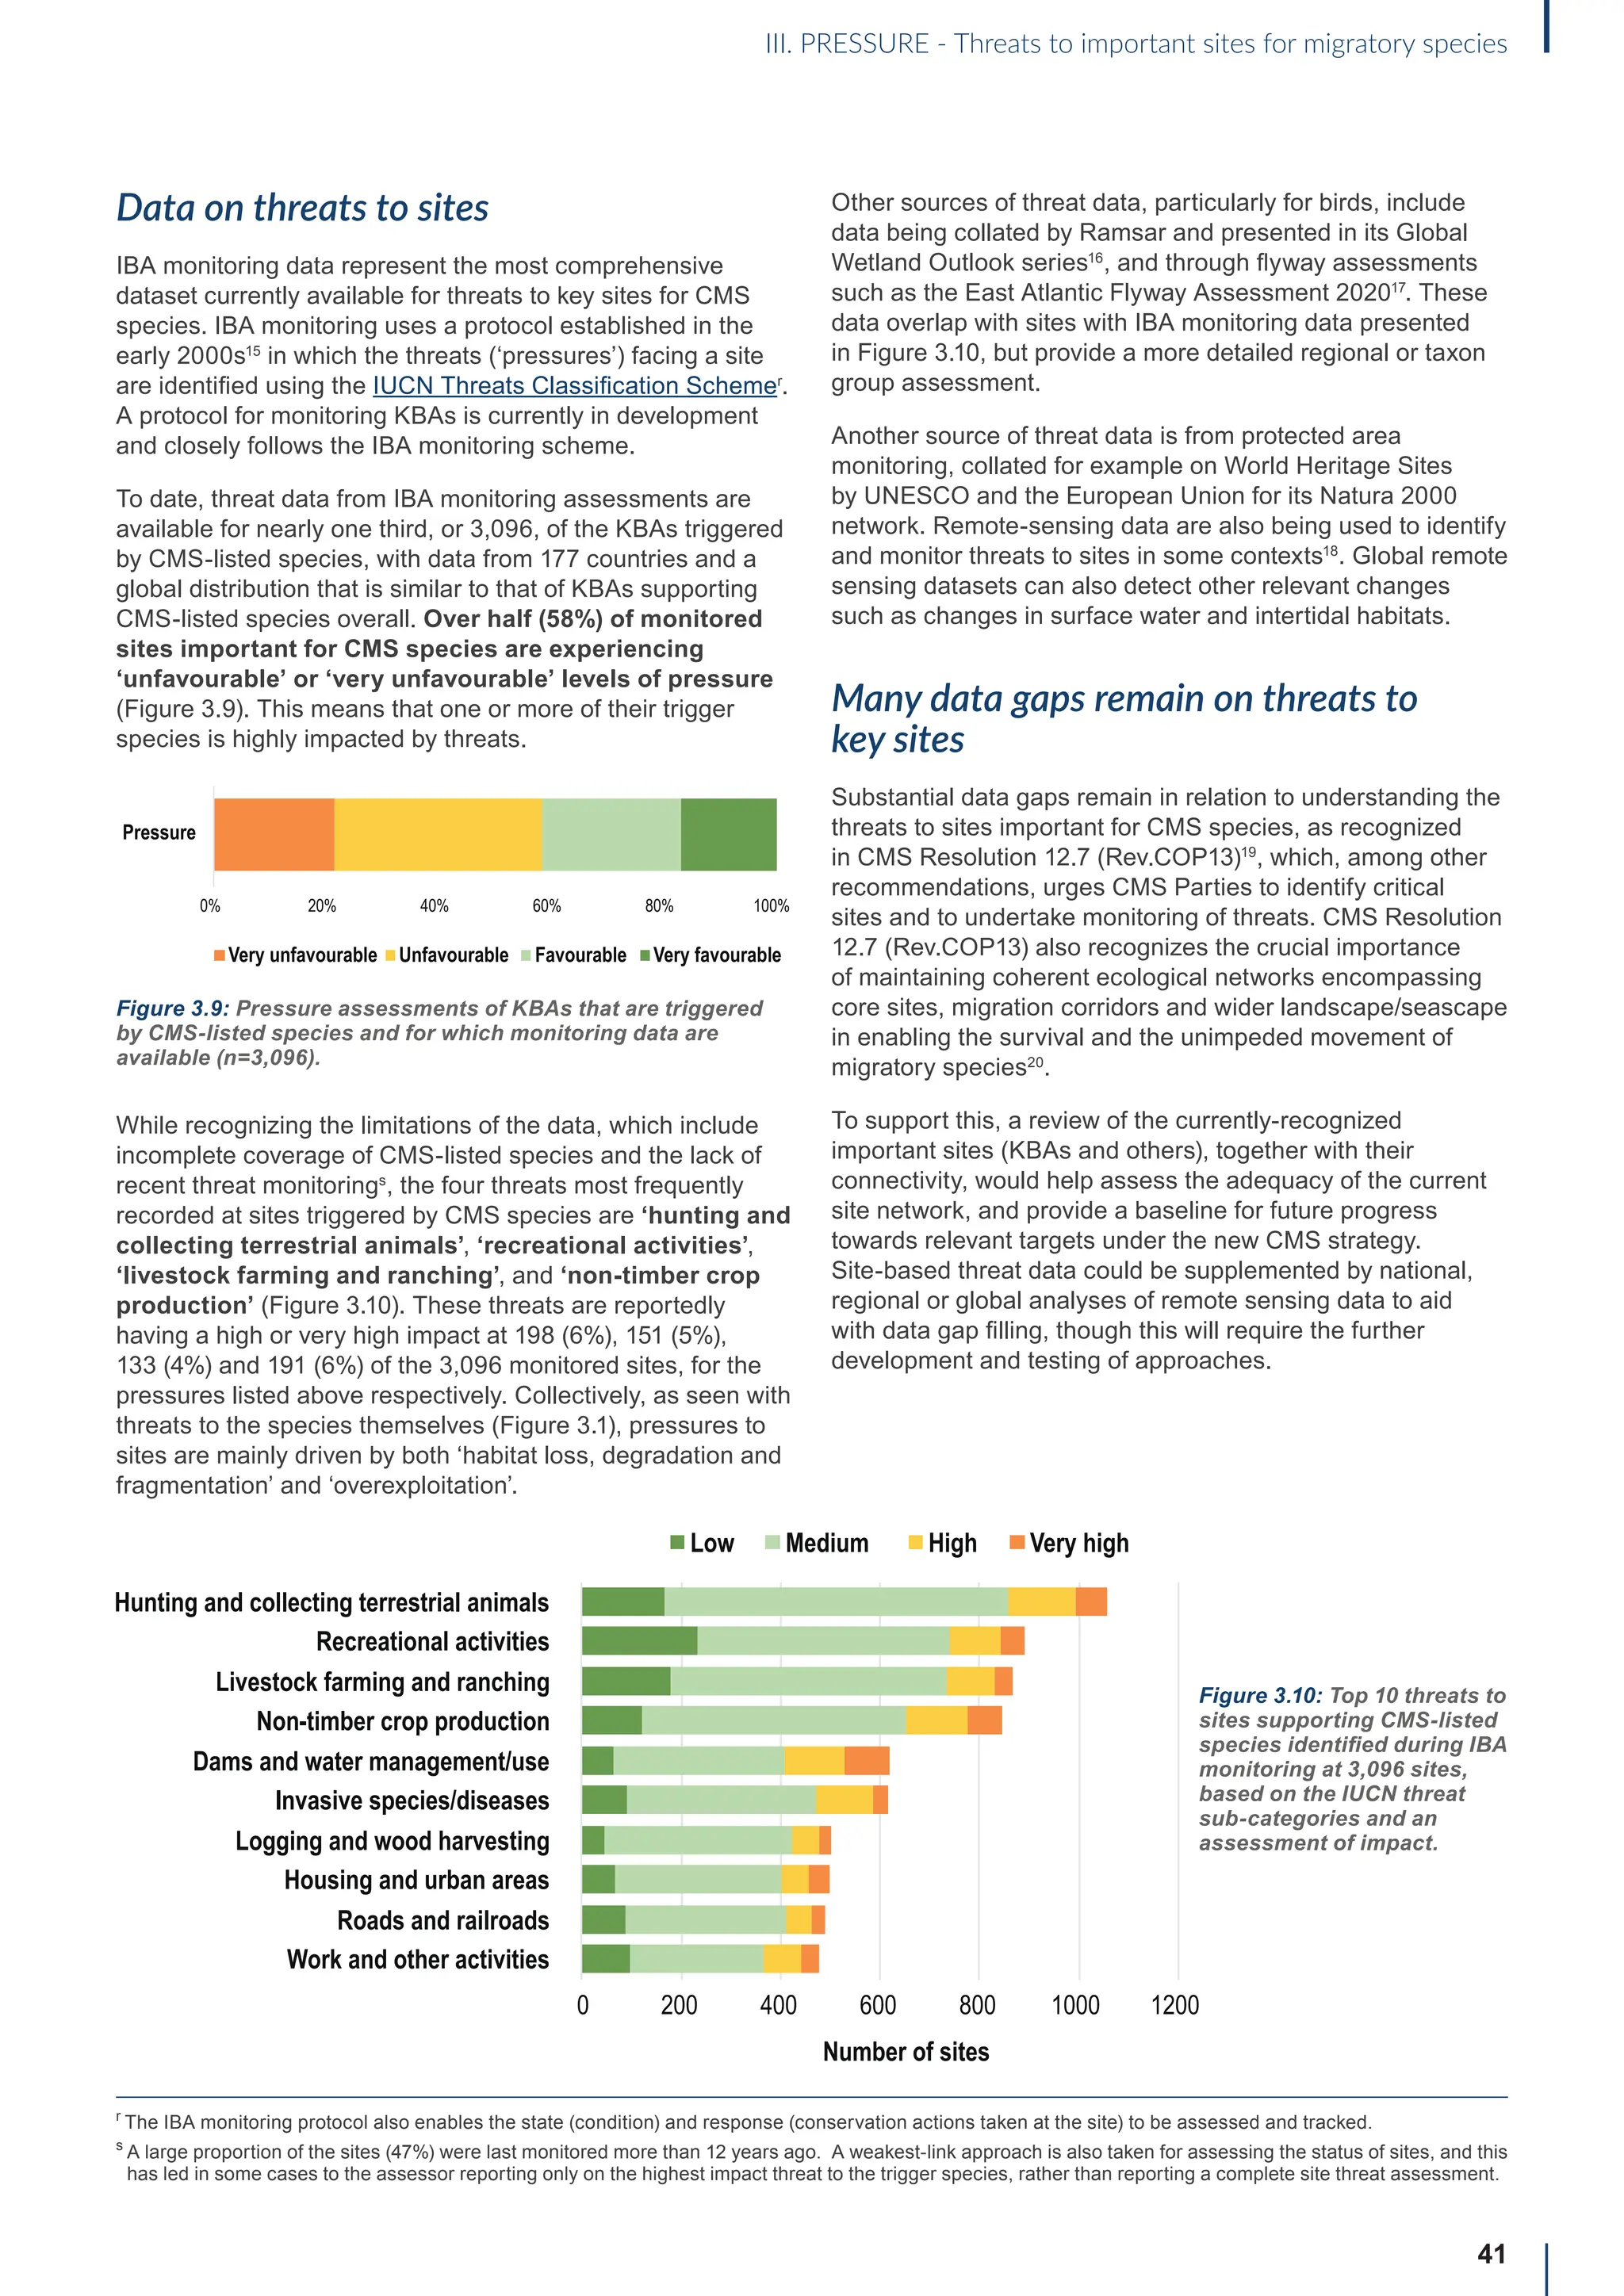
Threats to important sites for migratory species
[1] IUCN. 2016. A Global Standard for the Identification of Key Biodiversity
Areas, Version 1.0. First edition. Gland, Switzerland: IUCN.
[2] Donald et al. 2019. Important Bird and Biodiversity Areas (IBAs): the
development and characteristics of a global inventory of key sites for
biodiversity. Bird Conservation International, 29: 177-198.
[3] Ricketts et al. 2005. Pinpointing and preventing imminent extinctions.
Proceedings of the National Academy of Sciences of the U.S.A., 102:
18497–18501.
[4] Holland et al. 2012. Conservation priorities for freshwater biodiversity: the
key biodiversity area approach refined and tested for continental Africa.
Biological Conservation, 148: 167-179.
[5] Edgar et al. 2008. Key Biodiversity Areas as globally significant
target sites for the conservation of marine biological diversity. Aquatic
Conservation: Marine and Freshwater Ecosystems, 18: 969–983.
[6] Eken et al. 2004. Key biodiversity areas as site conservation targets.
BioScience 54: 1110–1118.
[7] Langhammer et al. 2007. Identification and Gap Analysis of Key
Biodiversity Areas: Targets for Comprehensive Protected Area Systems.
IUCN World Commission on Protected Areas Best Practice Protected
Area Guidelines Series No. 15. Gland, Switzerland: IUCN.
[8] BirdLife International. 2023. The World Database of Key Biodiversity Areas.
Developed by the KBA Partnership: BirdLife International, International
Union for the Conservation of Nature, Amphibian Survival Alliance,
Conservation International, Critical Ecosystem Partnership Fund, Global
Environment Facility, Re:wild, NatureServe, Rainforest Trust, Royal Society
for the Protection of Birds, Wildlife Conservation Society and World Wildlife
Fund. Available at: www.keybiodiversityareas.org. [Accessed 01/09/2022].
[9] UNEP/CMS/COP11/Doc.23.4.1.2/Annex.
[10] UNEP/CMS/Resolution 11.2.
[11] Brooks et al. 2019. Measuring terrestrial area of habitat (AoH) and its
utility for the IUCN Red List. Trends in Ecology Evolution, 34: 977-986.
[12] Jung et al. 2021. Areas of global importance for conserving terrestrial
biodiversity, carbon and water. Nature Ecology Evolution, 5: 1-11.
[13] Hill et al. 2019. Measuring forest biodiversity status and changes globally.
Frontiers in Forests and Global Change, 2: 70.
[14] IUCN Marine Mammal Protected Areas Task Force. 2022. Final Report of the
8th IMMA Workshop: Important Marine Mammal Area Regional Workshop for
the South East Tropical and Temperate Pacific Ocean, 6-10 June 2022.
[15] Mwangi et al. 2014. Tracking trends in key sites for biodiversity: a
case study using Important Bird Areas in Kenya. Bird Conservation
International, 20: 215–230.
[16] Convention on Wetlands. 2021. Global Wetland Outlook: Special Edition
2021. Gland, Switzerland: Secretariat of the Convention on Wetlands.
[17] van Roomen et al. 2022. East Atlantic Flyway Assessment 2020. The
status of coastal waterbird populations and their sites. Wadden Sea
Flyway Initiative p/a CWSS, Wilhelmshaven, Germany, Wetlands
International, Wageningen, The Netherlands, BirdLife International,
Cambridge, United Kingdom.
[18] Beresford et al. 2020. Repeatable and standardized monitoring of threats
to Key Biodiversity Areas in Africa using Google Earth Engine. Ecological
Indicators, 109: 105763.
[19] UNEP/CMS/Resolution 12.7.
[20] UNEP/CMS/Resolution 12.7 (Rev.COP13).
IV. Response
- Actions to conserve migratory species and their habitats
Reducing overexploitation, including mitigating incidental catch of non-target species
[1] Coad et al. 2021. Impacts of taking, trade and consumption of
terrestrial migratory species for wild meat. CMS, Bonn, Germany.
[2] Ingram et al. 2021. Wild Meat Is Still on the Menu: Progress in Wild Meat
Research, Policy, and Practice from 2002 to 2020. Annual Review of
Environment and Resources, 46: 221-254.
[3] Yong et al. 2021. The state of migratory landbirds in the East Asian flyway:
Distributions, threats, and conservation needs. Frontiers in Ecology and
Evolution, 9: 1–22.
[4] Buchan et al. 2022. Spatially explicit risk mapping reveals direct
anthropogenic impacts on migratory birds. Global Ecology and
Biogeography, 31 (9): 1707–1725.
[5] Shester et al. 2011. Conservation challenges for small-scale fisheries:
Bycatch and habitat impacts of traps and gillnets. Biological Conservation,
144 (5): 1673-1681.
[6] Brochet, et al. Preliminary assessment of the scope and scale of illegal
killing and taking of birds in the Mediterranean. Bird Conservation
International 26: 1–28.
[7] UNEP/CMS. 2014. UNEP/CMS Resolution 11.16 on the Prevention
of Illegal Killing, Taking and Trade of Migratory Birds adopted by the
Conference of the Parties at its 11th Meeting (Quito, 4-9 November 2014).
[8] Directorate of Democratic Participation of the Council of Europe and CMS
Secretariat. 2019. Rome Strategic Plan 2020-2030: Eradicating illegal killing,
taking and trade in wild birds in Europe and the Mediterranean region.](https://image.slidesharecdn.com/stateoftheworldsmigratoryspeciesreporte-240213173509-18b3a010/75/UN-Report-State-of-the-Worlds-Migratory-Species-report_E-pdf-72-2048.jpg)
![61
State of the World’s Migratory Species
[9] CMS Secretariat. 2021. Updated assessment of the 2nd National
Scoreboard reporting by contracting Parties to the Bern Convention and
Members of the CMS Intergovernmental Task Force on Illegal Killing,
Taking and Trade of Migratory Birds in the Mediterranean. in Joint
Meeting of the Bern Convention Network of Special Focal Points on
Eradication of Illegal Killing, Trapping and Trade in Wild Birds and the
CMS Intergovernmental Task Force on Illegal Killing, Taking and Trade of
Migratory Birds in the Mediterranean 57.
[10] Shialis and Charalambides. 2023. Update on illegal bird trapping activity in
Cyprus. BirdLife Cyprus.
[11] Kamp et al. 2015. Global population collapse in a superabundant
migratory bird and illegal trapping in China. Conservation Biology, 29,
1684–1694.
[12] Yong et al. 2018. Challenges and opportunities for transboundary
conservation of migratory birds in the East Asian-Australasian flyway.
Conservation Biology, 32: 740–743.
[13] CMS. 2017. Intergovernmental Task Force to Address Illegal Hunting,
Taking and Trade of Migratory Birds in the East Asian-Australasian Flyway
(ITTEA).
[14] Johnson et al. 2016. Development of an adaptive harvest management
program for Taiga Bean Geese. in 1st Meeting of the AEWA European
Goose Management International Working Group 29.
[15] CMS. 2017. CMS National Legislation Programme. https://www.cms.int/
en/activities/national-legislation-programme.
[16] Marcacci et al. 2022. A roadmap integrating research, policy, and actions
to conserve Afro-Palearctic migratory landbirds at a flyway scale.
Conservation Letters, 16: e12933.
[17] Jiguet et al. 2019. Unravelling migration connectivity reveals unsustainable
hunting of the declining ortolan bunting. Science Advances, 5: eaau2642.
[18] Lewison et al. 2014. Global patterns of marine mammal, seabird, and sea
turtle bycatch reveal taxa-specific and cumulative megafauna hotspots.
Proceedings of the National Academy of Sciences of the U.S.A, 111 (14):
5271-5276
[19] Oliver et al. 2015. Global patterns in the bycatch of sharks and rays.
Marine Policy, 54: 86-97.
[20] Swimmer et al. 2020. Bycatch mitigation of protected and threatened
species in tuna purse seine and longline fisheries. Endangered Species
Research, 43: 517-542.
[21] Bache, S. 2002. Turtles, tuna and treaties: Strengthening the links
between international fisheries management and marine species
conservation. Journal of International Wildlife Law Policy, 5: 49–64.
[22] Reeves et al. 2013. Marine mammal bycatch in gillnet and other entangling
net fisheries, 1990 to 2011. Endangered Species Research, 20, 71–97.
[23] Rousseau et al. 2019. Evolution of global marine fishing fleets and the
response of fished resources. Proceedings of the National Academy of
Sciences of the U.S.A. 116: 12238–12243.
[24] Bielli et al 2020. An illuminating idea to reduce bycatch in the Peruvian
small-scale gillnet fishery. Biological Conservation, 241: 108277.
[25] Mangel et al. 2018. Illuminating gillnets to save seabirds and the potential
for multi-taxa bycatch mitigation. Royal Society Open Science, 5: 4–7.
[26] Wang et al. 2010. Developing Visual deterrents to reduce sea turtle bycatch
in gill net fisheries. Marine Ecology Progress Series, 408: 241–250.
[27] Ortiz et al. 2016. Reducing green turtle bycatch in small-scale fisheries
using illuminated gillnets: The cost of saving a sea turtle. Marine Ecology
Progress Series, 545: 251–259.
[28] Kakai, T. M. 2019. Assessing the effectiveness of LED lights for the
reduction of sea turtle bycatch in an artisanal gillnet fishery - a case study
from the north coast of Kenya. West Indian Ocean Journal of Marine
Science, 18: 37–44.
[29] Senko et al. 2022. Net illumination reduces fisheries bycatch, maintains
catch value, and increases operational efficiency. Current Biology, 32:
911-918.e2.
[30] International Whaling Commission. 2020. Report of the Scientific
Committee. Virtual Meeting, 11-26 May 2020, 122p.
[31] IOTC Secretariat, WWF Pakistan. 2022. DRAFT REPORT: Developing
robust multi-taxa bycatch mitigation measures for gillnets/drift nets in the
Indian Ocean. In: IOTC - 18th Working Party on Ecosystems Bycatch.
IOTC-2022-WPEB18-INF11.
[32] Gautama et al. 2022. Reducing sea turtle bycatch with net illumination
in an Indonesian small-scale coastal gillnet fishery. Frontiers in Marine
Science, 9: 1–11.
[33] Lucas et al. 2023. A systematic review of sensory deterrents for bycatch
mitigation of marine megafauna. Reviews in Fish Biology and Fisheries,
33: 1-33.
Protecting and conserving key habitats for migratory species
[1] Kauffman et al. 2021. Mapping out a future for ungulate migrations.
Science, 372(6542): 566–569.
[2] Maxwell et al. 2020. Area-based conservation in the twenty-first century.
Nature, 586(7828): 217-227.
[3] Runge et al. 2015. Protected areas and global conservation of migratory
birds. Science, 350(6265), pp.1255-1258
[4] Dudley et al. 2013. Guidelines for Applying Protected Area Management
Categories Including IUCN WCPA Best Practice Guidance on
Recognising Protected Areas and Assigning Management Categories and
Governance Types. Gland Switzerland.
[5] IUCN-WCPA Task Force on OECMs, 2019. Recognising and reporting
other effective area-based conservation measures. Gland, Switzerland:
IUCN
[6] BirdLife International. 2023. The World Database of Key Biodiversity
Areas. Developed by the KBA Partnership: BirdLife International,
International Union for the Conservation of Nature, Amphibian Survival
Alliance, Conservation International, Critical Ecosystem Partnership
Fund, Global Environment Facility, Re:wild, NatureServe, Rainforest Trust,
Royal Society for the Protection of Birds, Wildlife Conservation Society
and World Wildlife Fund. Available at www.keybiodiversityareas.org.
[Accessed September 2022].
[7] Key Biodiversity Areas Partnership. 2023. Key Biodiversity Areas
factsheet: Parque Nacional Salar de Huasco. Extracted from the World
Database of Key Biodiversity Areas. Developed by the Key Biodiversity
Areas Partnership: BirdLife International, IUCN, American Bird
Conservancy, Amphibian Survival Alliance, Conservation International,
Critical Ecosystem Partnership Fund, Global Environment Facility, Re:wild,
NatureServe, Rainforest Trust, Royal Society for the Protection of Birds,
World Wildlife Fund and Wildlife Conservation Society.
[8] Vickery et al. 2023. The conservation of Afro-Palearctic migrants: what are
we learning and what do we need to know? Ibis, https://doi.org/10.1111/
ibi.13171.
[9] Nandintsetseg et al. 2019. Challenges in the conservation of wide-ranging
nomadic species. Journal of Applied Ecology, 56(8): 1916-1926.
[10] Hilty et al. 2020. Guidelines for Conserving Connectivity through
Ecological Networks and Corridors. Groves, C. (ed.). IUCN, International
Union for Conservation of Nature.
[11] Conners et al. 2022. Mismatches in Scale between Highly Mobile Marine
Megafauna and Marine Protected Areas. Frontiers in Marine Science, 1236.
[12] Dunn, et al. 2019. The importance of migratory connectivity for global
ocean policy. Proceedings of the Royal Society B: Biological Sciences,
286(1911): 20191472.
[13] Lausche et al. 2021. Marine Connectivity Conservation‘Rules of Thumb’
for MPA and MPA Network Design. Version 1.0. IUCN WCPA Connectivity
Conservation Specialist Group’s Marine Connectivity Working Group.
[14] Balbar and Metaxas. 2019. The current application of ecological
connectivity in the design of marine protected areas. Global Ecology and
Conservation, 17, e00569
[15] Andrello et al. 2015. Extending networks of protected areas to optimize
connectivity and population growth rate. Ecography, 38(3), 273-282.
[16] Saura et al., 2019. Global trends in protected area connectivity from 2010
to 2018. Biological Conservation, 238: 108183.
[17] UNEP-WCMC and IUCN. 2021. Protected Planet Report 2020. UNEP-
WCMC and IUCN: Cambridge UK; Gland, Switzerland.
[18] García-Barón et al. 2019. Modelling the spatial abundance of a migratory
predator: A call for transboundary marine protected areas. Diversity and
Distributions, 25(3): 346–360.
[19] Allan et al. 2021. Ecological criteria for designing effective MPA networks
for large migratory pelagics: Assessing the consistency between IUCN
best practices and scholarly literature. Marine Policy, 127: 104219.
[20] UNESCO. 2023. Transboundary Marine Biosphere Reserve of the Tropical
Eastern Pacific of Colombia, Costa Rica, Ecuador and Panama. Available
at: https://www.unesco.org/en/articles/transboundary-marine-biosphere-
reserve-tropical-eastern-pacific-colombia-costa-rica-ecuador-and
[21] CMS. 2023. African Carnivores Initiative. Available at: https://www.cms.
int/en/legalinstrument/african-carnivores-initiative [Accessed 24/04/2023]
[22] Gaviria et al., 2022. Structural connectivity of Asia’s protected areas
network: identifying the potential of transboundary conservation and cost-
effective zones. ISPRS International Journal of Geo-Information, 11(7): 408.
[23] UNEP/CMS/COP13/Inf.27
[24] UNEP-WCMC and IUCN. 2021. Protected Planet Report 2020.
Cambridge (UK) and Gland (Switzerland). Available at: https://livereport.
protectedplanet.net/
[25] WWF et al. 2021. The State of Indigenous Peoples’ and Local
Communities’ Lands and Territories: A technical review of the state of
Indigenous Peoples’ and Local Communities’ lands, their contributions to
global biodiversity conservation and ecosystem services, the pressures
they face, and recommendations for actions. Gland, Switzerland.
[26] ICCA Consortium. 2021. Territories of Life: 2021 Report. ICCA
Consortium: worldwide. Available at: report.territoriesoflife.org.](https://image.slidesharecdn.com/stateoftheworldsmigratoryspeciesreporte-240213173509-18b3a010/75/UN-Report-State-of-the-Worlds-Migratory-Species-report_E-pdf-73-2048.jpg)
![62
State of the World’s Migratory Species
Promoting ecological connectivity by removing barriers to migration
[1] IPBES. 2019. Global assessment report on biodiversity and ecosystem
services of the Intergovernmental Science-Policy Platform on Biodiversity
and Ecosystem Services. (Eds.) Brondizio, Settele, Díaz, and Ngo. IPBES
Secretariat, Bonn, Germany. 1148 pp.
[2] Phalan et al. 2018. Avoiding impacts on biodiversity through strengthening
the first stage of the mitigation hierarchy. Oryx, 52(2): 316–324.
[3] Tarabon et al. 2019. Maximizing habitat connectivity in the mitigation
hierarchy. A case study on three terrestrial mammals in an urban
environment. Journal of Environmental Management, 243: 340–349.
[4] Dobson et al. 2010. Road will ruin Serengeti. Nature, 467(7313): 272-273.
[5] UNESCO. 2011. Contested Tanzania highway project will not cross
Serengeti National Park. Available at: https://whc.unesco.org/en/news/769
[6] Juffe-Bignoli et al. 2021. Mitigating the impacts of development corridors
on biodiversity: a global review. Frontiers in Ecology and Evolution, 9:
683949.
[7] Retief et al. 2016. Global megatrends and their implications for
environmental assessment practice. Environmental Impact Assessment
Review, 61: 52-60.
[8] CMS. 2021. Linear infrastructure and migratory species the role of impact
assessment and landscape approaches. Prepared by Mr. Roel Slootweg
on behalf of the CMS Secretariat. UNEP/CMS/ScC-SC5/Inf.3.
[9] ICEM. 2010. MRC Strategic Environmental Assessment (SEA) of
hydropower on the Mekong mainstream. Hanoi, Viet Nam.
[10] WWF. 2020. WWF Statement on Cambodian Government’s Decision to
Suspend Hydropower Dam Development on the Mekong River. Available
at: https://www.worldwildlife.org/press-releases/wwf-statement-on-
cambodian-government-s-decision-to-suspend-hydropower-dam-
development-on-the-mekong-river.
[11] Liu et al. 2020. Transboundary frontiers: an emerging priority for
biodiversity conservation. Trends in Ecology Evolution, 35(8): 679–690.
[12] Littlewood et al. 2020. Terrestrial Mammal Conservation: Global Evidence
for the Effects of Interventions for terrestrial mammals excluding bats
and primates. Synopses of Conservation Evidence Series. University of
Cambridge, Cambridge, UK.
[13] WCS. 2020. After 65 years, a Desert Nomad Crosses a Railroad Track
and Makes History. Available at: https://newsroom.wcs.org/News-
Releases/articleType/ArticleView/articleId/14310/After-65-years-a-Desert-
Nomad-Crosses-a-Railroad-Track-and-Makes-History.aspx
[14] Bartlam-Brooks et al. 2011. Will reconnecting ecosystems allow long-
distance mammal migrations to resume? A case study of a zebra Equus
burchelli migration in Botswana. Oryx, 45(2): 210-216.
[15] Kauffman et al. 2021. Mapping out a future for ungulate
migrations. Science, 372(6542): 566-569.
[16] Fattorini et al. 2023. Eco-evolutionary drivers of avian migratory
connectivity. Ecology Letters, https://doi.org/10.1111/ele.14223.
[17] Ament, R., Clevenger, A. and van der Ree, R. (Eds.) 2023. Addressing
ecological connectivity in the development of roads, railways and canals.
IUCN WCPA Technical Report Series No. 5. Gland, Switzerland: IUCN.
http://www.doi.org/10.53847/IUCN.CH.2023.PATRS.5.en.
Ecosystem restoration
[1] Bauer and Hoye. 2014. Migratory Animals Couple Biodiversity and
Ecosystem Functioning Worldwide. Science. 344(6179): 1242552.
[2] UNEP and FAO. 2020. The UN Decade on Ecosystem Restoration
Strategy. Available at : https://wedocs.unep.org/bitstream/
handle/20.500.11822/31813/ERDStrat.pdf?sequence=1isAllowed=y.
[3] CBD. 2022. Kunming-Montreal Global Biodiversity Framework Draft
Decision Submitted by the President. Conference of the Parties to the
Convention on Biological Diversity Fifteenth Meeting – Part II. Montreal,
Canada, 7-19 December 2022. https://www.cbd.int/doc/c/e6d3/cd1d/
daf663719a03902a9b116c34/cop-15-l-25-en.pdf .
[4] UNEP. 2022. UN recognizes 10 pioneering initiatives that are restoring the
natural world. Available at: https://www.unep.org/news-and-stories/press-
release/un-recognizes-10-pioneering-initiatives-are-restoring-natural-
world
[5] Altyn Dala Conservation Initiative. 2023. The Initiative. Available at:
https://altyndala.org/the-initiative/
[6] Pacto pela Restauração da Mata Atlântica. 2023. Available at: https://
www.pactomataatlantica.org.br/ [In Portuguese]
[7] Paviolo et al. 2016. A biodiversity hotspot losing its top predator:
The challenge of jaguar conservation in the Atlantic Forest of South
America. Scientific Reports, 6(1): 37147.
[8] WWF. 2018. Available at: https://wwflac.awsassets.panda.org/downloads/
jaguar_2030_roadmap.pdf
[9] Strassburg et al., 2020. Global priority areas for ecosystem
restoration. Nature, 586(7831): 724-729.
[10] Brancalion et al. 2019. Global restoration opportunities in tropical
rainforest landscapes. Science advances, 5(7): p.eaav3223.
[11] Mappin et al., 2019. Restoration priorities to achieve the global protected
area target. Conservation Letters, 12(4): p.e12646
[12] Monsarrat et al., 2022. Supporting the restoration of complex ecosystems
requires long‐term and multi‐scale perspectives. Ecography, 2022(4):
p.e06354
[13] Gann et al. 2019. International principles and standards for the practice of
ecological restoration. Second edition. Restoration Ecology. 27(S1): S1–
S46.
[14] Hai, N.T., Dell, B., Phuong, V.T. and Harper, R.J., 2020. Towards a more
robust approach for the restoration of mangroves in Vietnam. Annals of
Forest Science, 77(1): 1-18.
[15] Mikoko Pamoja. 2023. Available at: https://www.mikokopamoja.org/
[16] Kairo et al. 2018. Mikoko Pamoja : A Demonstrably Effective Community-
Based Blue Carbon Project in Kenya. In: Windham-Myers, Crooks, Troxler
(eds.) A Blue Carbon Primer. CRC Press, Boca Raton.
Mitigating light pollution
[1] Burt et al. 2023. The effects of light pollution on migratory animal behavior.
Trends in Ecology Evolution, S0169534722003329
[2] Falcón et al. 2020. Exposure to Artificial Light at Night and the
Consequences for Flora, Fauna, and Ecosystems. Frontiers in
Neuroscience, 14: 602796.
[3] Sánchez de Miguel et al. 2022. Environmental risks from artificial
nighttime lighting widespread and increasing across Europe. Science
Advances, 8(37): eabl6891.
[4] Koen et al. 2018. Emerging threat of the 21st century lightscape to global
biodiversity. Global Change Biology, 24: 2315-2325.
[5] Kyba et al. 2017. Artificially lit surface of Earth at night increasing in
radiance and extent. Science Advances, 3(11): e1701528.
[6] UNEP/CMS/Resolution 13.5.
[7] Audubon. 2023. Lights out: providing safe passage for nocturnal migrants.
Available at: https://www.audubon.org/lights-out-program
[8] Horton et al. 2019. Bright lights in the big cities: migratory birds’ exposure
to artificial light. Frontiers in Ecology and the Environment, 17(4): 209-214
[9] Loss et al. 2023. Citizen science to address the global issue of bird-
window collisions. Frontiers in Ecology and the Environment, https://doi.
org/10.1002/fee.2614
[10] Cabrera-Cruz et al. 2018. Light pollution is greatest within passage areas
for nocturnally-migrating birds around the world. Scientific Reports, 8:
3261.
[11] Van Doren et al. 2021. Drivers of fatal bird collisions in an urban center.
Proceedings of the National Academy of Sciences, 118(24): e2101666118.
[12] Horton et al. 2021. Near‐term ecological forecasting for dynamic
aeroconservation of migratory birds. Conservation Biology, 35(6): 1777-
1786.
[13] Shi et al. 2022. Prospects for monitoring bird migration along the East
Asian-Australasian Flyway using weather radar. Remote Sensing in
Ecology and Conservation, https://doi.org/10.1002/rse2.307.](https://image.slidesharecdn.com/stateoftheworldsmigratoryspeciesreporte-240213173509-18b3a010/75/UN-Report-State-of-the-Worlds-Migratory-Species-report_E-pdf-74-2048.jpg)
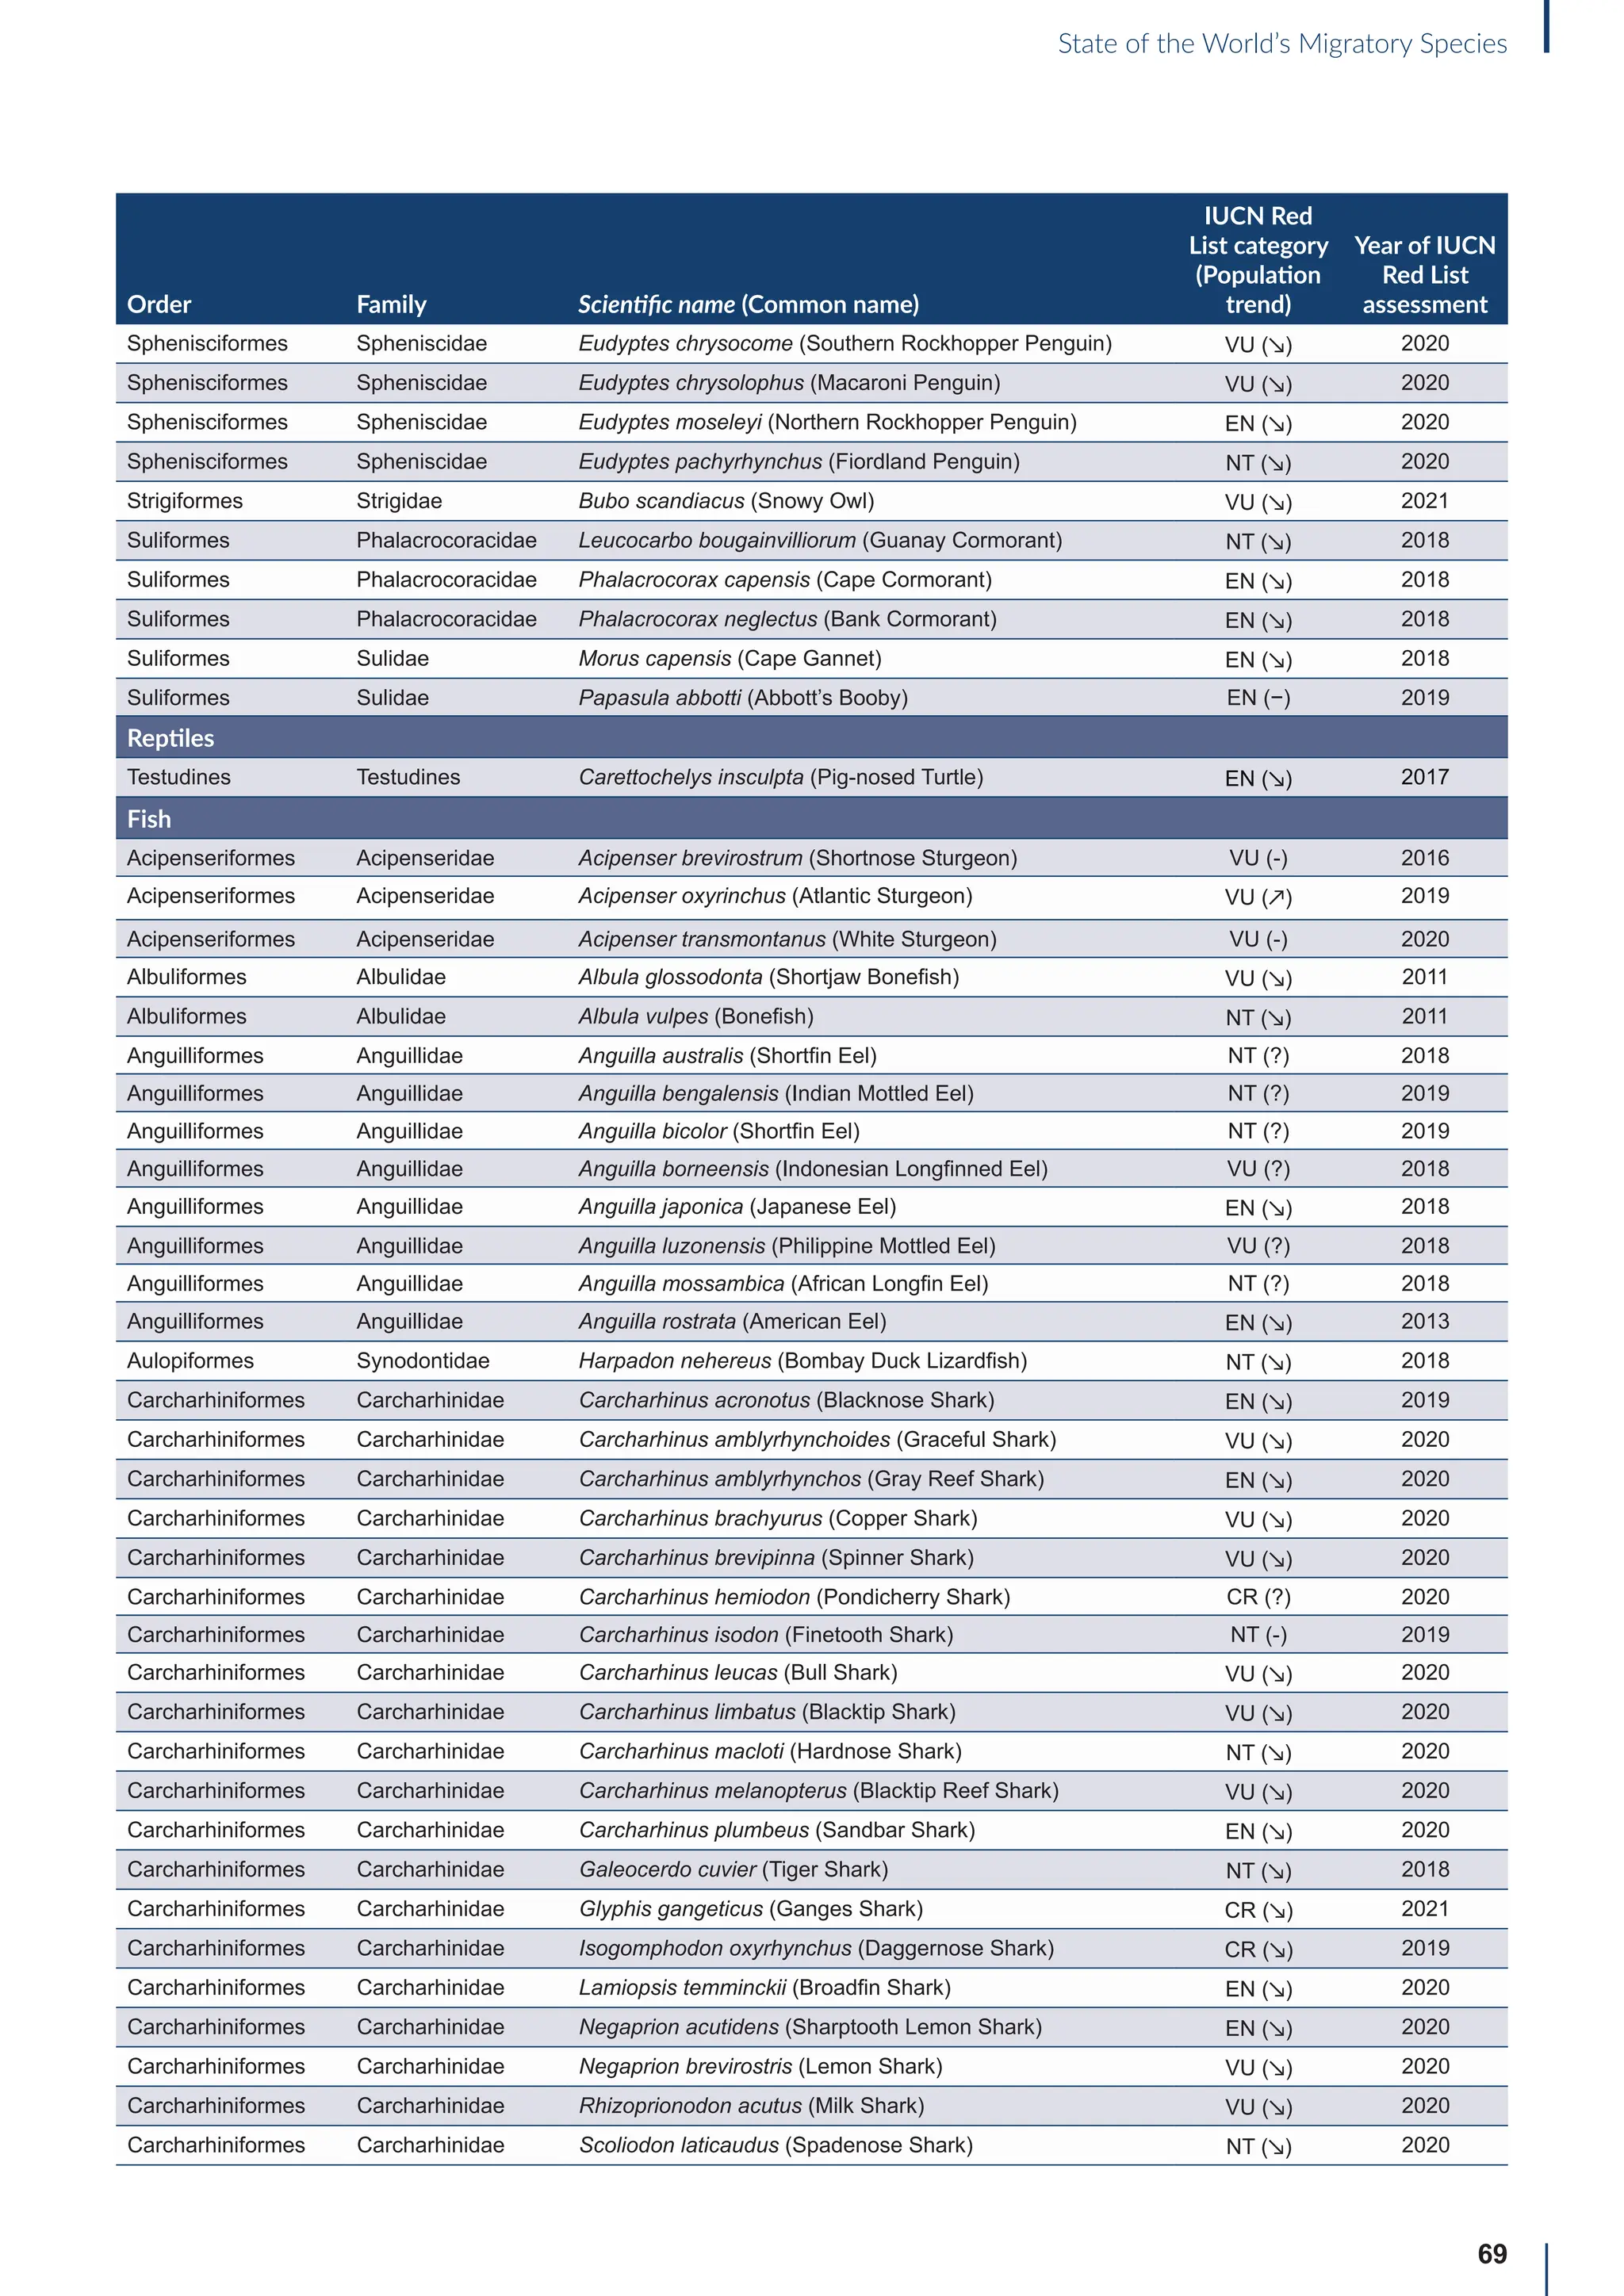
![65
State of the World’s Migratory Species
Annex B: Globally threatened
or Near Threatened migratory
species not yet listed in the
CMS Appendices
Table B1: Migratorya
species that are globally threatened or Near Threatened and not yet listed in the CMS Appendices (n=399).
[IUCN Red List category: CR = Critically Endangered, EN = Endangered, VU = Vulnerable, NT = Near Threatened; population trend:
↗ = increasing, - = stable, ↘ = decreasing, ? = unknown, uns. = unspecified]. Note: This is a preliminary list and further consideration is
required to determine if individual species meet the criteria for listing, particularly in relation to the CMS definition of migration for all
groups other than birds (for which a comprehensive assessment has already been undertaken).
Order Family Scientific name (Common name)
IUCN Red
List category
(Population
trend)
Year of IUCN
Red List
assessment
Terrestrial mammals
Cetartiodactyla Bovidae Bison bison (American Bison) NT (-) 2016
Cetartiodactyla Bovidae Bison bonasus (European Bison) NT (↗) 2020
Cetartiodactyla Bovidae Capra caucasica (Western Tur) EN (↘) 2019
Cetartiodactyla Bovidae Pantholops hodgsonii (Chiru) NT (↗) 2016
Cetartiodactyla Cervidae Rangifer tarandus (Reindeer) VU (↘) 2015
Chiroptera Hipposideridae Macronycteris vittatus (Striped Leaf-nosed Bat) NT (↘) 2019
Chiroptera Phyllostomidae Choeronycteris mexicana (Mexican Long-tongued Bat) NT (?) 2018
Chiroptera Phyllostomidae Leptonycteris curasoae (Southern Long-nosed Bat) VU (↘) 2015
Chiroptera Pteropodidae Pteropus vampyrus (Large Flying-fox) EN (↘) 2021
Chiroptera Vespertilionidae Myotis lucifugus (Little Brown Bat) EN (↘) 2018
Chiroptera Vespertilionidae Myotis septentrionalis (Northern Myotis) NT (↘) 2018
Chiroptera Vespertilionidae Perimyotis subflavus (Eastern Pipistrelle) VU (↘) 2018
Perissodactyla Equidae Equus quagga (Plains Zebra) NT (↘) 2016
Perissodactyla Equidae Equus zebra (Mountain Zebra) VU (↗) 2018
Aquatic mammals
Carnivora Odobenidae Odobenus rosmarus (Walrus) VU (?) 2016
Carnivora Otariidae Callorhinus ursinus (Northern Fur Seal) VU (↘) 2015
Carnivora Otariidae Phocarctos hookeri (New Zealand Sea Lion) EN (↘) 2014
Carnivora Phocidae Cystophora cristata (Hooded Seal) VU (?) 2015
Cetartiodactyla Platanistidae Platanista minor (Indus River Dolphin) EN (↗) 2021
Birds
Bucerotiformes Bucerotidae Bycanistes cylindricus (Brown-cheeked Hornbill) VU (↘) 2018
Bucerotiformes Bucerotidae Ceratogymna elata (Yellow-casqued Hornbill) VU (↘) 2016
Caprimulgiformes Apodidae Apus acuticauda (Dark-rumped Swift) VU (-) 2016
Caprimulgiformes Apodidae Chaetura pelagica (Chimney Swift) VU (↘) 2018
Caprimulgiformes Apodidae Cypseloides niger (Black Swift) VU (↘) 2020
Caprimulgiformes Apodidae Cypseloides rothschildi (Rothschild’s Swift) NT (-) 2016
Caprimulgiformes Caprimulgidae Antrostomus carolinensis (Chuck-will’s-widow) NT (↘) 2020
a
For avian taxa, these species were assessed by the CoP-appointed co-Councillor for Birds to determine whether these species met the CMS definition of
migration; for the other taxa, the evidence for migratory behaviour was based on a range of sources (including the IUCN Red List and GROMS), but whether or
not these species meet the CMS movement criteria has not been verified.](https://image.slidesharecdn.com/stateoftheworldsmigratoryspeciesreporte-240213173509-18b3a010/75/UN-Report-State-of-the-Worlds-Migratory-Species-report_E-pdf-77-2048.jpg)

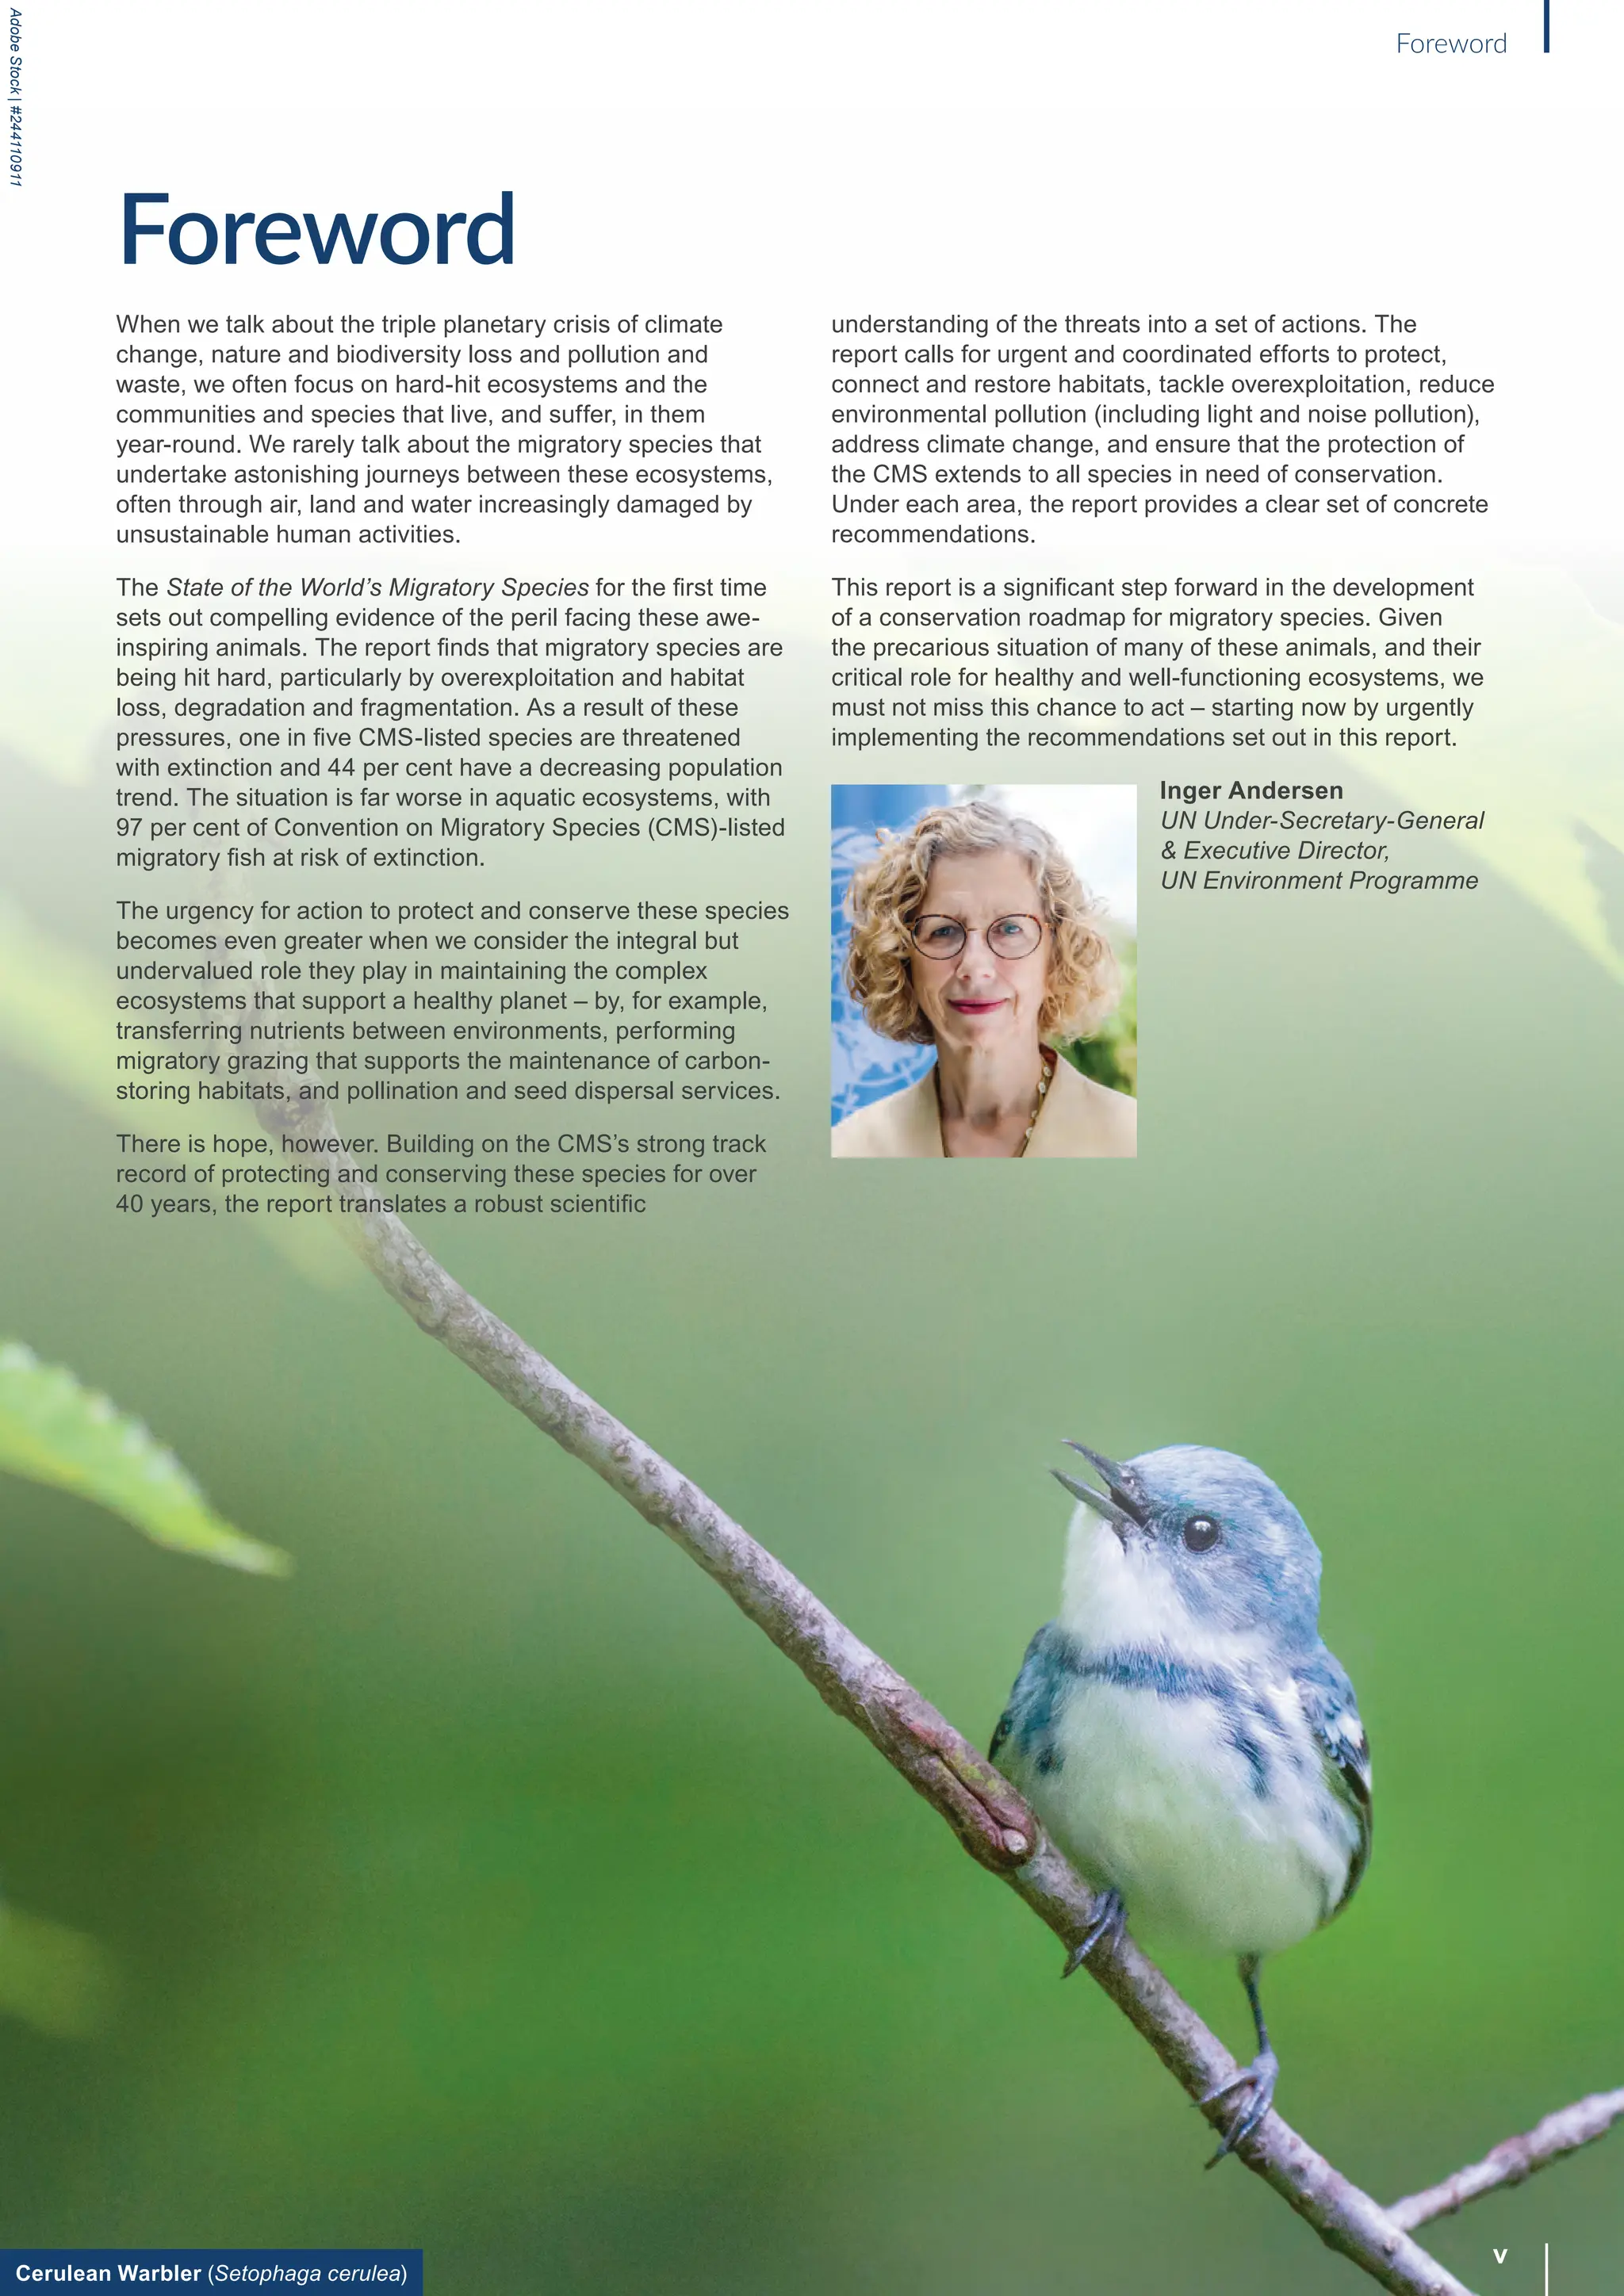
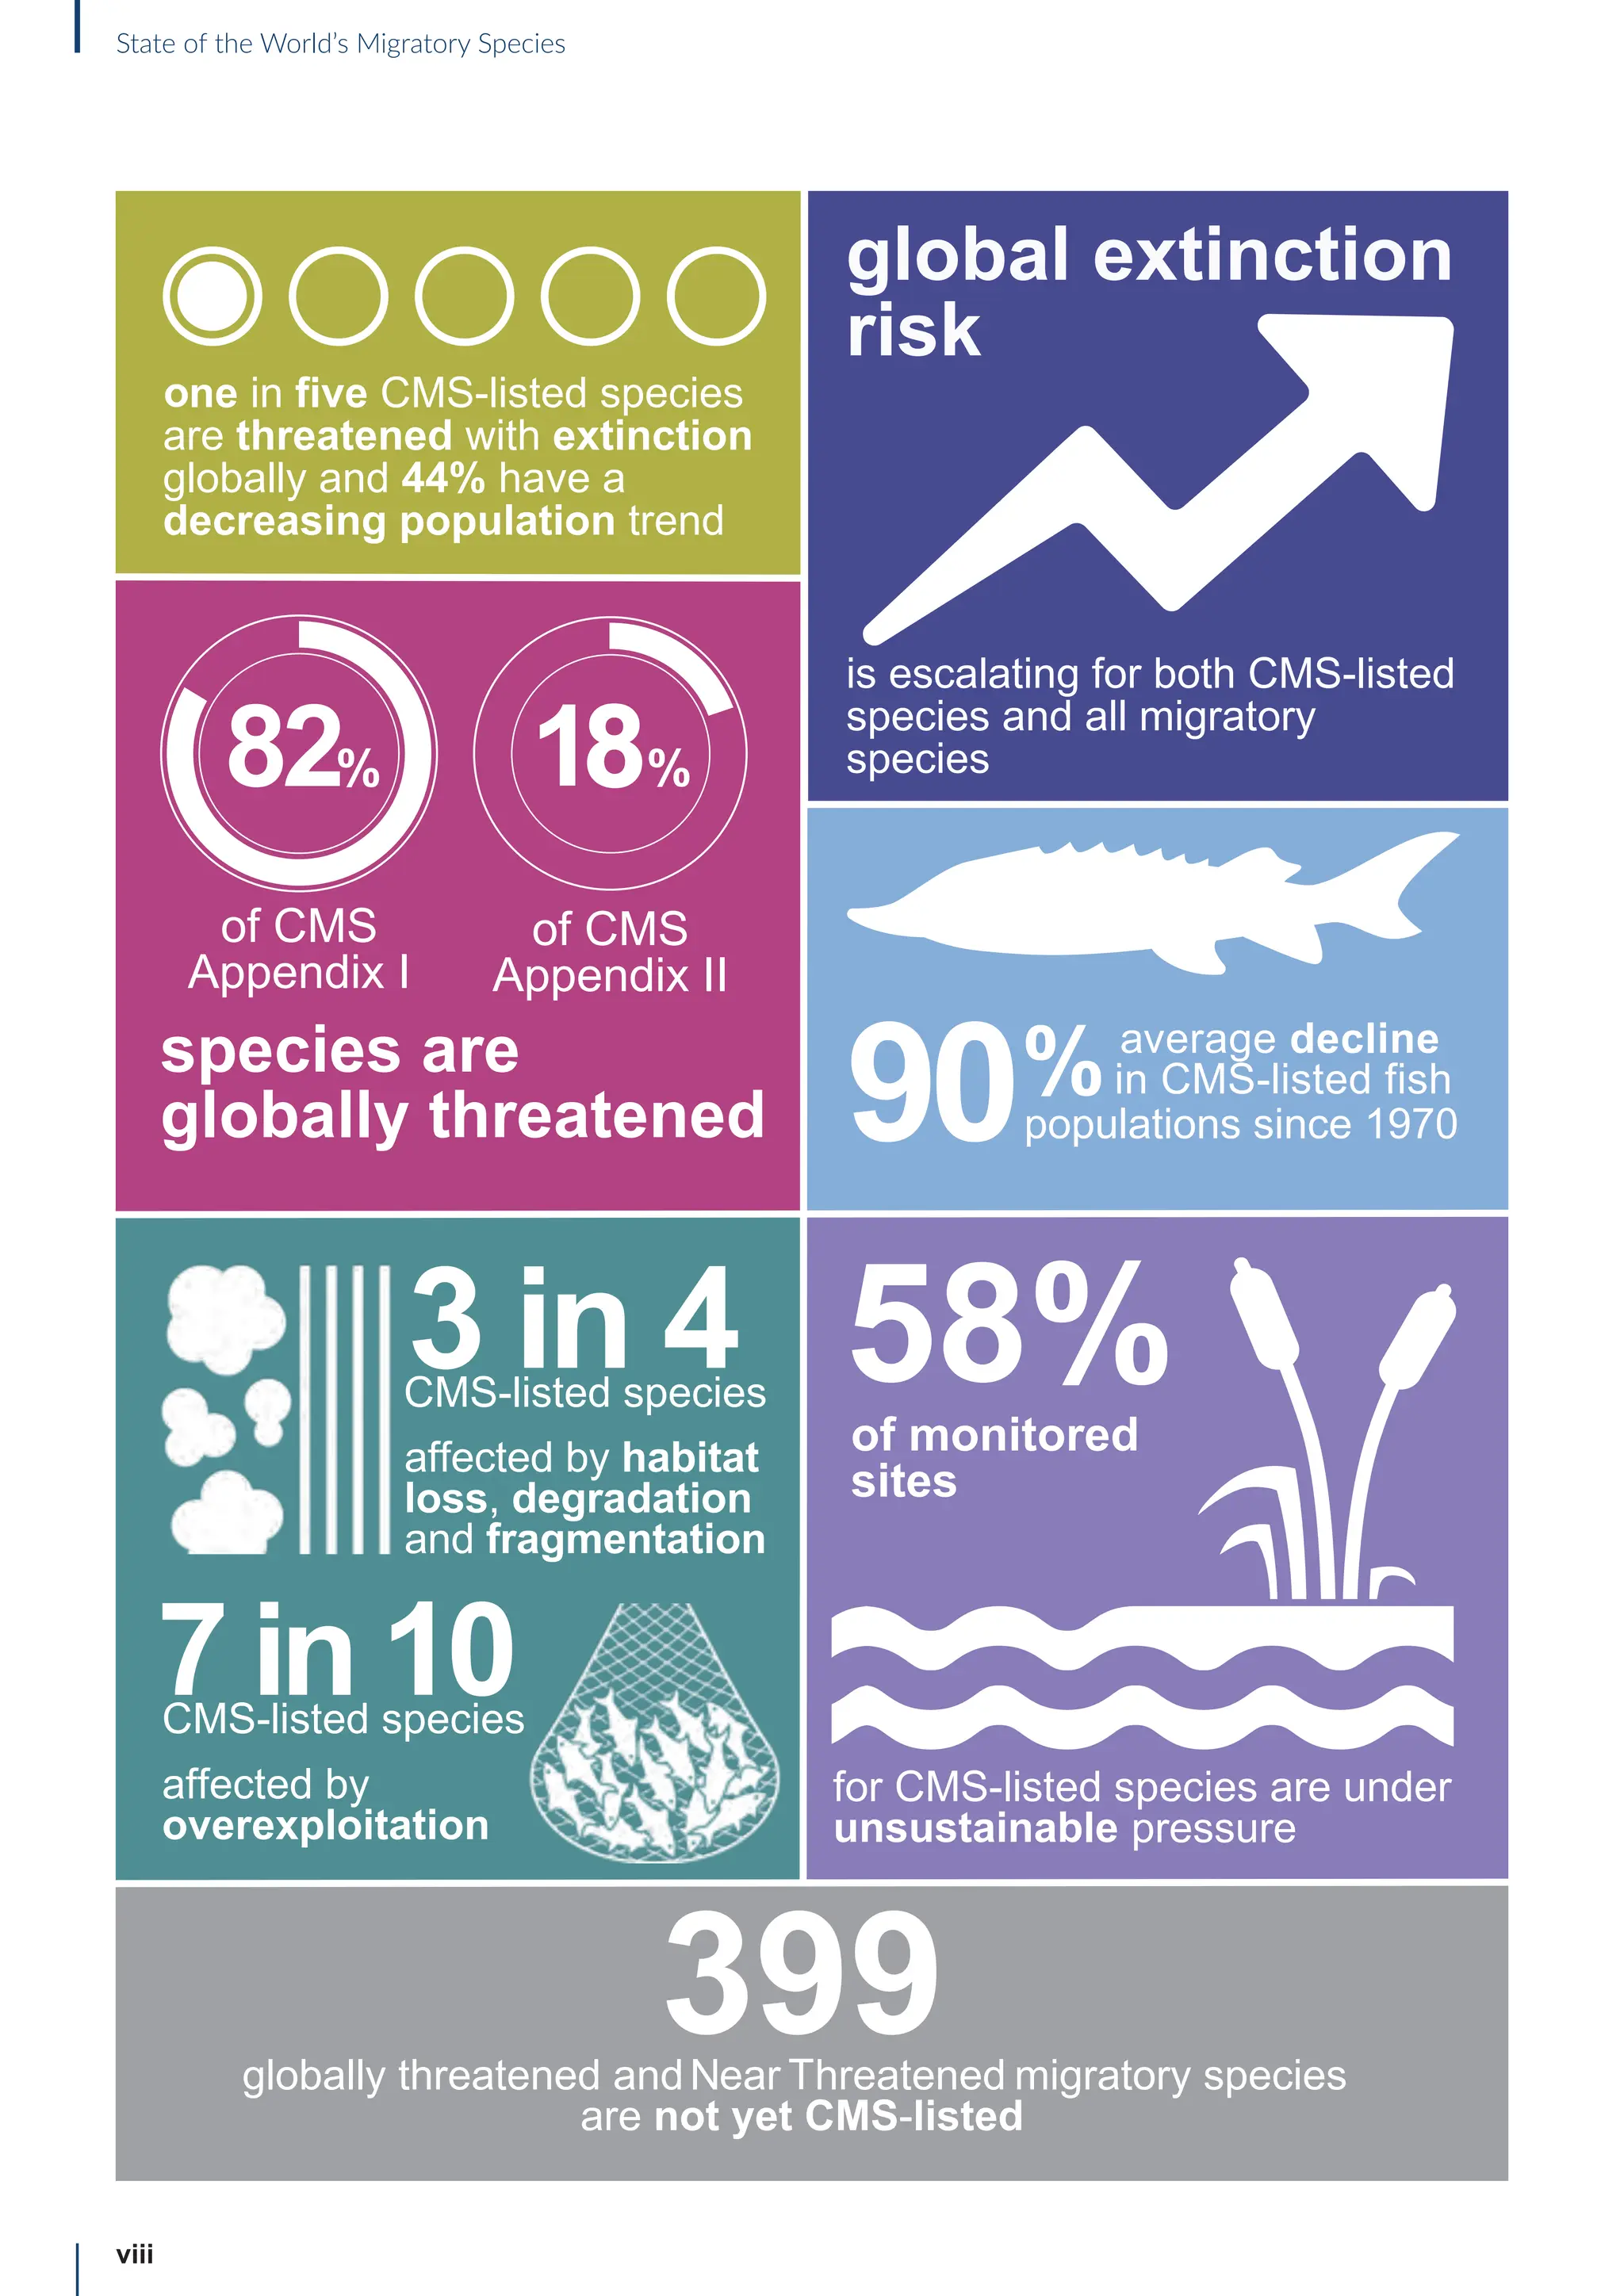
This report provides the first comprehensive overview of the conservation status of migratory species listed under the Convention on Migratory Species (CMS). It finds that the status of many CMS-listed species is deteriorating, with one in five threatened with extinction and nearly half experiencing population declines. The situation is particularly dire for CMS-listed fish, with 97% threatened with extinction. Extinction risk is rising across CMS species and other migratory species. The main threats driving this decline are overexploitation, habitat loss, and pollution. While conservation efforts are underway, increased action is urgently needed to address threats, protect habitats, and improve the conservation status of migratory species worldwide.


