This document summarizes a study that examined the effects of different antifreeze additives on the physical and mechanical properties of concrete produced in cold weather. Concrete samples containing various antifreeze additives were exposed to freezing temperatures between 0 and -20 degrees Celsius. The samples were then cured at room temperature and tested on the 28th day to determine properties like permeability, strength, and elasticity. The study found that a mixture of 30% calcium nitrate and 5% hydroxyethylamine provided the best performance as an antifreeze additive. However, all antifreeze types had a negative impact on concrete properties due to the freezing temperatures during curing.
![The effects of antifreeze use on physical and mechanical properties
of concrete produced in cold weather
Mustafa Çullu a,⇑
, Metin Arslan b
a
Gumushane University, Faculty of Civil Engineering, 29100 Gumushane, Turkey
b
Gazi University, Faculty of Technology, 06500 Ankara, Turkey
a r t i c l e i n f o
Article history:
Received 17 November 2012
Received in revised form 17 January 2013
Accepted 19 February 2013
Available online 27 February 2013
Keywords:
B. Physical properties
B. Mechanical properties
B. Porosity
E. Cure
B. Cure behaviour
a b s t r a c t
This study examined the effects of antifreeze on the physical and mechanical properties of the concrete
which are produced in cold weather. 30% Calcium Nitrate and 5% hydroxyethylaminemixture (HEA), Cal-
cium Nitrate (KN) and Polyhydroxy Amine (PA) were used as additives in antifreeze. Prepared concrete
samples were placed in a formwork and exposed to the frost at 0 °C, 5 °C, 10 °C, 15 °C and 20 °C
for 2 days. Afterwards, concrete samples in the freezer were cured at the room temperature until the
28th day and permeable pore space volume, water absorption ratio, density, capillarity ratio, imperme-
ability, compressive strength, static modulus of elasticity, Poisson’s ratio and tensile strength values of
the concrete samples were determined after the curing. In conclusion, 30% Calcium Nitrate and 5%
hydroxyethylaminemixture (HEA) were found to be giving the best performance among the antifreeze
types. The physical and mechanical properties of the concrete were negatively affected from all antifreeze
types due to the temperature decrease of the exposed fresh concrete.
Ó 2013 Elsevier Ltd. All rights reserved.
1. Introduction
The method and time of placing the concrete into the formwork
and the curing conditions significantly affect the physical and
mechanical properties of the concrete, regardless of the materials
used in the composition of concrete [1].
Portland cement cannot harden under a freezing point without
some thermal protection. For this reason, fresh concrete should be
protected if it is below the freezing point. Protection procedures
can be performed with an insulation material or by increasing
the internal temperature of the concrete over 5 °C. Temperature
should definitely be conserved in emergency conditions. If the con-
crete is not protected from the cold, it freezes and might cause a
disaster [2].
Concrete is widely used in buildings, which are constantly ex-
posed to temperature and moisture. The mechanical and physical
properties of the concrete vary according to environmental condi-
tions in the production period and in curing conditions [3].
The literature contains a large body of research to explain the
freezing mechanism of concretes [4]. Most of the studies showed
that aggregate voids and the transitions between cement paste
aggregate interfaces affect the freezing of concrete. Concrete is af-
fected from frost according to the multiplicity of pores on the
materials composing the concrete which are large enough to allow
penetration of water [5,6]. In cold weather, the water inside these
pores freezes and thus expands. As it is known, approximately a 9%
increase in volume occurs when water turns into ice. Accordingly,
if freezing occurs when 91% or more of the volume of the pores in-
side the concrete are filled with water, the volume of the water will
not fit in the existing volume when it turns into ice, as it will apply
pressure to the surrounding. Since some of the water turns into ice
and causes an increase in volume, it pushes the water which has
not yet turned into ice in an outwardly direction and creates a high
level of hydraulic pressure. This hydraulic pressure might cause
hardened cement paste, which surrounds the aggregate and aggre-
gate grain inside the concrete causes it to crack [5–7]. On the other
hand, researchers reported that concrete was less affected by frost
damage when a concrete with high density and an impermeable
surface is obtained [8,9].
Considerable progresses have been made in the production,
placing, curing and protection of concrete under cold air condi-
tions. As a result, firms do not need to take a break to place the con-
crete in cold weather [10].
Since the temperature of the material components of the con-
crete will have be low temperature in cold weather, the tempera-
ture of the concrete produced also becomes low. The ideal
temperature for casting concrete is 15–16 °C degrees and the tem-
peratures which are considered normal when varying between 5
and 32 °C. At temperatures lower than +5 °C, chemical reactions
between cement and water significantly decrease. Due to the
deceleration of the hydration of cement at low temperatures, the
1359-8368/$ - see front matter Ó 2013 Elsevier Ltd. All rights reserved.
http://dx.doi.org/10.1016/j.compositesb.2013.02.012
⇑ Corresponding author. Tel.: +90 456 2337425/6/1133; fax: +90 456 2337427.
E-mail address: mcullu@gumushane.edu.tr (M. Çullu).
Composites: Part B 50 (2013) 202–209
Contents lists available at SciVerse ScienceDirect
Composites: Part B
journal homepage: www.elsevier.com/locate/compositesb](https://image.slidesharecdn.com/ullu2013-230730163214-0337dd23/75/ullu2013-pdf-1-2048.jpg)
![setting time becomes longer. Since low hydration speed deceler-
ates the formation of calcium–silicate–hydrate (C–S–H) gels, which
is the most important component of hydration and has a bonding
property, it results in a delayed resistance acquisition. Acquiring
the desired resistance at a delayed time negatively affects the
properties of concrete and delays the time taken for the removal
of the mold [11].
When water inside the concrete completely turns into ice with-
out setting, there will be no water adequate for hydration, as
hydration completely stops and concrete volume expands. After a
certain time, if the ice inside the concrete dissolves and turns into
water due to temperature increase, concrete can set and harden.
However, in such cases, since void volume which occurs due to
melting of ice will be quite large and gels which are the products
of hydration, it will fail to fill these voids adequately, causing a de-
crease in the resistance of the concrete, and thus water imperme-
ability increases [12].
However, if the concrete which set does not gain enough resis-
tance when it freezes, then a cracked and low-resistant concrete is
obtained as the water in capillary voids freeze and expand. Various
researchers suggest 5–14 MPa as an adequate compressive
strength. Another method is to determine how many days later
concrete samples, which are kept at different temperatures, remain
undamaged by frost. However, in cases where the concrete which
started setting did not reach a sufficient level of resistance, a loss of
resistance is expected in the concrete. The freezing of water in a
concrete with adequate resistance for once does not cause cracks
and does not affect resistance. This is explained by the fact that
water inside the concrete with a sufficient degree of resistance is
used for hydration and thus the amount of water decreases.
According to ACI 306R-88 (Cold Weather Concreting), to avoid a
concrete which was exposed to frost once from being damaged,
its resistance should reach a minimum of 3.5 MPa. A concrete with
a good mixture ratio at +10 °C can reach 3.5 MPa resistance 2 days
after placing it [12–15].
As an alternative, antifreeze additives can be used in cold
weather. These chemical additives repress the freezing point of
water under 0 °C degrees and accelerate the hydration of cement;
however, the long-term effects of these additives remain unknown
[2]. Concrete antifreeze additives are an indispensable component
of concrete, particularly in winter and in areas with a cold climate.
The overall effects of these additives, which are thought to have
overall positive effects, should be determined and these effects
should be taken into account in the design process [16].
In parallel to these advancements, the present study examined
the physical and mechanical properties of the concrete with anti-
freeze additives which were exposed to frost. To achieve this goal,
the permeable pore space volume, water absorption ratio, density,
capillarity ratio, impermeability, compressive strength, static mod-
ulus of elasticity, Poisson’s ratio and tensile strength values were
all measured.
2. Materials and methods
2.1. Material
2.1.1. Cement
CEM I 42.5R Portland cement was used in the study. The chem-
ical, physical and mechanical properties of the cement are pre-
sented in Table 1.
2.1.2. Aggregate
Limestone aggregate, which is used in the production of normal
resistance concretes in concrete facilities among (0–5, 5–12, 12–
22) aggregate groups were used in the samples. The aggregate
samples were taken according to the principles specified in EN
706 EN 12620 + A1 in such a way as to represent an aggregate heap
[17].
2.1.3. Antifreeze
Three different antifreezes were used in the study. Antifreezes
are chemical additives in compliance with ASTM C 494 and TS
11746 standard [18,19]. Some of the properties of the antifreezes
are presented in Table 2.
2.1.4. Super plasticizer
An additive which is in compliance with ASTM C 494 Type F and
EN 934-2 standards and provides high range water reducer and
early high resistance was used in fresh concrete samples [18–20].
2.2. Method
Antifreeze ratios which will be used for concrete samples for
each type were determined by a preliminary work. Basically, the
antifreeze amount in the concrete mix is approximately 1–2% of
the total mass of the cement. The antifreeze ratios are presented
in Table 3 [21].
After placing the prepared concrete samples in formwork, the
samples were put in a deep freezer within 15 min. They were ex-
posed to frost at 0 °C, 5 °C, 10 °C, 15 °C and 20 °C degrees
in a deep freezer for 2 days. The samples, which were taken out
of the freezer, were then removed from the formwork 1 day later.
They were cured in water at room temperature until the 28th day.
At the end of the curing period, the permeable pore space volume,
water absorption ratio, unit volume weight, capillarity ratio,
impermeability, compressive strength, static modulus of elasticity,
Poisson’s ratio and tensile strength values of the concrete samples
were determined.
2.2.1. Identification of permeable pore space volume
Permeable pore space volume (B0) was calculated on five
100 200 mm cylindrical concrete samples according to ASTM
C642 principles. Eq. (1) was used to calculate B0 [22].
B0 ¼
C A
C D
100 ð1Þ
where B0 is the permeable pore space volume, %, A is mass of oven-
dried sample in air, g, C is mass of surface-dry sample in air after
immersion and boiling, g, D is the apparent mass of sample in water
after immersion and boiling, g [22].
2.2.2. Identification of water absorption
Water absorption ratio (m) was calculated on five
100 200 mm cylindrical concrete samples according to ASTM
C642 principles. Eq. (2) was used to calculate m [22].
m ¼
B A
A
100 ð2Þ
where m is the water absorption ratio by weight, %, A is mass of
oven-dried sample in air, g, B is the mass of surface-dry sample in
air after immersion, g [22].
2.2.3. Identification of density
Density (D) was calculated on five 100 200 mm cylindrical
concrete samples according to EN 12390-7 principles. Eq. (3) was
used to calculate D [23].
D ¼
m
V
ð3Þ
where D is the density of concrete sample, gr/cm3
, m is mass of the
concrete sample depending on its condition during the experiment,
M. Çullu, M. Arslan / Composites: Part B 50 (2013) 202–209 203](https://image.slidesharecdn.com/ullu2013-230730163214-0337dd23/75/ullu2013-pdf-2-2048.jpg)
![gr, V is the volume of the concrete sample which is identified by a
special method, cm3
[23].
2.2.4. Identification of the capillarity ratio
Capillarity ratio (I) was performed on five 100 200 mm cylin-
drical concrete samples according to ASTM C1585 principles. Eq.
(4) was used to calculate capillarity ratio I [24].
I ¼ mt=ða=dÞ ð4Þ
where I is the absorption, mt is change in specimen mass in grams at
the time t, a is exposed area of the specimen, in mm2
, d is the den-
sity of the water in g/mm3
[22].
2.2.5. Identification of impermeability
Six 150 150 150 mm cubic concrete samples prepared
according to the principles in EN 12390-8 were placed in a perme-
ability device where pressurized water would be applied. The sam-
ples were exposed to five bars (500 kPa) of pressurized water for
72 h. At the end of this period, concrete samples were split verti-
cally to the surface, on which pressurized water was applied. The
area the water took inside the concrete was marked. The depth
of permeability was determined by measuring the greatest depth
water penetrated starting from the experimental area on which
pressure was applied [25].
2.2.6. Identification of compressive strength
Compressive strength (fc) was calculated on five 100 200 mm
cylindrical concrete samples according to EN 12390-3 principles.
Eq. (5) was used to calculate fc [26].
fc ¼ F=Ac ð5Þ
where fc is the compressive strength, MPa, F is total maximum load,
N, Ac is the area of loaded surface, mm2
[26].
2.2.7. Identification of static modulus of elasticity
Static modulus of elasticity (E) was calculated on five
100 200 mm cylindrical concrete samples according to ASTM
C469 principles. Eq. (6) was used to calculate E [27].
E ¼ ðS2 S1Þ=ð2 0:000050Þ ð6Þ
where E is the chord modulus of elasticity, psi, S2 is stress corre-
sponding to 40% of ultimate load, S1 is stress corresponding to a lon-
gitudinal strain, 1, of 50 millionths, psi, 2 is the longitudinal strain
produced by stress S2 [27].
2.2.8. Identification of Poisson’s ratio
Poisson’s ratio (l) was calculated on five 100 200 mm cylin-
drical concrete samples according to ASTM C469 principles. Eq.
(7) was used to calculate l [27].
l ¼ ðt2 t1Þ=ð2 0:000050Þ ð7Þ
where l = Poisson’s ratio, t2 = transverse strain at midheight of the
specimen produced by stress S2, t1 = transverse strain at midheight
of the specimen produced by stress S1, 2 = longitudinal strain pro-
duced by stress S2 [27].
Table 1
Chemical, physical and mechanical properties of CEM I 42,5R.
Chemical properties Physical properties
SiO2 (%) 20.32 Setting time, initial (min) 01:58
Al2O3 (%) 5.59 Setting time, final (min) 02:57
Fe2O3 (%) 3.09 Volume stability (mm) 2
CaO (%) 62.50 Specific surface (blaine), (cm2
/g) 3172
MgO (%) 1.74 Specific gravity (g/cm3
) 3.09
SO3 (%) 3.29
Na2O (%) 0.34
Mechanical properties Comp. strength (MPa)
K2O (%) 0.91 Basýnç dayanýmý (MPa)
Loss on ignition (%) 1.18 2 days 30.8
Insoluble residue (%) 0.31 7 days 39.5
S CaO (%) 0.93 28 days 56.0
Table 2
Antifreeze type and properties.
Additive no. Additive code Chemical content Properties
1 HEA 30% Calcium Nitrate + 5% hydroxyethylaminemixture Density: 1.25 ± 0.03 kg/L
pH: 6.00–6.50
Chloride: 60.1% (EN 480-10)
Alkali content: 610% (EN 480-12)
2 KN Calcium Nitrate Density: 1.25 ± 0.03 kg/L
pH: 6.00–8.00
Chloride: 60.1% (EN 480-10)
Alkali content: 610% (EN 480-12)
3 PHA Polyhydroxy Amine Density: 1.25 ± 0.03 kg/L
pH: 6.00–6.50
Chloride: 60.1% (EN 480-10)
Alkali content: 610% (EN 480-12)
Table 3
Antifreeze ratios to be used in mixtures [21].
Antifreeze type Curing temperature °C
0 °C (%) 5 °C (%) 10 °C (%) 15 °C (%) 20 °C (%)
HEA 1 1 1 1 1
KN 1 1 2 2 2
PHA 1 1 1 1 1
204 M. Çullu, M. Arslan / Composites: Part B 50 (2013) 202–209](https://image.slidesharecdn.com/ullu2013-230730163214-0337dd23/75/ullu2013-pdf-3-2048.jpg)
![2.2.9. Identification of tensile strength
Tensile strength (T) was calculated on five 100 200 mm cylin-
drical concrete samples according to ASTM C496 principles. Eq. (8)
was used to calculate E [28].
T ¼ 2P=pld ð8Þ
where T = splitting tensile strength, MPa, P = maximum applied load
indicated by the testing machine, N, l = length, mm, d = diameter,
mm [28].
3. Results and discussion
3.1. Permeable pore space volume
The permeable pore space volume value increases in parallel to
the decrease in temperature values to which the concrete is ex-
posed. This increase is due to the fact that the water required for
the hydration of cement and thickness of the concrete freezes
and creates a porous structure inside the concrete. A graph of mean
void values is presented in Fig. 1.
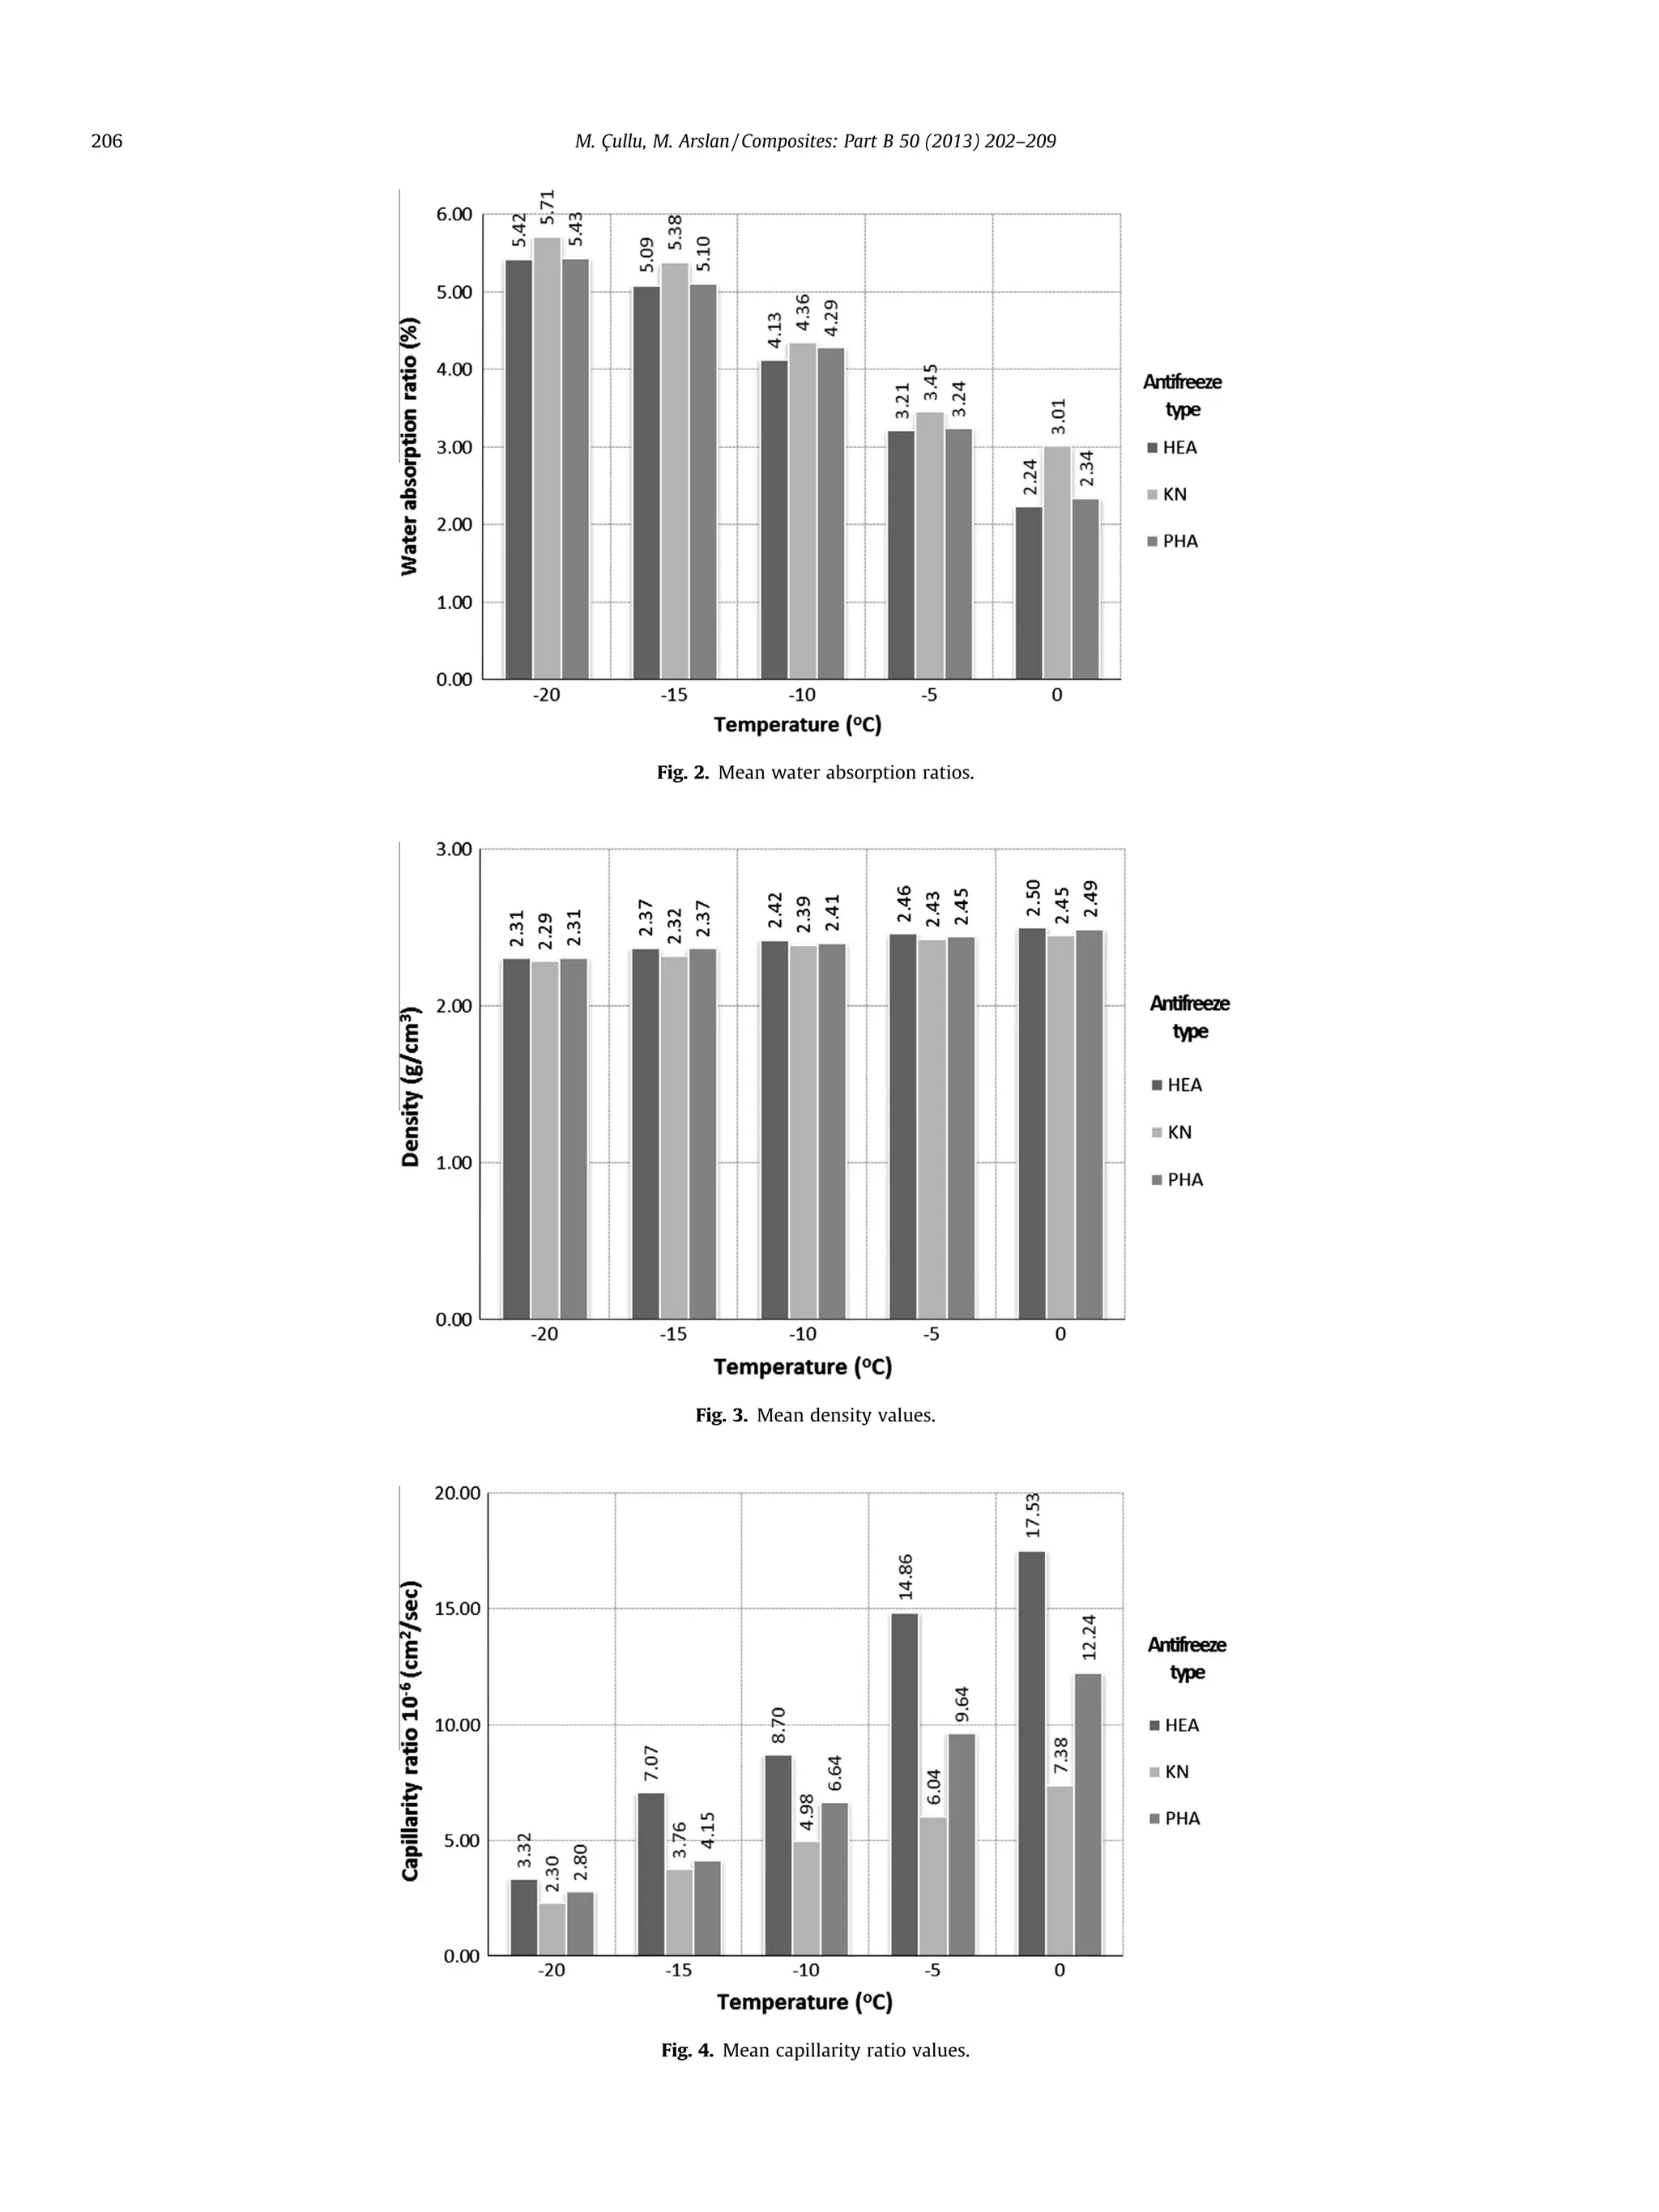
3.2. Water absorption ratio
The water absorption ratio value increases in parallel to the de-
crease in temperature value to which the concrete is exposed. The
reason for this increase is the increasing void structure due to the
temperature decrease to which the concrete was exposed. The
graph for the mean water absorption values are presented in Fig. 2.
3.3. Density
The density values decrease in parallel to the decrease in tem-
perature values to which the concrete is exposed. The reason for
this decrease is increased void structure due to the decrease of
temperature to which the concrete is exposed. The graph for the
mean density values is presented in Fig. 3.
3.4. Capillarity ratio
The capillarity ratio value decreases in parallel to the decrease
in temperature value to which the concrete is exposed. The reason
for this decrease is the increased void structure due to decrease in
temperature to which the concrete was exposed. Accordingly, the
capillarity ratios of concrete samples decrease. In addition, the
graph of mean capillarity ratio is presented in Fig. 4.
3.5. Impermeability
The impermeability value increases in parallel to the decrease
of temperature to which the concrete is exposed. The reason for
this increase is the increasing void structure due to the decrease
in temperature to which the concrete is exposed. If pressurized
water is applied to porous concrete, water penetration depth in-
creases. The graph for the mean impermeability values are pre-
sented in Fig. 5.
3.6. Compressive strength
The compressive strength values decrease in parallel to the de-
crease of temperature values which the concrete is exposed. The
reason for this decrease is the decrease of compressive strength
due to the decrease of the temperature. The maximum decrease
of the compressive strength is observed for the concrete samples
which are exposed to 20 °C. The maximum decrease of the com-
pressive strength is observed at the specimens which are exposed
to 20 °C. The graph for the mean compressive strength values is
presented in Fig. 6.
3.7. Static modulus of elasticity
The static modulus of elasticity values decrease in parallel to
the decrease in temperature values of the exposed concrete. The
reason for the decrease of static modulus of elasticity is observed
due to the decrease of temperature of the exposed concrete. Simi-
lar to the results of the compressive strength experiments, with the
decrease of the temperature which the concrete is exposed, static
modulus of elasticity is decreased. The graph for the mean static
modulus of elasticity values is presented in Fig. 7.
3.8. Poisson’s ratio
The Poisson ratio values decrease in parallel to the decrease in
temperature which the concrete is exposed. The reason for the de-
crease of Poisson’s ratio is observed due to the decrease of temper-
ature of the exposed concrete. The temperature decrease of the
fresh concrete yields a decrease of the compressive strength and
static modulus of elasticity of the concrete specimens. The decreas-
Fig. 1. Mean permeable pore space volume.
M. Çullu, M. Arslan / Composites: Part B 50 (2013) 202–209 205](https://image.slidesharecdn.com/ullu2013-230730163214-0337dd23/75/ullu2013-pdf-4-2048.jpg)

![ing compressive strength also yields a greater deformation of the
specimens hence Poisson’s ration is increased. The graph for the
mean Poisson’s ratio values is presented in Fig. 8.
3.9. Tensile strength
The tensile strength values decrease in parallel to the decrease
in temperature values to which the concrete is exposed. The reason
for this decrease is the decrease of the tensile strength value of the
specimens due to the decreasing temperature of the exposed con-
crete specimens. The graph for the mean tensile strength values is
presented in Fig. 9.
4. Conclusion
The following results were obtained according to the frost con-
ditions to which fresh concrete was exposed.
Considering the effects of all antifreeze types used in concrete
mixtures on the physical and mechanical properties of the con-
crete, 30% Calcium Nitrate and 5% hydroxyethylaminemixture
(HEA) gave the best performance.
If fresh concrete is exposed to frost, water is required to achieve
the hydration of cement and thickness of concrete freezes and
creates a porous structure inside the concrete (Turhan [12]).
The permeable pore space volume value increases in accordance
with the decrease in temperature value to which the concrete is
exposed.
It was observed that water absorption ratio of porous concrete
increased regarding to the permeable pore space volume value.
It was observed that, porous structures inside the concrete also
decreased the unit volume weight of the concrete.
The amount of capillary absorbed water decreases in accor-
dance with the decrease in temperature to which fresh concrete
is exposed. The reason for this might be that the voids which are
formed due to the freezing of the water inside the concrete dur-
Fig. 8. Mean Poisson’s ratio values.
Fig. 9. Mean tensile strength values.
208 M. Çullu, M. Arslan / Composites: Part B 50 (2013) 202–209](https://image.slidesharecdn.com/ullu2013-230730163214-0337dd23/75/ullu2013-pdf-7-2048.jpg)
![ing hydration cut the capillary canals and thus a decrease in the
amount of water penetrating the concrete through the capillary
method is decreased.
Considering impermeability, if pressurized water is applied on
the surface of concrete, the amount of water which penetrates
the concrete decreased due to the porous structure inside the
concrete during hydration process.
The exposure of the fresh concrete to frost not only affect the
physical properties but also the mechanical properties. With
the decrease of the temperature which the concrete is exposed,
compressive and tensile strength values, static modulus of elas-
ticity values are also decreased.
The exposure of fresh concrete to frost has a negative impact on
the concrete’s physical and mechanical properties. These con-
cretes should be absolutely protected. Otherwise, the physical
and mechanical properties which are expected from the con-
crete cannot be achieved, and thus, concrete fails to show an
adequate resistance to negative environmental and corrosive
environments.
References
[1] Subas
ßı S, Koçak Y, Beycioğlu A. The effect of vibration period on physical and
mechanical properties at fly ash replaced concrete. Dumlupınar Univ J Inst Sci
Technol Ağustos 2010;22:109–22.
[2] Korhonen CJ. Expendient low-temperature concrete admixtures for army USA:
US Army Corps of Engineers Cold Regions Research Engineering Laboratory;
1999. p. 1–20.
[3] Shoukry SN, William GW, Downie B, Riad MY. Effect of moisture and
temperature on the mechanical properties of concrete. Constr Build Mater
2011;25:688–96.
[4] Picketh G. Flow of moisture in hardened cement during freezing. Highway Res
Board 1953;32:276–84.
[5] Prado PJ, Balcom BJ, Beyea TW, Armstrong RL, Grattan-Bellew PE. Concrete
freze/thaw as studied by magnetic resonance imagine. Cem Concr Res
1998;2(28):261–70.
[6] Pigeon M, Gagne R, Aitcin PC, Banthia N. Freezing and thawing tests of high
strength concretes. Cem Concr Res 1991;5(21):844–52.
[7] Cai H, Liu X. Freze-thaw durability of concrete: ice formation process in pores.
Res Cem Concr 1998;9(28):1281–7.
[8] Arslan M, Subas
ßı S. The effects of controlled-permeable formworks on the
surface hardness of the concrete. J Fac Eng Arch Gazi Univ 2008;23(4):885–94.
[9] Arslan M, Subas
ßı S, Durmus
ß G. The Effects of formwork surfaces on capillarity
and frost resistance of concrete cover. Ready Mixed Concr J 2002;50:60–6.
[10] Nmai CK. Cold weather concreting admixtures. Cem Concr Compos 1998;2–
3(20):121–8.
[11] Türkel S. Production of concrete in cold weather conditions. In: Earthquake
symposium. Us
ßak; 2003. p. 32–45.
[12] Turhan YE. Concrete. Ankara: METU Press; 2003.
[13] Baradan B, Yazıcı H, Ün H. Concrete and concrete structures persistence
(durability). Izmir: Dokuz Eylül University Engineering Publications; 2002.
[14] ACI Committee 306. ACI 306.R-88 cold weather concreting. American Concrete
Institute. Detroit, Michigan: American Concrete Institute; 1988. p. 1–23.
[15] Suprenant BA. Freezing concrete as a construction practice. Cold Reg Sci
Technol 1985;11(2):195–7.
[16] Yıldırım H, Pekmezci BY, Ardaç V. Contribution of the use of antifreeze effect of
concrete compressive strength of concrete. J Constr Chem Sec 2007;1:66–9.
[17] EN 706 12620+A1. Aggregates for concrete. Ankara: Turkish Standards
Institute; 2009. p. 1–50.
[18] ASTM C 494. Standard specification for chemical admixtures for concrete.
Concrete and mineral aggregates. Annual Book of ASTM Standards.
Philadelphia, USA; 2004. p. 1–10.
[19] TS 11746. Chemical admixtures for concrete antifreezing agents for
concrete. Ankara: Turkish Standards Institute; 1995. p. 1–14.
[20] EN 934-2. Admixtures for concrete, mortar and grout – Part 2: concrete
admixtures – definitions, requirements, conformity, marking and
labelling. Ankara: Turkish Standards Institute; 2011. p. 1–24.
[21] Arslan M, Çullu M, Durmus
ß G. The effect of antifreeze admixtures on
compressive strength of concretes subjected to frost action. Gazi Univ J Sci
2011;24(2):299–307.
[22] ASTM C642. Standard test method for density, absorption, and voids in
hardened concrete. Annual Book of ASTM Standards. Philadelphia, USA; 2004.
p. 1–3.
[23] EN 12390-7. Testing hardened concrete – Part 7: Density of hardened
concrete. Ankara: Turkish Standards Institute; 2010. p. 1–11.
[24] ASTM C1585. Standard test method for measurement of rate of absorption of
water by hydraulic-cement concretes. Annual Book of ASTM Standards.
Philadelphia, USA; 2004. p. 1–6.
[25] EN 12390-8. Testing hardened concrete – Part 8: Depth of penetration of water
under pressure. Ankara: Turkish Standards Institute; 2010. p. 1–7.
[26] EN 12390-3. Testing hardened concrete – Part 3: Compressive strength of test
specimens. Ankara: Turkish Standards Institute; 2010. p. 1–19.
[27] ASTM C469. Standard test method for static modulus of elasticity and
Poisson’s ratio of concrete in compression. Annual Book of ASTM Standards.
Philadelphia, USA; 2002. p. 1–5.
[28] ASTM C496. Standard test method for splitting tensile strength of cylindrical
concrete specimens. Annual Book of ASTM Standards. Philadelphia, USA; 2004.
p. 1–5.
M. Çullu, M. Arslan / Composites: Part B 50 (2013) 202–209 209](https://image.slidesharecdn.com/ullu2013-230730163214-0337dd23/75/ullu2013-pdf-8-2048.jpg)


