This document discusses public transportation in London, focusing on the city's suburban railway system. It provides details on:
1) The organizational structures that oversee public transportation in London, including the roles of the Mayor, Transport for London, and London boroughs.
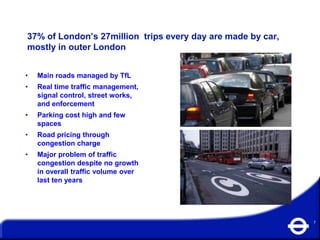
2) Ridership statistics for different transportation modes in London, including trains carrying over 5 million passengers daily.
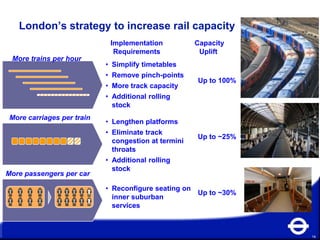
3) London's strategies to enhance the capacity of its suburban rail network through 2025, including running more frequent trains, lengthening trains, and increasing passenger capacity on individual cars.
4) Expected capacity increases of up to 100% on some lines through these infrastructure upgrades and service improvements to the rail network.