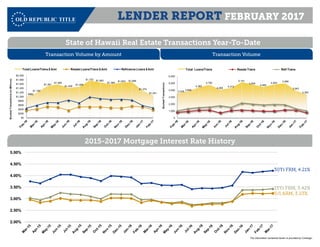
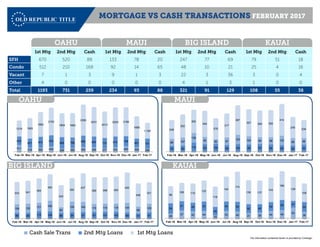
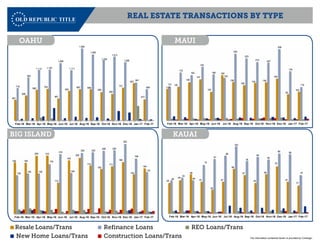
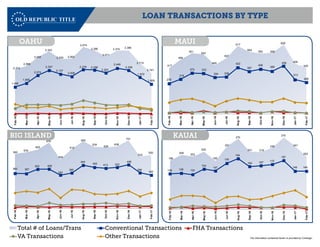
LENDER REPORT
State of Hawaii | FEBRUARY 2017
This is a monthly report on sales on lender activity for real estate transactions in the state of Hawaii. The report includes historical data on real estate transaction volume
by loan type and mortgage interest rates. All information is taken from Corelogic. Information shown herein, while not guaranteed, is derived from sources deemed reliable.
Old Republic Title is providing this information as a free customer service and makes no warranties or representations as to its accuracy.
ASHLEY SEEGER, VP
Business Development
ASeeger@ortc.com
Cell 808-222-3021
The information contained herein is provided by Corelogic.
State of Hawaii Real Estate Transactions Year-To-Date
2015-2017 Mortgage Interest Rate History
$982
$1,192
$1,491
$1,569
$1,409
$1,459
$1,753 $1,663
$1,584
$1,653 $1,686
$1,274
$1,051
$0
$200
$400
$600
$800
$1,000
$1,200
$1,400
$1,600
$1,800
$2,000
BookedTransactions(inMillions)
Transaction Volume by Amount
Total Loans/Trans $ Amt Resale Loans/Trans $ Amt Refinance Loans $ Amt
3,535
3,846
4,383
4,782
4,065
4,313
5,151
4,805
4,469
4,803
4,990
3,943
3,363
0
1,000
2,000
3,000
4,000
5,000
6,000
BookedTransactions
Transaction Volume
Total Loans/Trans Resale Trans Refi Trans
2.00%
2.50%
3.00%
3.50%
4.00%
4.50%
5.00%
15Yr FRM, 3.42%
30Yr FRM, 4.21%
5/1 ARM, 3.23%
Transaction Volume by Amount Transaction Volume
LENDER REPORT FEBRUARY 2017
The information contained herein is provided by Corelogic.
78 80
119 100 105 89 100 98 101 95 89 80 93
89 107
128
95 60 97
123 104 90 98 122
99 88
248
302
302
345
276
317
387
357 350 355
414
276
234
Feb-16 Mar-16 Apr-16 May-16 Jun-16 Jul-16 Aug-16 Sep-16 Oct-16 Nov-16 Dec-16 Jan-17 Feb-17
   
OAHU MAUI BIG ISLAND KAUAI
    1st Mtg 2nd Mtg Cash 1st Mtg 2nd Mtg Cash 1st Mtg 2nd Mtg Cash 1st Mtg 2nd Mtg Cash
SFH 670 520 88 133 78 20 247 77 69 79 51 18
Condo 512 210 168 92 14 65 48 10 21 25 4 16
Vacant 7 1 3 9 1 3 22 3 36 3 0 4
Other 4 0 0 0 0 0 4 1 3 1 0 0
Total 1193 731 259 234 93 88 321 91 129 108 55 38
511 319 320 402 246 292 353 329 277 333 420 339 259
633
677 813 833
868 796 868 820 770 812 758
661 731
1219 1563
1883
2103
1809 1852
2350
2231
2013
2220 2198
1699
1,193
Feb-16 Mar-16 Apr-16 May-16 Jun-16 Jul-16 Aug-16 Sep-16 Oct-16 Nov-16 Dec-16 Jan-17 Feb-17
37 30 31 32 57 41 33 33 28 40 42 39 34
37 37 48 49
52 56 52 48 47 56 48 52 40
86 87
119 140
131 156 136 119 118 116
80 96 95
Jan-15 Feb-15 Mar-15 Apr-15 May-15 Jun-15 Jul-15 Aug-15 Sep-15 Oct-15 Nov-15 Dec-15 Jan-16
Cash Sale Trans 2nd Mtg Loans 1st Mtg Loans
86 85 112 106 86 94 97 97 101 102 89 77 91
126 135
121 160
80
159 149 119 119 118 144
98
129
333 341
364
393
330
350
427
399 396 405
450
348
321
Feb-16 Mar-16 Apr-16 May-16 Jun-16 Jul-16 Aug-16 Sep-16 Oct-16 Nov-16 Dec-16 Jan-17 Feb-17
28
47 42 44
19
43 40 31 35 44 48 63
38
59
51 49 53
46
54 55
50 46
49
58 37
55
98
106 110
122
118
144
174
139 137
143
166
139
108
Feb-16 Mar-16 Apr-16 May-16 Jun-16 Jul-16 Aug-16 Sep-16 Oct-16 Nov-16 Dec-16 Jan-17 Feb-17
OAHU
BIG ISLAND KAUAI
MAUI
MORTGAGE VS CASH TRANSACTIONS FEBRUARY 2017
The information contained herein is provided by Corelogic.
113
120
136
147
102
162
138
126
134 136
149
93
102
121
172
162
192
166
153
240
223
210
207
256
176
119
Feb-16 Mar-16 Apr-16 May-16 Jun-16 Jul-16 Aug-16 Sep-16 Oct-16 Nov-16 Dec-16 Jan-17 Feb-17
461
556
680
703
487
653
697 696
630
592
731
827
473
718
952
1,113 1,120
1,266
1,111
1,594
1,462
1,334
1,413
1,285
841
690
Feb-16 Mar-16 Apr-16 May-16 Jun-16 Jul-16 Aug-16 Sep-16 Oct-16 Nov-16 Dec-16 Jan-17 Feb-17
185 184
209 210
112
193
202
174
162
171
186
142
164
139
145 145
179
216
148
220 222
228 230
252
199
151
Feb-16 Mar-16 Apr-16 May-16 Jun-16 Jul-16 Aug-16 Sep-16 Oct-16 Nov-16 Dec-16 Jan-17 Feb-17
45
49
58
47
35
47
66
57
45
58
70
47
41
49
53
49
72
81
86
100
78
84
80
89 88
57
Feb-16 Mar-16 Apr-16 May-16 Jun-16 Jul-16 Aug-16 Sep-16 Oct-16 Nov-16 Dec-16 Jan-17 Feb-17
OAHU
BIG ISLAND KAUAI
MAUI
119 110
119
162
149 152 157 154
130 132 125
185
129
127 128
107
121
130 125
133
106
154 152
143
175
133
Jan-14 Feb-14 Mar-14 Apr-14 May-14 Jun-14 Jul-14 Aug-14 Sep-14 Oct-14 Nov-14 Dec-14 Jan-15
Resale Loans/Trans Refinance Loans REO Loans/Trans
New Home Loans/Trans Construction Loans/Trans
REAL ESTATE TRANSACTIONS BY TYPE
The information contained herein is provided by Corelogic.
417
494
551
543
445
507
617
564
550 555
628
458
420
278
318
373 370
334 338
422
387
408
389
436
313
289
Feb-16
Mar-16
Apr-16
May-16
Jun-16
Jul-16
Aug-16
Sep-16
Oct-16
Nov-16
Dec-16
Jan-17
Feb-17
2,372
2,566
3,025
3,343
2,930 2,953
3,574
3,386
3,071
3,374
3,386
2,710
2,191
1,456
1,655
2,074
2,337
2,137
2,008
2,378 2,356
2,203
2,449
2,339
1,972
1,609
Feb-16
Mar-16
Apr-16
May-16
Jun-16
Jul-16
Aug-16
Sep-16
Oct-16
Nov-16
Dec-16
Jan-17
Feb-17560
578
605
676
505
612
690
634
629
638
701
534
550
360 357
403 405
343
365
444
422 413 422
449
366
342
Feb-16
Mar-16
Apr-16
May-16
Jun-16
Jul-16
Aug-16
Sep-16
Oct-16
Nov-16
Dec-16
Jan-17
Feb-17
186
208
202
220
185
241
270
221 219
236
275
241
202
136 138 133
154
147
176
194
164 167 172
187
146 146
Feb-16
Mar-16
Apr-16
May-16
Jun-16
Jul-16
Aug-16
Sep-16
Oct-16
Nov-16
Dec-16
Jan-17
Feb-17
OAHU
BIG ISLAND KAUAI
MAUI
435 465 445 535 550 529 551 466 516 490 457 592 445
Jan-14 Feb-14 Mar-14 Apr-14 May-14 Jun-14 Jul-14 Aug-14 Sep-14 Oct-14 Nov-14 Dec-14 Jan-15
Total # of Loans/Trans Conventional Transactions FHA Transactions
VA Transactions Other Transactions
LOAN TRANSACTIONS BY TYPE

Lender report february 2017 as (1)

  • 1.
    LENDER REPORT State ofHawaii | FEBRUARY 2017 This is a monthly report on sales on lender activity for real estate transactions in the state of Hawaii. The report includes historical data on real estate transaction volume by loan type and mortgage interest rates. All information is taken from Corelogic. Information shown herein, while not guaranteed, is derived from sources deemed reliable. Old Republic Title is providing this information as a free customer service and makes no warranties or representations as to its accuracy. ASHLEY SEEGER, VP Business Development ASeeger@ortc.com Cell 808-222-3021
  • 2.
    The information containedherein is provided by Corelogic. State of Hawaii Real Estate Transactions Year-To-Date 2015-2017 Mortgage Interest Rate History $982 $1,192 $1,491 $1,569 $1,409 $1,459 $1,753 $1,663 $1,584 $1,653 $1,686 $1,274 $1,051 $0 $200 $400 $600 $800 $1,000 $1,200 $1,400 $1,600 $1,800 $2,000 BookedTransactions(inMillions) Transaction Volume by Amount Total Loans/Trans $ Amt Resale Loans/Trans $ Amt Refinance Loans $ Amt 3,535 3,846 4,383 4,782 4,065 4,313 5,151 4,805 4,469 4,803 4,990 3,943 3,363 0 1,000 2,000 3,000 4,000 5,000 6,000 BookedTransactions Transaction Volume Total Loans/Trans Resale Trans Refi Trans 2.00% 2.50% 3.00% 3.50% 4.00% 4.50% 5.00% 15Yr FRM, 3.42% 30Yr FRM, 4.21% 5/1 ARM, 3.23% Transaction Volume by Amount Transaction Volume LENDER REPORT FEBRUARY 2017
  • 3.
    The information containedherein is provided by Corelogic. 78 80 119 100 105 89 100 98 101 95 89 80 93 89 107 128 95 60 97 123 104 90 98 122 99 88 248 302 302 345 276 317 387 357 350 355 414 276 234 Feb-16 Mar-16 Apr-16 May-16 Jun-16 Jul-16 Aug-16 Sep-16 Oct-16 Nov-16 Dec-16 Jan-17 Feb-17     OAHU MAUI BIG ISLAND KAUAI     1st Mtg 2nd Mtg Cash 1st Mtg 2nd Mtg Cash 1st Mtg 2nd Mtg Cash 1st Mtg 2nd Mtg Cash SFH 670 520 88 133 78 20 247 77 69 79 51 18 Condo 512 210 168 92 14 65 48 10 21 25 4 16 Vacant 7 1 3 9 1 3 22 3 36 3 0 4 Other 4 0 0 0 0 0 4 1 3 1 0 0 Total 1193 731 259 234 93 88 321 91 129 108 55 38 511 319 320 402 246 292 353 329 277 333 420 339 259 633 677 813 833 868 796 868 820 770 812 758 661 731 1219 1563 1883 2103 1809 1852 2350 2231 2013 2220 2198 1699 1,193 Feb-16 Mar-16 Apr-16 May-16 Jun-16 Jul-16 Aug-16 Sep-16 Oct-16 Nov-16 Dec-16 Jan-17 Feb-17 37 30 31 32 57 41 33 33 28 40 42 39 34 37 37 48 49 52 56 52 48 47 56 48 52 40 86 87 119 140 131 156 136 119 118 116 80 96 95 Jan-15 Feb-15 Mar-15 Apr-15 May-15 Jun-15 Jul-15 Aug-15 Sep-15 Oct-15 Nov-15 Dec-15 Jan-16 Cash Sale Trans 2nd Mtg Loans 1st Mtg Loans 86 85 112 106 86 94 97 97 101 102 89 77 91 126 135 121 160 80 159 149 119 119 118 144 98 129 333 341 364 393 330 350 427 399 396 405 450 348 321 Feb-16 Mar-16 Apr-16 May-16 Jun-16 Jul-16 Aug-16 Sep-16 Oct-16 Nov-16 Dec-16 Jan-17 Feb-17 28 47 42 44 19 43 40 31 35 44 48 63 38 59 51 49 53 46 54 55 50 46 49 58 37 55 98 106 110 122 118 144 174 139 137 143 166 139 108 Feb-16 Mar-16 Apr-16 May-16 Jun-16 Jul-16 Aug-16 Sep-16 Oct-16 Nov-16 Dec-16 Jan-17 Feb-17 OAHU BIG ISLAND KAUAI MAUI MORTGAGE VS CASH TRANSACTIONS FEBRUARY 2017
  • 4.
    The information containedherein is provided by Corelogic. 113 120 136 147 102 162 138 126 134 136 149 93 102 121 172 162 192 166 153 240 223 210 207 256 176 119 Feb-16 Mar-16 Apr-16 May-16 Jun-16 Jul-16 Aug-16 Sep-16 Oct-16 Nov-16 Dec-16 Jan-17 Feb-17 461 556 680 703 487 653 697 696 630 592 731 827 473 718 952 1,113 1,120 1,266 1,111 1,594 1,462 1,334 1,413 1,285 841 690 Feb-16 Mar-16 Apr-16 May-16 Jun-16 Jul-16 Aug-16 Sep-16 Oct-16 Nov-16 Dec-16 Jan-17 Feb-17 185 184 209 210 112 193 202 174 162 171 186 142 164 139 145 145 179 216 148 220 222 228 230 252 199 151 Feb-16 Mar-16 Apr-16 May-16 Jun-16 Jul-16 Aug-16 Sep-16 Oct-16 Nov-16 Dec-16 Jan-17 Feb-17 45 49 58 47 35 47 66 57 45 58 70 47 41 49 53 49 72 81 86 100 78 84 80 89 88 57 Feb-16 Mar-16 Apr-16 May-16 Jun-16 Jul-16 Aug-16 Sep-16 Oct-16 Nov-16 Dec-16 Jan-17 Feb-17 OAHU BIG ISLAND KAUAI MAUI 119 110 119 162 149 152 157 154 130 132 125 185 129 127 128 107 121 130 125 133 106 154 152 143 175 133 Jan-14 Feb-14 Mar-14 Apr-14 May-14 Jun-14 Jul-14 Aug-14 Sep-14 Oct-14 Nov-14 Dec-14 Jan-15 Resale Loans/Trans Refinance Loans REO Loans/Trans New Home Loans/Trans Construction Loans/Trans REAL ESTATE TRANSACTIONS BY TYPE
  • 5.
    The information containedherein is provided by Corelogic. 417 494 551 543 445 507 617 564 550 555 628 458 420 278 318 373 370 334 338 422 387 408 389 436 313 289 Feb-16 Mar-16 Apr-16 May-16 Jun-16 Jul-16 Aug-16 Sep-16 Oct-16 Nov-16 Dec-16 Jan-17 Feb-17 2,372 2,566 3,025 3,343 2,930 2,953 3,574 3,386 3,071 3,374 3,386 2,710 2,191 1,456 1,655 2,074 2,337 2,137 2,008 2,378 2,356 2,203 2,449 2,339 1,972 1,609 Feb-16 Mar-16 Apr-16 May-16 Jun-16 Jul-16 Aug-16 Sep-16 Oct-16 Nov-16 Dec-16 Jan-17 Feb-17560 578 605 676 505 612 690 634 629 638 701 534 550 360 357 403 405 343 365 444 422 413 422 449 366 342 Feb-16 Mar-16 Apr-16 May-16 Jun-16 Jul-16 Aug-16 Sep-16 Oct-16 Nov-16 Dec-16 Jan-17 Feb-17 186 208 202 220 185 241 270 221 219 236 275 241 202 136 138 133 154 147 176 194 164 167 172 187 146 146 Feb-16 Mar-16 Apr-16 May-16 Jun-16 Jul-16 Aug-16 Sep-16 Oct-16 Nov-16 Dec-16 Jan-17 Feb-17 OAHU BIG ISLAND KAUAI MAUI 435 465 445 535 550 529 551 466 516 490 457 592 445 Jan-14 Feb-14 Mar-14 Apr-14 May-14 Jun-14 Jul-14 Aug-14 Sep-14 Oct-14 Nov-14 Dec-14 Jan-15 Total # of Loans/Trans Conventional Transactions FHA Transactions VA Transactions Other Transactions LOAN TRANSACTIONS BY TYPE