Tricumen / Capital Markets: Results Review 1Q14

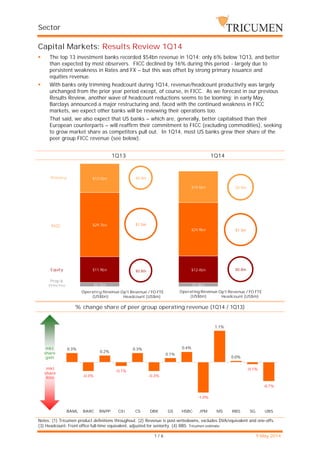
The top 13 investment banks recorded $54bn revenue in 1Q14: only 6% below 1Q13, and better than expected by most observers. FICC declined by 16% during this period - largely due to persistent weakness in Rates and FX – but this was offset by strong primary issuance and equities revenue. With banks only trimming headcount during 1Q14, revenue/headcount productivity was largely unchanged from the prior year period except, of course, in FICC. As we forecast in our previous Results Review, another wave of headcount reductions seems to be looming: in early May, Barclays announced a major restructuring and, faced with the continued weakness in FICC markets, we expect other banks will be reviewing their operations too. That said, we also expect that US banks – which are, generally, better capitalised than their European counterparts – will reaffirm their commitment to FICC (excluding commodities), seeking to grow market share as competitors pull out. In 1Q14, most US banks grew their share of the peer group FICC revenue.

Recommended
Recommended
More Related Content
What's hot
What's hot (20)
Viewers also liked
Similar to Tricumen / Capital Markets: Results Review 1Q14
Similar to Tricumen / Capital Markets: Results Review 1Q14 (20)
More from Tricumen Ltd
More from Tricumen Ltd (13)
Recently uploaded
Recently uploaded (20)
Tricumen / Capital Markets: Results Review 1Q14
- 1. Sector 1 / 6 9 May 2014 Capital Markets: Results Review 1Q14 The top 13 investment banks recorded $54bn revenue in 1Q14: only 6% below 1Q13, and better than expected by most observers. FICC declined by 16% during this period - largely due to persistent weakness in Rates and FX – but this was offset by strong primary issuance and equities revenue. With banks only trimming headcount during 1Q14, revenue/headcount productivity was largely unchanged from the prior year period except, of course, in FICC. As we forecast in our previous Results Review, another wave of headcount reductions seems to be looming: in early May, Barclays announced a major restructuring and, faced with the continued weakness in FICC markets, we expect other banks will be reviewing their operations too. That said, we also expect that US banks – which are, generally, better capitalised than their European counterparts – will reaffirm their commitment to FICC (excluding commodities), seeking to grow market share as competitors pull out. In 1Q14, most US banks grew their share of the peer group FICC revenue (see below). 1Q13 1Q14 % change share of peer group operating revenue (1Q14 / 1Q13) Notes: (1) Tricumen product definitions throughout. (2) Revenue is post-writedowns, excludes DVA/equivalent and one-offs. (3) Headcount: Front office full-time equivalent, adjusted for seniority. (4) RBS: Tricumen estimate. $0.9m $1.3m $0.8m 0.5 1 1.5 2 2.5 3 3.5 0.8 1 1.2 $0.8m $1.5m $0.8m 0.5 1 1.5 2 2.5 3 3.5 0.8 1 1.2 FICC Equity Prop & PrincInv Primary Operating Revenue (US$bn) Op't Revenue /FO FTE Headcount (US$m) Operating Revenue (US$bn) Op't Revenue /FO FTE Headcount (US$m) $2.1bn $1.8bn $11.9bn $12.4bn $29.7bn $24.9bn $13.5bn $14.5bn 0 10 20 30 40 50 60 70 3m13 0.3% -0.3% 0.2% -0.1% 0.3% -0.3% 0.1% 0.4% -1.0% 1.1% 0.0% -0.1% -0.7% -0.015 -0.01 -0.005 0 0.005 0.01 0.015 BAML BARC BNPP Citi CS DBK GS HSBC JPM MS RBS SG UBS mkt share gain mkt share loss
- 2. Sector 2 / 6 9 May 2014 Primary issuance & Advisory In DCM bonds, top players saw a small decline in volumes versus 1Q13, but suffered a sharp fall in fees in all regions except Europe. Globally, loan fees held up despite a decline in volume, but this was entirely due to strong fee generation in Americas. In securitisation, Agency MBS trading volumes declined in both January and February. Seeking to stimulate bank lending growth, European regulators – led by ECB and Bank of England – are advocating the expansion of asset-backed bond market; there are also signs that rules on securitisation of corporate loans may be relaxed. ECM fees matched the strong 1Q13 as fees advanced ahead of volumes. Europe led the way in volume of deals and saw a surge in fees versus 1Q13. Banks are understandably cautious about the outlook, but are optimistic. M&A surged versus 1Q13. We hear of fees being pressured, however, especially – and this may come as a surprise to some - in Europe. With one exception, banks reported growth in backlog. 1Q13 1Q14 % change share of peer group operating revenue (1Q14 / 1Q13) Notes: (1) Tricumen product definitions throughout. (2) Revenue is post-writedowns, excludes DVA/equivalent and one-offs. (3) Headcount: Front office full-time equivalent, adjusted for seniority. (4) RBS: Tricumen estimate. $1.0m $2.3m $0.3m 0.5 1 1.5 2 2.5 3 3.5 0.8 1 1.2 $1.1m $2.2m $0.4m 0.5 1 1.5 2 2.5 3 3.5 0.8 1 1.2 DCM & Securitisation ECM M&A / Advisory Operating Revenue (US$bn) Op't Revenue /FO FTE Headcount (US$m) Operating Revenue (US$bn) Op't Revenue /FO FTE Headcount (US$m) $2.2bn $2.9bn $2.5bn $2.4bn $8.8bn $9.2bn 0 2 4 6 8 10 12 14 16 3m13 -0.8% 5.7% 0.0% -1.4% -0.5% -1.4% 0.5% -0.1% -0.8% 0.8% 0.0% -0.0% -1.7% -0.03 -0.02 -0.01 0 0.01 0.02 0.03 0.04 0.05 0.06 0.07 BAML BARC BNPP Citi CS DBK GS HSBC JPM MS RBS SG UBS mkt share gain mkt share loss
- 3. Sector 3 / 6 9 May 2014 FICC A decline in FX revenue was largely due to a decline in volatility and the impact of Dodd-Frank, which has pushed US traded FX Options and NDFs to central clearing and reduced margins available to dealers. We also note a general decline in G10 revenue, but not in emerging markets e.g. in some APAC jurisdictions, higher bid-offer spreads almost doubled client revenues. A continued weakness in Rates reflects the increase in electronic trading across US and European Govts as well as the impact of central clearing – but also, and more importantly in 1Q14 – a drop in risk-related revenues as some banks incorrectly forecast The Fed’s actions. Credit held up well supported by a strong start in European and US trading. APAC ex-Japan weakened, however, as volumes declined, offsetting an improvement in margins. Banks with constrained credit inventories are at a disadvantage versus peers with stronger balance sheets. In commodities, strong metals trading volumes in APAC January and March softened the impact of the continued weakness in the US and European energy markets. More precious metals desks were folded into FX units, a trend partially driven by cost considerations. 1Q13 1Q14 % change share of peer group operating revenue: FICC total (1Q14 / 1Q13) Notes: (1) Tricumen product definitions throughout. (2) Revenue is post-writedowns, excludes DVA/equivalent and one-offs. (3) Headcount: Front office full-time equivalent, adjusted for seniority. (4) RBS: Tricumen estimate. $1.6m $1.4m $2.3m $1.0m 0.5 1 1.5 2 2.5 3 3.5 0.8 1 1.2 $1.5m $1.0m $2.2m $0.8m 0.5 1 1.5 2 2.5 3 3.5 0.8 1 1.2 FX Rates Credit Commodities Operating Revenue (US$bn) Op't Revenue /FO FTE Headcount (US$m) Operating Revenue (US$bn) Op't Revenue /FO FTE Headcount (US$m) $2.2bn $1.7bn $10.3bn $9.9bn $11.1bn $8.0bn $6.1bn $5.3bn 0 5 10 15 20 25 30 35 3m13 0.5% -2.1% -0.5% 1.5% 0.3% 0.8% 0.3% 0.7% -0.9% 0.8% 0.0% -0.6% -0.9% -0.025 -0.02 -0.015 -0.01 -0.005 0 0.005 0.01 0.015 0.02 BAML BARC BNPP Citi CS DBK GS HSBC JPM MS RBS SG UBS mkt share gain mkt share loss
- 4. Sector 4 / 6 9 May 2014 Equities Strong electronic volumes in North America and Japan drove cash equity trading to levels exceeding even those seen in the strong 1Q13. Several banks are investing in this area: with FICC under pressure, we expect this trend will accelerate in the coming quarters. Equity derivative revenues grew, helped by the European and the US investors’ continued shift away from rate-based to equity-based structured product. In prime services, higher prime brokerage fees were offset by weaker securities lending performance. 1Q13 1Q14 % change share of peer group operating revenue (1Q14 / 1Q13) Notes: (1) Tricumen product definitions throughout. (2) Revenue is post-writedowns, excludes DVA/equivalent and one-offs. (3) Headcount: Front office full-time equivalent, adjusted for seniority. (4) RBS: Tricumen estimate. $0.5m $1.2m $0.8m 0.5 1 1.5 2 2.5 3 3.5 0.8 1 1.2 $0.5m $1.2m $0.9m 0.5 1 1.5 2 2.5 3 3.5 0.8 1 1.2 EQ Cash EQ Derv'& COnverts Prime Services Operating Revenue (US$bn) Op't Revenue /FO FTE Headcount (US$m) Operating Revenue (US$bn) Op't Revenue /FO FTE Headcount (US$m) $2.4bn $2.7bn $5.9bn $6.0bn $3.6bn $3.7bn 0 2 4 6 8 10 12 14 3m13 0.0% -1.0% 1.4% -0.0% -0.3% 0.1% -1.2% 0.8% -1.1% 0.8% 0.0% 0.1% 0.3% -0.015 -0.01 -0.005 0 0.005 0.01 0.015 0.02 BAML BARC BNPP Citi CS DBK GS HSBC JPM MS RBS SG UBS mkt share gain mkt share loss
- 5. Sector 5 / 6 9 May 2014 Revenue rankings 1Q14 (Operating revenue, US$, Global Level 1) Source: Tricumen. Notes: (1) Tricumen product definitions throughout. (2) Arrows show % change in revenue vs peers. Up- /down-arrows: top-/bottom-quartile. (3) Revenue is post-writedowns, excludes DVA/equivalent and one-offs, as described in the Company Section. (4) RBS: Tricumen estimate. Revenue dynamics 1Q14/1Q13 (Operating revenue, % change, US$, Global Level 1) Source: Tricumen. Notes: (1) Tricumen product definitions throughout. (2) Arrows show % change in revenue vs peers. Up- /down-arrows: top-/bottom-quartile. (3) Revenue is post-writedowns, excludes DVA/equivalent and one-offs, as described in the Company Section. (4) RBS: Tricumen estimate. BAML BARC BNPP Citi CS DBK GS HSBC JPM MS RBS SG UBS Capital Markets: Total 3 1 2 Primary 2 3 1 DCM Bonds 2 1 3 DCM Loans 2 3 1 Securitisation 2 3 1 ECM 3 1 2 M&A / Advisory 1 3 2 Secondary 3 2 1 FX 3 1 2 Rates 2 3 1 Credit 3 2 1 Commodities 2 1 3 EQ Cash 3 1 2 EQ Derv & Converts 3 2 1 Prime Services 3 1 2 Prop Trading 2 1 3 Principal Investments 1 2 3 BAML BARC BNPP Citi CS DBK GS HSBC JPM MS RBS SG UBS Top 25% Bottom 25% Capital Markets: Total -2% -9% Primary +9% +0% DCM Bonds +4% -13% DCM Loans +4% -12% Securitisation +6% -9% ECM N/M +14% +1% M&A / Advisory N/M +43% +10% Secondary -5% -14% FX -8% -18% Rates -17% -34% Credit +6% -6% Commodities N/M +3% -37% EQ Cash N/M +10% -6% EQ Derv & Converts N/M +6% -9% Prime Services N/M +15% +4% Prop Trading N/M N/M N/M N/M N/M N/M N/M -6% -26% Principal Investments N/M N/M N/M N/M N/M N/M N/M +4% -19%
- 6. Sector 6 / 6 9 May 2014 About Tricumen Tricumen was founded in 2008. It quickly became a strong provider of diversified market intelligence across the capital markets and has since expanded into transaction and corporate banking coverage. Tricumen’s data has been used by many of the world’s leading investment banks as well as strategy consulting firms, investment managers and ‘blue chip’ corporations. Situated near Cambridge in the UK, Tricumen is almost exclusively staffed with senior individuals with an extensive track record of either working for or analysing banks; and boasts what we believe is the largest capital markets-focused research network of its peer group. Notes & Caveats This report and the information contained herein may not be reproduced or distributed in the whole or in part without the prior written consent of Tricumen Limited. Such consent is often given, provided that the information released is sourced to Tricumen and that it does not prejudice Tricumen Limited’s business or compromise the company’s ability to analyse the financial markets. Tricumen Limited has used all reasonable care in writing, editing and presenting the information found in this report. All reasonable effort has been made to ensure the information supplied is accurate and not misleading. For the purposes of cross- market comparison, all numerical data is normalised in accordance to Tricumen Limited’s proprietary product classification. Fully-researched dataset may contain margin of error of +/-10%; for modelled datasets, this margin may be wider. The information and commentary provided in this report has been compiled for informational purposes only. We recommend that independent advice and enquiries should be sought before acting upon it. Readers should not rely on this information for legal, accounting, investment, or similar purposes. No part of this report constitutes investment advice, any form of recommendation, or a solicitation to buy or sell any instrument or to engage in any trading or investment activity or strategy. Tricumen Limited does not provide investment advice or personal recommendation nor will it be deemed to have done so. Tricumen Limited makes no representation, guarantee or warranty as to the suitability, accuracy or completeness of the report or the information therein. Tricumen Limited assumes no responsibility for information contained in this report and disclaims all liability arising from negligence or otherwise in respect of such information. Tricumen Limited is not liable for any damages arising in contract, tort or otherwise from the use of or inability to use this report or any material contained in it, or from any action or decision taken as a result of using the report.