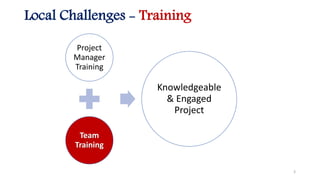
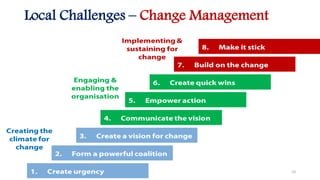
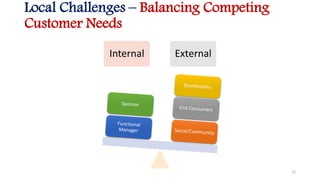
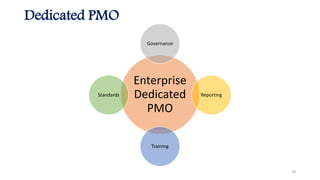
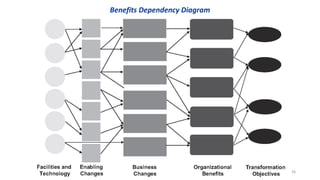
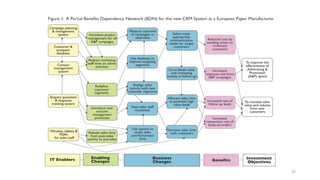
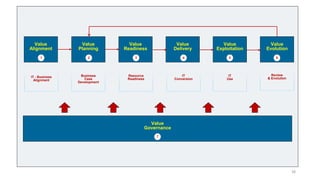
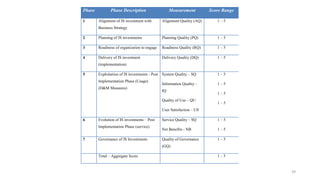
Outline
Local Challenges
Global Trends
My CSFs
1
Top 10 Local Challenges
Training
Resources
Empower
Leadership
Motivation
Structural
Cultural
Change M
Prediction
Customer
Needs
2
Local Challenges - Training
Project
Manager
Training
Team
Training
Knowledgeable
& Engaged
Project
3
Local Challenges - Resources
Adequate
Competent
Effective
Resources
4
Local Challenges – Lack of Empowerment
Team
Empowerment
Authority
Innovation
Decision-
Making
Trust
5
Local Challenges – Leadership Vacuum
6
Local Challenges – Lack of Motivation
7
Local Challenges – Stuck with Rigid
Functional Organizational Structures
8
Local Challenges – Country Barriers
Political Economic
Social Regional
Sectarian
9
Local Challenges – Change Management
10
Local Challenges – Prediction is Difficult
11
Local Challenges – Balancing Competing
Customer Needs
Internal External
12
Top 10 Global Trends
Agile
Mobility
Dedicated
PMO
Crowd-
sourcing
End of
E-Mail
EntreP
Design
Thinking
CPO
Analytics
& Big Data
Certification
Not
13
14
Mobility
15
The end of e-mail?
16
Crowdsourcing
17
Dedicated PMO
Enterprise
Dedicated
PMO
Governance
Reporting
Training
Standards
18
Project Management Entrepreneurship
19
Design Thinking
20
CEO
COO
CIO
CSO
CxO
CPO
21
22
23
My Top 10 CSFs
Training
Alignment
Readiness
Governance
Empower
Ownership
Structured
Agile
From PM to
BM
Benefits
Realization
From P to I
24
My Top 10 CSFs
Effective
Team
PM
Training
Team
Training
Sponsor
Training
25
Projects
Vision
Strategies
Mission
Objectives
Align Projects with Organizational Strategy
26
Organizational Readiness – The Missing Link
27
Appropriate Governance
PMO
28
Project / Team Empowerment
29
Structured Agile
Flexibility
Structure
30
Dual Emphasis on Effectiveness & Efficiency Success Measures
PM
BM
31
Project Ownership
Business
Ownership
Benefits
Value
Investment
32
Benefits should drive the project
33
Stage 1: Identify Value and Benefits
34
Benefit
Profile
Benefit No. Created ddmmyy Reviewed ddmmyy
Project Ref. No. Insert your SHSW project reference number
Benefit Title Short title summarising the expected benefit
Benefit Description Fuller description of the benefit and its context
Owner
Who is responsible for this profile and for ensuring the
expected benefit is achieved/realised fully
Support Objective(s)
List the organisational or departmental objective(s) this
benefit contributes to.
Enablers
List the key technology, process, organisational or other
changes required to achieve this benefit
Benefit
Type
Economy
(directly
reduces
cost)
yes/no
Efficiency
(frees up time
for other
activities)
yes/no
Effectiveness
(improves the
delivery or quality
of care outcomes)
yes/no
Unit of
Measure
In what
units and/or
what
qualitative
terms is the
benefit
measured
Baseline
Value
Estimated or
measured
current value
Target
Value
Estimated
or target
future
value
Method
How will
the
measure
be
taken?
Financial Value and
Assumptions
If applicable, state the overall financial value and supporting
assumptions (i.e. the estimated value of each unit of measure)
Start Date
The date from which
some or all of the
expected benefit will
be achieved
mmyy Measuring
Start Date
mmyy
Completion Date
The date by which
you expect the full
level of benefit to
be achieved
mmyy
Value for Money template
Please insert Project Name and Trust here
Financial Year 2014/15 2015/16 2016/17 2017/18 2018/19 2019/20 2020/21 2021/22 2022/23 2023/24 TOTAL
Discount rate 1.00 0.97 0.93 0.90 0.87 0.84 0.81 0.79 0.76 0.73
Cost category(excluding VAT)
1. Initial Capital expenditure -£ -£ -£ -£
2. Ongoing capital costs -£
3. Transition costs -£
4. Additional revenue costs associated with investment -£
TOTAL COSTS
-£ -£ -£ -£ -£ -£ -£ -£ -£ -£ -£
Benefit category
5. cost savings -£ -£
6. increased productivityof staff -£
7. Other quantifiable benefits £0 -£
TOTAL BENEFITS
-£ -£ -£ -£ -£ -£ -£ -£ -£ -£ -£
UNDISCOUNTEDTOTAL OFCOSTS ANDBENEFITS -£ -£ -£ -£ -£ -£ -£ -£ -£ -£ -£
DISCOUNTEDTOTAL OFCOSTS ANDBENEFITS -£ -£ -£ -£ -£ -£ -£ -£ -£ -£ -£
Undiscounted costs -£ -£ -£ -£ -£ -£ -£ -£ -£ -£ -£
Undiscounted benefits -£ -£ -£ -£ -£ -£ -£ -£ -£ -£ -£
Discounted costs -£ -£ -£ -£ -£ -£ -£ -£ -£ -£ -£
Discounted benefits -£ -£ -£ -£ -£ -£ -£ -£ -£ -£ -£
Discounted benefit to cost ratio #DIV/0!
Cumulative
(Last 4 Qs)
Ref Benefit Δ £ p.a. Δ £ Δ £ Δ £ Δ £ £ p.a.
A1
Reduced time spent entering
assessments 15% £12,500 5% £1,042 15% £3,125 £4,167
B3
Increase in accuracy of early
warning score calculation 10% n/a 6% n/a 11% n/a n/a
C2
Reduced instances of hospital
acquired infections 3% £10,000 0% 1.50% £1,250 £1,250
TOTALS £22,500 £1,042 £4,375 £0 £0 £5,417
NOTE: If the measurement or calculation approach applied differs from that stated in the Benefit Profile, please explain here
27/06/2014 30/09/2014
Target Q2 14 Q3 14 Q4 14 Q1 15
Stage 2: Define & Plan Stage 3: Track & Realise Stage 4: Evaluate
What:
A spreadsheet providing an early view of your
expected benefits, both financial and non-financial.
Includes estimated costs and shows the anticipated
VfM return
When:
During the application process
Why:
It helps you build support amongst internal
stakeholder and demonstrates that the project
meets the required level of return for central
investment
Product:
Value for Money (VfM) profile
Product:
Statement of Planned Benefits
Product:
Benefits Tracker
What:
A Word document providing greater detail of each
benefit and when you expect to achieve them.
Includes relevant dependencies, assumptions and
describes how each benefit will be measured
When:
Within one month of receiving your award or this
document (whichever is the latter). Updated
periodically as more information about individual
benefits becomes known.
Why:
Understanding key dependencies, governance
arrangements, and how/when benefits will be
measured improves your chances of achieving them.
Product:
Post-Project Review
What:
A spreadsheet used to record progress against each
benefit. It shows when they start to accrue and the
actual value delivered
When:
Updated once every three months after completing
your Statement of Planned Benefits
Why:
Tracking benefits is an essential part of measuring
progress towards your main objectives. As a whole,
the investment needs to show that the benefits
delivered justify the original investment. It will also
provide a basis for future funding rounds
The Integrated Benefits Management Lifecycle
What:
A Word document that compares the benefits
defined in the ‘Statement of Planned Benefits’ with
what was achieved on the ground
When:
Once the initial project has been completed and
associated changes have had time to bed-in. It may
be updated several times for major change
programmes.
Why:
Recording the outcomes and benefits you deliver is a
good way of communicating success within your
organisation. Where actual benefits vary from those
expected (more, less or different) the difference can
also be recorded here.
35
The Integrated Benefits Management Lifecycle
36
Benefits Dependency Diagram
37
38
Value
Alignment
Value
Planning
Value
Readiness
Value
Delivery
Value
Exploitation
Value
Evolution
Value
Governance
IT - Business
Alignment
Business
Case
Development
Resource
Readiness
IT
Conversion
IT
Use
Review
& Evolution
1
7
65432
39
Phase Phase Description Measurement Score Range
1 Alignment of IS investment with
Business Strategy
Alignment Quality (AQ) 1 – 5
2 Planning of IS investments Planning Quality (PQ) 1 – 5
3 Readiness of organization to engage Readiness Quality (RQ) 1 – 5
4 Delivery of IS investment
(implementation)
Delivery Quality (DQ) 1 – 5
5 Exploitation of IS investments - Post
Implementation Phase (Usage)
(D&M Measures)
System Quality – SQ
Information Quality –
IQ
Quality of Use – QU
User Satisfaction – US
1 – 5
1 – 5
1 – 5
1 – 5
6 Evolution of IS investments – Post
Implementation Phase (service)
Service Quality – SQ
Net Benefits - NB
1 – 5
1 – 5
7 Governance of IS Investments Quality of Governance
(GQ)
1 – 5
Total – Aggregate Score 1 – 5
“Plans are worthless. Planning is essential“
“ Dwight D. Eisenhower ”
“Time is the scarcest resource and unless it is managed nothing
else can be managed”
“Peter Drucker”
“Change before you have to”
“Jack Welch”
“Expect the best, plan for the worst, and prepare to be
surprised”
“Denis Waitley”
“Good management consists in showing average people how
to do the work of superior people”
“John Rockefeller”
“Estimating is what you do when you don't know”
“Sherman Kent”
PM Quotes
40

Trends and local challenges

  • 1.
  • 2.
    Top 10 LocalChallenges Training Resources Empower Leadership Motivation Structural Cultural Change M Prediction Customer Needs 2
  • 3.
    Local Challenges -Training Project Manager Training Team Training Knowledgeable & Engaged Project 3
  • 4.
    Local Challenges -Resources Adequate Competent Effective Resources 4
  • 5.
    Local Challenges –Lack of Empowerment Team Empowerment Authority Innovation Decision- Making Trust 5
  • 6.
    Local Challenges –Leadership Vacuum 6
  • 7.
    Local Challenges –Lack of Motivation 7
  • 8.
    Local Challenges –Stuck with Rigid Functional Organizational Structures 8
  • 9.
    Local Challenges –Country Barriers Political Economic Social Regional Sectarian 9
  • 10.
    Local Challenges –Change Management 10
  • 11.
    Local Challenges –Prediction is Difficult 11
  • 12.
    Local Challenges –Balancing Competing Customer Needs Internal External 12
  • 13.
    Top 10 GlobalTrends Agile Mobility Dedicated PMO Crowd- sourcing End of E-Mail EntreP Design Thinking CPO Analytics & Big Data Certification Not 13
  • 14.
  • 15.
  • 16.
    The end ofe-mail? 16
  • 17.
  • 18.
  • 19.
  • 20.
  • 21.
  • 22.
  • 23.
  • 24.
    My Top 10CSFs Training Alignment Readiness Governance Empower Ownership Structured Agile From PM to BM Benefits Realization From P to I 24
  • 25.
    My Top 10CSFs Effective Team PM Training Team Training Sponsor Training 25
  • 26.
  • 27.
    Organizational Readiness –The Missing Link 27
  • 28.
  • 29.
    Project / TeamEmpowerment 29
  • 30.
  • 31.
    Dual Emphasis onEffectiveness & Efficiency Success Measures PM BM 31
  • 32.
  • 33.
    Benefits should drivethe project 33
  • 34.
    Stage 1: IdentifyValue and Benefits 34 Benefit Profile Benefit No. Created ddmmyy Reviewed ddmmyy Project Ref. No. Insert your SHSW project reference number Benefit Title Short title summarising the expected benefit Benefit Description Fuller description of the benefit and its context Owner Who is responsible for this profile and for ensuring the expected benefit is achieved/realised fully Support Objective(s) List the organisational or departmental objective(s) this benefit contributes to. Enablers List the key technology, process, organisational or other changes required to achieve this benefit Benefit Type Economy (directly reduces cost) yes/no Efficiency (frees up time for other activities) yes/no Effectiveness (improves the delivery or quality of care outcomes) yes/no Unit of Measure In what units and/or what qualitative terms is the benefit measured Baseline Value Estimated or measured current value Target Value Estimated or target future value Method How will the measure be taken? Financial Value and Assumptions If applicable, state the overall financial value and supporting assumptions (i.e. the estimated value of each unit of measure) Start Date The date from which some or all of the expected benefit will be achieved mmyy Measuring Start Date mmyy Completion Date The date by which you expect the full level of benefit to be achieved mmyy Value for Money template Please insert Project Name and Trust here Financial Year 2014/15 2015/16 2016/17 2017/18 2018/19 2019/20 2020/21 2021/22 2022/23 2023/24 TOTAL Discount rate 1.00 0.97 0.93 0.90 0.87 0.84 0.81 0.79 0.76 0.73 Cost category(excluding VAT) 1. Initial Capital expenditure -£ -£ -£ -£ 2. Ongoing capital costs -£ 3. Transition costs -£ 4. Additional revenue costs associated with investment -£ TOTAL COSTS -£ -£ -£ -£ -£ -£ -£ -£ -£ -£ -£ Benefit category 5. cost savings -£ -£ 6. increased productivityof staff -£ 7. Other quantifiable benefits £0 -£ TOTAL BENEFITS -£ -£ -£ -£ -£ -£ -£ -£ -£ -£ -£ UNDISCOUNTEDTOTAL OFCOSTS ANDBENEFITS -£ -£ -£ -£ -£ -£ -£ -£ -£ -£ -£ DISCOUNTEDTOTAL OFCOSTS ANDBENEFITS -£ -£ -£ -£ -£ -£ -£ -£ -£ -£ -£ Undiscounted costs -£ -£ -£ -£ -£ -£ -£ -£ -£ -£ -£ Undiscounted benefits -£ -£ -£ -£ -£ -£ -£ -£ -£ -£ -£ Discounted costs -£ -£ -£ -£ -£ -£ -£ -£ -£ -£ -£ Discounted benefits -£ -£ -£ -£ -£ -£ -£ -£ -£ -£ -£ Discounted benefit to cost ratio #DIV/0! Cumulative (Last 4 Qs) Ref Benefit Δ £ p.a. Δ £ Δ £ Δ £ Δ £ £ p.a. A1 Reduced time spent entering assessments 15% £12,500 5% £1,042 15% £3,125 £4,167 B3 Increase in accuracy of early warning score calculation 10% n/a 6% n/a 11% n/a n/a C2 Reduced instances of hospital acquired infections 3% £10,000 0% 1.50% £1,250 £1,250 TOTALS £22,500 £1,042 £4,375 £0 £0 £5,417 NOTE: If the measurement or calculation approach applied differs from that stated in the Benefit Profile, please explain here 27/06/2014 30/09/2014 Target Q2 14 Q3 14 Q4 14 Q1 15 Stage 2: Define & Plan Stage 3: Track & Realise Stage 4: Evaluate What: A spreadsheet providing an early view of your expected benefits, both financial and non-financial. Includes estimated costs and shows the anticipated VfM return When: During the application process Why: It helps you build support amongst internal stakeholder and demonstrates that the project meets the required level of return for central investment Product: Value for Money (VfM) profile Product: Statement of Planned Benefits Product: Benefits Tracker What: A Word document providing greater detail of each benefit and when you expect to achieve them. Includes relevant dependencies, assumptions and describes how each benefit will be measured When: Within one month of receiving your award or this document (whichever is the latter). Updated periodically as more information about individual benefits becomes known. Why: Understanding key dependencies, governance arrangements, and how/when benefits will be measured improves your chances of achieving them. Product: Post-Project Review What: A spreadsheet used to record progress against each benefit. It shows when they start to accrue and the actual value delivered When: Updated once every three months after completing your Statement of Planned Benefits Why: Tracking benefits is an essential part of measuring progress towards your main objectives. As a whole, the investment needs to show that the benefits delivered justify the original investment. It will also provide a basis for future funding rounds The Integrated Benefits Management Lifecycle What: A Word document that compares the benefits defined in the ‘Statement of Planned Benefits’ with what was achieved on the ground When: Once the initial project has been completed and associated changes have had time to bed-in. It may be updated several times for major change programmes. Why: Recording the outcomes and benefits you deliver is a good way of communicating success within your organisation. Where actual benefits vary from those expected (more, less or different) the difference can also be recorded here.
  • 35.
    35 The Integrated BenefitsManagement Lifecycle
  • 36.
  • 37.
  • 38.
  • 39.
    39 Phase Phase DescriptionMeasurement Score Range 1 Alignment of IS investment with Business Strategy Alignment Quality (AQ) 1 – 5 2 Planning of IS investments Planning Quality (PQ) 1 – 5 3 Readiness of organization to engage Readiness Quality (RQ) 1 – 5 4 Delivery of IS investment (implementation) Delivery Quality (DQ) 1 – 5 5 Exploitation of IS investments - Post Implementation Phase (Usage) (D&M Measures) System Quality – SQ Information Quality – IQ Quality of Use – QU User Satisfaction – US 1 – 5 1 – 5 1 – 5 1 – 5 6 Evolution of IS investments – Post Implementation Phase (service) Service Quality – SQ Net Benefits - NB 1 – 5 1 – 5 7 Governance of IS Investments Quality of Governance (GQ) 1 – 5 Total – Aggregate Score 1 – 5
  • 40.
    “Plans are worthless.Planning is essential“ “ Dwight D. Eisenhower ” “Time is the scarcest resource and unless it is managed nothing else can be managed” “Peter Drucker” “Change before you have to” “Jack Welch” “Expect the best, plan for the worst, and prepare to be surprised” “Denis Waitley” “Good management consists in showing average people how to do the work of superior people” “John Rockefeller” “Estimating is what you do when you don't know” “Sherman Kent” PM Quotes 40