Travis Perkins PLC is a UK-based company that operates in builders' merchant and home improvement markets. It is a leading supplier of basic products to the building and construction industries in the UK. Analysts recommend buying Travis Perkins stock, with a target price of 2150 GBX, representing 19.98% upside. Key risks include housing market conditions, supplier dependency, and competitive pressures. The company has seen strong revenue growth and is undertaking strategic transformations and acquisitions to capitalize on growth in the housing and construction industries.
Technology has made the world a smaller place to live in. With the growing closeness between many nations, international shipping has become crucial. Visit CCF-ex.com for affordable international shipping solutions.
An introduction to supply chain management and role of transportataionBehzad Behdani
This presentation provides a brief introduction about “supply chain management” and especially, the role of transportation in the smooth operation of “modern” supply chains is discussed.
Summary of Logistics and Supply Chain Management by Martin Christopher, Analy...Tanade Sirinumas
An Individual Assignment Submitted in Partial Fulfillment of the Requirements of 1210334 Global Economic Trends in Thailand Exporting and Service Course,
Mae Fah Luang University,
Second Semester, 2014
A STUDY ON CUSTOMER’S SATISFACTION MARKS CARGO PRIVATE LIMITED - 2Yogesh Santhan
This study entitled “A STUDY ON CUSTOMER’S SATISFACTION AT MARKS CARGO PRIVATE LIMITED, PONDICHERRY” is based on the services provided such as experience and opinion of the customers. By using their feedback it enables to determine the effectiveness.
This project explains ways in which customers feedback to implement the changes in the process can be used in long run. The primary data was collected from 54 customers from various industry sectors. The collected data were analyzed and it’s found that majority of them were aware and satisfied with the current services and have participated also. They suggest that certain aspects of the services and its process could be redefined and they should be updated based on the feedback of the customers towards it.
The study not only projects the current status of organization service process but also serves as a stepping stone to remedial measure for MARKS CARGO PRIVATE LIMITED.
The Deloitte CFO Survey: 2013 Q4 resultsDeloitte UK
Find out more at http://www.deloitte.co.uk/cfosurvey
With low levels of uncertainty, improved access to finance and greater confidence in the Bank of England's policies, Chief Financial Officers (CFOs) are gearing up for expansion, investment and hiring in 2014.
The Deloitte CFO Survey, launched in 2007, is a quarterly survey of Chief Financial Officers and Group Finance Directors of major UK companies. Over 300 CFOs, mainly from FTSE 350 companies, have joined the CFO Survey panel. The Survey captures shifts in UK CFOs' opinions on valuations, risks and financing and has become a benchmark for gauging financial attitudes of major corporate users of capital.
The Deloitte CFO Survey has been widely quoted in the media and is firmly established with policymakers. The Bank of England has cited the CFO Survey several times in its publications such as the quarterly Inflation Report and the monthly Trends in Lending report. The findings have also been quoted in the minutes of the Bank's Monetary Policy Committee meetings.
Thomson Reuters This Week in Earnings report on the S&P 500's earnings.
You can subscribe to more earnings reports here: http://www.trpropresearch.com/subscribe/
Please note: if you use our earnings data, please source Thomson Reuters I/B/E/S.
Bank of America Merrill Lynch Annual Financials CEO Conference presentation 2018Aegon
Aegon CEO Alex Wynaendts gives a presentation to the Bank of America Merrill Lynch Annual Financials CEO Conference in London on Tuesday, September 25, 2018.
The Deloitte M&A Index is a forward-looking indicator that forecasts future global M&A deal volumes and identifies the factors influencing conditions for dealmaking.
The Deloitte M&A Index is a forward-looking indicator that forecasts future global M&A deal volumes and identifies the factors influencing conditions for dealmaking.
2HOUSTON WIRE AND CABLE COMPANYHouston Wire & Cabl.docxrhetttrevannion
2
HOUSTON WIRE AND CABLE COMPANY
Houston Wire & Cable Company: Financial Statement Analysis
University of Houston – Downtown
Houston Wire & Cable Company: Financial Statement Analysis
Company and Industry
Founded in 1975, Houston Wire & Cable Company (HWCC) is one of the largest providers of industrial products including electrical and mechanical wire and cable, industrial fasteners, hardware, and related services to the U.S. market. HWCC offers products in most categories of wire and cable including, power cable, electronic wire and cable, instrumentation and thermocouple cable, and high temperature cable.
HWCC has three target markets: utility market, industrial market, and infrastructure market. The utility market includes large investor-owned utilities, rural cooperatives, and municipal power authorities. While not a significant distributor of power lines used for the transmission of electricity today, HWCC has products that are used in this sector.
The industrial market is one of the largest segments of the U.S. economy and is comprised of a diverse base of manufacturing and production companies. HWCC provides a wide variety of products specifically designed for use in manufacturing, metal/mineral, and oil and gas upstream, midstream and downstream markets. Investments in the development, construction and maintenance of infrastructure markets including education and health care; air, ground and rail transportation; telecommunications, and wastewater are opportunities for product and service offerings.
In October 2016 HWCC acquired Vertex for $32.3M. This was a consolidation of companies with complimentary activities working together to increase efficiencies. This purchase affected the 2016 and 2017 financial performance of the company significantly. This impact is seen holistically in 2017 when there was a full year of Vertex financial performance combined with HWCC. As the following sections discuss, the acquisition drastically affected the financial statements between 2015 through 2017.
Common Size Analysis
Balance sheet.
Accounts receivable saw an increase of 28.5% primarily due to the Vertex acquisition, however this was also bolstered by an increase in sales. Similarly, inventory increased to $88.1M due to the increase in sales volume which was partially caused by the Vertex acquisition. Accounts receivable and inventory were the primary drivers in the increase of total assets. Debt increased significantly from 2015 to 2016 as HWCC borrowed to fund the acquisition. Debt continued to increase in 2017 as a function of borrowings due to increased operating activities. Additionally, borrowings were used to facilitate the rehabilitation of several buildings where the companies operate.
Income statement.
Sales increased significantly from $261.6M in 2016 to $317.7M in 2017 as this was the first full year that Vertex was incorporated into the company. There was also an increase to the sales due to sales volume increasing becau.
Com Hem - Interim Report Q2 2014 – Presentationcomhemgroup
Com Hem reports second quarter results – Revenue up 8 percent. Revenue totaled SEK 1,198m (1,108), an increase by 8.1% versus second quarter 2013. Underlying EBITDA was SEK 566m (547), an increase of 3.5% versus second quarter of 2013. Operating free cash flow was SEK 327m (344). Net result for the period was SEK -718m (-279) affected by one-off costs of SEK 680m associated with the IPO and refinancing of debt. Earnings per share were SEK -6.53 (-2.79). Pro forma earnings per share(1) were SEK -0.90 (-1.34)
Aegon Strategy: BoAML Banking & Insurance CEO Conference 2017
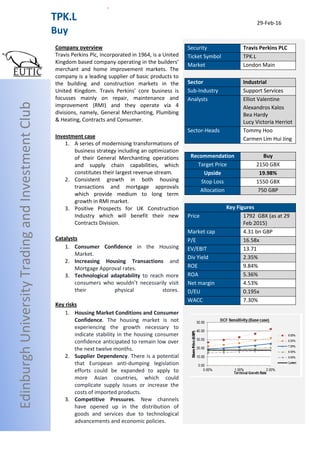
Travis Perkins PLC Research Report
1. 29-Feb-16
Security Travis Perkins PLC
Ticket Symbol TPK.L
Market London Main
Sector Industrial
Sub-Industry Support Services
Analysts Elliot Valentine
Alexandros Kalos
Bea Hardy
Lucy Victoria Herriot
Sector-Heads Tommy Hoo
Carmen Lim Hui Jing
Recommendation Buy
Target Price 2150 GBX
Upside 19.98%
Stop Loss 1550 GBX
Allocation 750 GBP
Key Figures
Price 1792 GBX (as at 29
Feb 2015)
Market cap 4.31 bn GBP
P/E 16.58x
EV/EBIT 13.71
Div Yield 2.35%
ROE 9.84%
ROA 5.36%
Net margin 4.53%
D/EU 0.195x
WACC 7.30%
Company overview
Travis Perkins Plc, incorporated in 1964, is a United
Kingdom based company operating in the builders’
merchant and home improvement markets. The
company is a leading supplier of basic products to
the building and construction markets in the
United Kingdom. Travis Perkins’ core business is
focusses mainly on repair, maintenance and
improvement (RMI) and they operate via 4
divisions, namely, General Merchanting, Plumbing
& Heating, Contracts and Consumer.
Investment case
1. A series of modernising transformations of
business strategy including an optimization
of their General Merchanting operations
and supply chain capabilities, which
constitutes their largest revenue stream.
2. Consistent growth in both housing
transactions and mortgage approvals
which provide medium to long term
growth in RMI market.
3. Positive Prospects for UK Construction
Industry which will benefit their new
Contracts Division.
Catalysts
1. Consumer Confidence in the Housing
Market.
2. Increasing Housing Transactions and
Mortgage Approval rates.
3. Technological adaptability to reach more
consumers who wouldn’t necessarily visit
their physical stores.
Key risks
1. Housing Market Conditions and Consumer
Confidence. The housing market is not
experiencing the growth necessary to
indicate stability in the housing consumer
confidence anticipated to remain low over
the next twelve months.
2. Supplier Dependency. There is a potential
that European anti-dumping legislation
efforts could be expanded to apply to
more Asian countries, which could
complicate supply issues or increase the
costs of imported products.
3. Competitive Pressures. New channels
have opened up in the distribution of
goods and services due to technological
advancements and economic policies.
TPK.L
BuyEdinburghUniversityTradingandInvestmentClub
-
2. 29-Feb-16
Valuation: Executive Summary
Forecasts:
COGS/Revenue is anticipated to increase as the 400 new stores being built over the next
few years (until 2018) will cause an increase in goods to sell. Considering the Group’s ability
to maintain cost efficiency despite massive COGS increases, it is likely that COGS/Revenue
will not skyrocket. Moreover, COGS/Revenue will decrease in the future as the stores are
opened and begin to generate revenue.
SG&A/Revenue is going to follow a similar trend as COGS/Revenue. There is a nearly 25%
increase in the number of stores that are going to be opened by 2018 and therefore costs
will rise overall due to the increase in stores that need to be staffed, equipped and
maintained. However, these costs will be manageable due to the Company’s ability to
efficiently maintain their costs, and as these stores open, they will generate revenue and
help decrease this ratio.
Interest/Debt will decrease as the Company pays off their debts, but should then increase as
Travis Perkins is likely to take on more debt in the next few years. This is because a £550m
loan that was issued in 2011 is coming due at the end of 2016, meaning that the company
could be looking to issue more short term and long term debt to further fund operations.
With a 20% tax rate that became effective April 2015, Travis Perkins is likely to see a
decrease in its effective tax rate. While its taxable income is likely to rise, it has a fair amount
of debt outstanding to shield itself from taxes, and is likely to add more debt in the future.
Moreover, Travis Perkins is conservative in setting aside its tax provisions, and thus this will
help reduce its future effective tax rates.
Short Term Debt Growth: Only until year 2016, the 200m of their 550m debt will come due,
and for that we wouldn’t expect the company to take in any short term debt so actually the
debt would go down in 2015 and 2016. But after that, debt would increase as it is highly
likely that they would need a new loan. So in year 2017 or 2018 there would be a large
increase in debt.
2011 2012 2013 2014 2015 Average 2016 2017 2018 2019 2020
Revenue Growth n/a 51.58% 1.38% 6.27% 8.39% 16.91% 8.49% 8.51% 8.64% 8.78% 8.81%
COGS / Revenue (%) 66.02% 70.22% 69.79% 70.24% 70.42% 69.34% 72.50% 74.00% 74.00% 72.00% 70.00%
SGA / Revenue (%) 21.43% 24.12% 24.42% 23.74% 23.94% 23.53% 24.00% 25.00% 25.00% 23.00% 23.00%
D&A / Non-Current Assets (%) 2.08% 2.31% 2.45% 2.50% 2.57% 2.38% 2.25% 2.25% 2.50% 2.50% 2.50%
R&D / Revenue (%) 0.00% 0.00% 0.00% 0.00% 0.00% 0.00% 0.00% 0.00% 0.00% 0.00% 0.00%
OOE / Revenue (%) -1.82% -1.33% -1.43% -1.38% -1.35% -1.46% -1.33% -1.23% -1.36% -1.46% -1.50%
0.00%
Interest / Debt (%) 2.83% 3.72% 4.58% 5.08% 4.26% 4.09% 4.09% 3.80% 3.60% 4.60% 4.30%
Tax Rate (%) 25.78% 21.51% 18.47% 14.92% 17.31% 19.60% 19.00% 20.00% 20.00% 17.00% 16.00%
Cash & Cash Equiv / Revenue 2.00% 1.71% 3.13% 1.55% 1.99% 2.08% 2.15% 2.15% 2.25% 3.00% 2.35%
Required Cash / Revenue 2.00% 1.71% 3.13% 1.55% 1.99% 2.08% 2.15% 2.15% 2.25% 3.00% 2.35%
Current Assets / Revenue 39.99% 28.02% 28.29% 29.34% 30.01% 31.13% 31.13% 30.50% 29.50% 28.50% 30.00%
Non Current Assets / Revenue 87.95% 57.97% 58.47% 55.42% 52.63% 62.49% 55.00% 55.00% 57.00% 58.00% 60.00%
Short Term Debt Growth (%) n/a -15.87% 522.80% -98.54% 650.00% 264.60% -30.00% -30.00% 50.00% 25.00% 25.00%
Current Liabilities / Revenue 37.23% 26.95% 33.81% 26.16% 25.66% 29.96% 30.00% 30.00% 30.00% 30.00% 30.00%
Long Term Debt Growth (%) n/a -21.38% -67.37% 115.98% 4.36% 7.90% 6.00% 6.00% 5.00% 4.00% 4.50%
Capex / Non-current Assets 1.90% 3.94% 2.91% 3.76% 5.61% 3.62% 5.50% 4.50% 3.70% 2.80% 2.50%
Cash Flow Statement
Drivers
Income Statement
Balance Sheet
3. 29-Feb-16
WACC:
In order to calculate the Weighted Average Cost of Capital for Travis Perkins, we used “Comparable
Business Mix” to calculate beta, then referred to the Yield on the latest corporate bond issue to give
calculate the cost of debt.
Beta was calculated in respect to the three industries that Travis Perkins serves: Retail Building,
Supply, Home Building, and Building Materials. Next, we used the issuance of a 7 year, investment
grade bond that was issued with a 4.375% yield to calculate the cost of debt. Through these, we
calculated that WACC was 7.3%, which is a very healthy cost of capital because this means that the
cost of capital is low and therefore the present value of future cash flows is more valuable.
DCF Assumptions:
We estimate that revenue growth will lie in a conservative 8.49% to 8.78% range. Our estimate was
drawn from current and predicted growth in the market that Travis Perkins serves, and from the
company’s expected growth over the next few years due to expansions and acquisitions that are
presently occurring. We estimate that operating margins may marginally decline as new outlets and
programmes are unveiled and opened, but these margins will increase drastically once the new
outlets are functioning and begin to capture more of the market share across the United Kingdom.
DCF Sensitivity:
The DCF output shows that the shares are undervalued and have a potential to increase by nearly
26%. Therefore, we are confident that Travis Perkins offers an excellent investment opportunity that
will generate tremendous returns over the long term due to its future growth of its business and the
industry overall.
4. 29-Feb-16
Company Profile
Quick Summary
Travis Perkins Plc, incorporated in 1964, is a United Kingdom based company operating in the
builders’ merchant and home improvement markets. The company is a leading supplier of basic
products to the building and construction markets in the United Kingdom.
Product Base
The company operates via 4 divisions:
Travis Perkins operates 21 businesses with over 2000 sites across the UK and 19 product brands
including Benchmarx, Wickes, Plumb Nation, Toolstation, Tile Giant, Keyline and F&P Wholesale.
Customer Base
Travis Perkins’ serves a range of customers via both online and offline outlets in a diverse set of
industries, whose key requirements are product range and availability, competitive pricing and
customer service. The customers of General Merchanting businesses under Travis Perkins are
primarily professional tradesmen, ranging from sole traders to national house builders.
In 2014 the company served over 280000 account customers and millions of cash customers.
General Merchanting Plumbing & Heating Contracts Consumer
Supplies products for:
various RMI
(repair,
maintenance +
improvement)
projects
traders for new
builds and
construction
kitchen and
joinery products
to specialist
joiners, local
authorities and
house builders.
Supplies plumbing,
heating and related
products for:
plumbers
independent
merchants
large contractors
house builders
public services
Also supplies:
power tools
hand tools
site equipment
Supplies specialist
contractors and the
construction industry
with:
heavy building
materials
drainage
solutions
interior building
products inc.
drywall +
insulation
fire protection
products
Supplies domestic
building and
decorative materials
through retail stores.
5. 29-Feb-16
Revenue Streams
In 2014 Travis Perkins exhibited strong profit growth and good
strategic progress. Revenue grew 8.4% on the previous year to
£5.6 billion.
Strongest revenue growth was seen in the General Merchanting
and Contracts divisions which both significantly outperformed
the market with increases of 13.7% and 12.1% respectively.
Acquisitions and Business Growth
Travis Perkins’ undertook acquisitions in 2012, 2013 and 2014 of Toolstation, Solfex and Primaflow
respectively. Primaflow was acquired for £16m and is expected to bring in £50m in revenue in its
Plumbing and Heating business and further solidify the firm’s presence in the Plumbing construction
and improvement business.
Additionally, the company have been undergoing a series of modernising transformations of
business strategy including an optimization of their General Merchanting operations and supply
chain capabilities, which constitutes their largest revenue stream - this modernization effort will
continue to drive revenues. This will also be enhanced by plans for optimisation of their online
merchandising system and online brand development.
54 new company sites opened in 2015 with a further 47 implants added to the network
A trend towards smaller family units in the UK results in around 230,000 new households being
formed each year. The combination of under-investment in existing dwellings and new household
formation provides a reasonable expectation, even from this early point in the recovery of the UK
construction industry, of sustainable medium to long term growth in both the new build housing and
the repair, maintenance and improvement (“RMI”) markets.
Business model
Travis Perkins operates an advantageous business model in terms of scale, competitive pricing and
convenience:
• The size of the Group allows it to benefit from economies of scale in common and direct product
sourcing and selective centralised distribution
• The Group operates from 2,000 locations enabling it to conveniently offer products for collection
or delivery to customers anywhere in the UK and increasingly integrate its developing online
operations into its branch and store network. Efficiencies passed onto customers by ensuring each of
its businesses offers competitive prices in their respective markets.
In terms of revenue streams 34% comes from General
Merchanting, 24% Plumbing + Heating, 23% Consumer and 19%
Contracts. Source: Derived from Annual Report 2014
6. 29-Feb-16
Industry Analysis
Travis Perkins has built itself into the UK's largest builder merchant and it relies on Repair,
Maintenance and Improvement market (RMI) for 80 per cent of its sales. Secondary housing
transactions and consumer confidence remain the key indicators that most closely correlate to this
industry’s future performance. This industry is shaped by trends involving housing prices and
transactions, mortgage approvals, consumer confidence, climate for purchases, new construction
orders, trade confidence, amongst others.
Housing Transaction:
In late 2013 and early 2014, government actions and returning confidence led to a rapid increase in
housing transactions. Following this initial increase, secondary housing transactions have been
broadly consistent at around 100,000 transactions per month. Consistent growth in both housing
transactions and mortgage approvals in the UK since 2013 has boosted almost every point in the
property cycle and hence stimulated growth in the Builders Merchants and Home Improvement
markets.
However, the RMI market has yet to feel the full effects of the housing renaissance. Although
currently at an 11-year high, consumer confidence in the housing market is, in comparison to other
markets, relatively low. Consumers are thus demonstrating investment in their current housing
assets with small DIY operations and display aversion to investment in large projects on their current
housing assets or investing in new ones. However, it is still relatively early in the recovery of UK
construction industry and there has been a sustained improvement in the key lead indicators.
Moreover, there is usually a lag of around nine months between a change in those key indicators
and a corresponding uplift in demand volumes. Therefore a sustained improvement in the housing
market is required in order to see a significant improvement in the performance of the House
Building market operated in by Travis Perkins.
In addition to the positive outlook on both housing transactions and mortgage approval rates, the
market trend has indicated that the UK has been significantly under-investing in its housing stock.
Indeed, according to a recent survey by the Office of National Statistics, there are approximately 28
million homes in the UK and only 60% of these are maintained to a satisfactory standard. Moreover,
it is estimated that 230,000 new households are formed every year due to a trend towards smaller
family units. These two factors lead to expectations of a sustainable long-term growth in the RMI
market.
Also, with consistent growth in housing transactions and mortgage approvals rate together with the
lag in key indicators and the underinvestment in housing market, there is a positive prospect for the
UK Construction Industry. Travis Perkin’s Contract division which was formed in 2014 will benefit
from such prospects as the Contract Division, which takes about 20% of Group’s Revenue, is in
charge of supplying products to large construction companies and project contractors. With such
diversification, Travis Perkins will have the capability to cover a Spectrum of the building materials
distribution markets from retail customers in the Consumer division to major construction
companies purchasing large scale building products from the Contracts division.
7. 29-Feb-16
Porter’s five forces
Supplier Power
The market is price sensitive as it is driven by competition, energy & fuel costs, volatile prices of raw
materials and product availability. The economic recovery and consistent growth in housing
transactions since 2013 has led to supply chain issues and shortages for some products such as
bricks & blocks, timber and roof tiles. This suggests that Travis Perkins’ supplier power is relatively
high as demand can be intermittent and raw material prices are volatile.
Moreover, the majority of the markets Travis Perkins competes in are highly fragmented and Travis
Perkins has relatively low market shares. This could suggest that supplier power is high as suppliers
can try to lower their prices by going to many other groups in the industry ready to buy their raw
materials. However, many of Travis Perkins’ businesses hold market leading positions and those that
do not are generally the number two in their respective market. This means that Travis Perkins
probably has good supplier relations and contracts and can remain competitive against other firms
by obtaining the best prices from suppliers.
Buyer Power
Travis Perkins is the largest builder merchant in the UK; this by nature suggests customer loyalty.
Moreover, the fact that Travis Perkins is a UK company exclusively based in the UK means that it is
more likely to target its consumer accurately and build a brand tailored to its market. Moreover, the
fact that Travis Perkins competes in highly fragmented markets and that the group’s businesses are
distributed in various sectors such as General Merchanting, Plumbing and Heating, Contracts and
Consumer means that no single customer accounts for a large percentage of the group’s revenue.
Travis Perkins’ large customer base indicates that buyer bargaining power is relatively low.
Competitive Rivalry
Travis Perkins faces competition from a number of firms who operate within the same market
including Kingfisher, a firm with a 7.49bn market cap and own the B&Q and Screwfix DIY chain’s, and
Wolseley, with a 8.66bn market cap, who own various brands such as Plumb Centre and Parts
Centre. Indeed, given that Travis Perkins’ market cap is around 4.31bn, these are much larger firms
and could represent a threat to Travis Perkins, working in tandem with these firms plans for
improving its business practices is essential in order to remain competitive. However, these
companies are international while Travis Perkins is only in the UK, which gives Travis Perkins the
upper hand in the UK RMI market.
Threat of Substitution
Travis Perkins’ strategy is to further invest online channels, new formats and better service. Online
penetration of building material supply to the trade remains relatively low at around 3% and 7% for
the DIY sector. However, industry forecasts predict that online penetration is expected to grow and
mainly for lighter or higher value items where the cost and ease of distribution is not restrictive.
Despite the expectation of relatively modest growth in penetration of online sales, the Group is
constantly monitoring and will respond to changes in technology, buying behavior and supply
arrangements. This strategy is ultimately aimed at leading online gateway in the future, which
means that Travis Perkins is evolving to meet market demand, and hence lowering its threat of
substitution.
8. 29-Feb-16
Threat of New Entrants
A new entrant in the Builders Merchant and Home Improvement industry would require an
incredibly large amount of capital in order to buy expensive machinery, employ high-skilled workers,
develop high-tech technology and offer retail facilities. Moreover, this industry is heavily reliant on
raw materials and competing with large companies to obtain low raw material prices from suppliers
would be an incredibly difficult task. Hence, it is reasonable to assume that the industry that Travis
Perkins competes in has high barriers to entry in nature and so the Group should focus on current
competitors rather than new entrants.
9. 29-Feb-16
Competitors Analysis
Similarities
Travis Perkins, Kingfisher and Wolseley are clearly comparable companies given their engagement in
more or less the same product markets. They all also operate to some degree within the UK market
place, therefor placing them in direct competition. Indeed, Kingfisher and Wolseley have much
larger market cap’s then Travis Perkins at around 7.49bn and 8.66bn respectively in comparison to
Travis Perkins’ 4.31bn, but only part of these market cap’s can be attributed directly to the UK
market in which they compete with Travis Perkins as can be seen in figures 1 and 3. A further
notable feature is that all three companies organise themselves into various trading brands in order
to target specific market segments.
Kingfisher VS Travis Perkins
Unlike Travis Perkins, Kingfisher operates in multiple markets around the world as can be seen in
figure 1, showing its revenue decomposed into regions. This spread of revenue streams poses a
threat to Travis Perkins as it means that Kingfisher better positioned to withstand changes in the UK
market. In addition, Kingfisher has a market cap of around 7.49bn, almost double the 4.31bn market
cap of Travis Perkins, therefore posing a potential threat from Kingfisher using its scale to attack the
market share of its competitors such as Travis Perkins. According to Kingfisher, it’s total market
share is 5% across all of the markets it operates in.
Furthermore, Kingfisher has announced that it’s reorganisation, which comes after a review of its
business practices, has the potential to create £500m of sustainable profit uplift, therefore
expressing a strong desire to grow and become a more effective business. However, it is also
Travis Perkins PLC competitors: Overviews
Kingfisher PLC
Kingfisher sells home improvement products
and services throughout Europe and China. It
organises its brands into three geographical
segments: UK & Ireland, France and Other
International (comprised of: ). It’s primary
brands include: B&Q, Castorama, BricoDepot
and ScrewFix. Recently Kingfisher has carried
out a review of its business practices, leading it
to launch ‘ONE Kingfisher’, a strategy that
works towards unifying the company in order
to most efficiently satisfying customer needs,
and this is explicitly noticeable in the
company’s guiding principles. From this review
the company also deduced that they should
primarily focus on Europe, citing the facts that
show ‘plenty of scope for growth’.
Wolseley PLC
Wolseley is trade distributor of plumbing &
heating and building products throughout
North America, UK and Continental Europe. It
places a significant focus on providing a multi-
modal sales platform, priding itself on its
‘excellent service’. It organises itself into
trading brands such as: Ferguson, Plumb Centre
and Stark in order to target specific market
segments/consumer groups. They specifically
state that their business is managed on a
regional basis in order to suit the ‘individual
require of customers in local markets’,
therefore explicitly contrasting with Kingfisher’s
strategy.
10. 29-Feb-16
estimated that this reorganisation is likely to cost the company around £800m initially, therefore
representing a significant investment and
consequently a significant risk.
As part of this reorganisation and expansion
process, Kingfisher has announced that it
intends to open a further 200 Screwfix stores at
a rate of around 60 per year in order to cater for
the trade market, therefore posing a significant
threat to Travis Perkins whose own brands
operate in the same market. Additionally,
Kingfisher are also trialling the Screwfix brand in
Germany with a four store pilot. This
information suggests a strategy of rapid
expansion for Kingfisher. In the consumer
segment, recent news has suggested that
Kingfisher’s brand B&Q is focusing on customer loyalty schemes in order the improve its customer
retention, again, posing a threat for Travis Perkins.
As can be seen in figure 2, the three-year stock price trend chart in figure two, we can see that
Kingfisher has not performed as well as Travis Perkins since mid-2014.
Wolseley VS Travis Perkins
As can be seen in the revenue decomposition by revenue chart in figure 3, the UK market, where it
competes with Travis Perkins, represents a relatively small share of its business overall, again,
similarly to Kingfisher, giving Wolseley the benefit of spreading risk. However, given that the building
materials industry as a whole is fragmented, 14%
does represent a significant interest for this type of
market. In addition, the company also cites
benefits of scale as one of its most attractive
qualities, as it allows them to benefit from
operating synergies that enhance its business
practices.
Noticeably, Wolseley also places a notable amount
of emphasis on its ‘strong execution culture’,
frequently referencing its strong relationships with
13%
13%
2%
58%
14%
Wolseley revenue by region 2015
Nordic Region Canada
Central Europe USA
UK
20%
42%
38%
Kingfisher revenue by region 2015
Other international UK & Ireland France
Figure 1
Figure 2: three-year stock price chart featuring Travis Perkins and Kingfisher
Figure 3
11. 29-Feb-16
vendors and customers, therefore showing that the company is aiming to retain and increase
customer loyalty, therefore potentially detracting from Travis Perkins’ customer base in the long-
run.
Both Wolseley and Travis Perkins have stated that they have identified their fragmented market
place as a means for developing their businesses, therefore representing a further example of where
the firms will be competing in the future.
Similarly to the Travis Perkins/Kingfisher three-year stock price chart, we can see that Travis Perkins
has outperformed Wolseley, although in this case they have outperformed them for the entire three
years, suggesting a more effective business practice.
Figure 4: three-year stock price chart featuring Travis Perkins and Wolseley
12. 29-Feb-16
Revenue Model
Revenue Model
Travis Perkins divides its revenue streams into four categories: General Merchanting, Consumer,
Plumbing & Heating and Contract. For the purpose of this model we have merged the General
Merchanting, Consumer and Plumbing & Heating categories to form revenue stream one as these
categories are most similar to one another given that they are all serving individuals or small firms,
as demonstrated in Travis Perkins’ annual report. This leaves their Contracts category to form
revenue stream two.
For some guidance about forecasting the firm’s revenue we looked at a number of factors.
1. Historical growth data
First of all, we found that the previous growth rate for revenue stream 1 was 7.5% while revenue
stream 2 was 12.1%. These figures then provided an anchor for our forecasts.
We then went on to look at a number of drivers that we and Travis Perkins (as can be found in their
annual report) expect to have an impact on their revenue going forward. These drivers are as
follows:
1. UK Housing transactions
Figure 4
Source: HM Revenue & Customs Annual Property Transaction Statistics
13. 29-Feb-16
It is widely assumed that the building materials market is driven by housing transactions as it is after
these transactions that many people wish to make renovations to their homes, therefore using the
products and services provided by firms such as Travis Perkins. As can be seen in figure 4 above,
housing transactions have been on an upswing since around 2010, therefore creating a positive
environment for Travis Perkins to operate in looking forward.
2. Mortgage Approval Rate
The rate of mortgage approval is important for similar reasons to the rate of housing transactions. As
many consumers require a mortgage to secure a dwelling, this rate is likely to significantly impact
the rate of housing transactions, therefore consequently potentially impacting Travis Perkins’
revenue. The UK mortgage approval rate has a general upward swing over the past five years,
however, a peak in 2014 was followed by a trough towards the end of 2014, and from there the rate
has been relatively volatile. However, despite this volatility, it is again on an upward swing and Travis
Perkins is likely to benefit from this.
3. Mortgage rate
Recent news articles have suggested that mortgage rates could fall below 1% in 2016, therefore
representing a record low, beating the rate of 1.05% seen in August 2015 and being a stark contrast
to the rate of 6.75% seen in June 2008. This low rate makes it a very attractive time to borrow,
therefore likely aiding the recovery and growth of the housing market, again, relating to the rate of
housing transactions and potentially representing a positive climate for Travis Perkins’ revenues.
4. Consumer
14. 29-Feb-16
Figure 5: showing consumer confidence over 5 years
Consumer confidence is currently around the highest it has every reached in the past 25 years.
Looking more closely, as can be seen in figure 5, we can see that there has been a significant general
upward swing in consumer confidence since around the start of 2013. This is positive for Travis
Perkins as it means that consumers are more willing to make purchases. However, this upward swing
does appear to be levelling off around the start of 2016 suggesting that consumers may be becoming
relatively more cautious again and we must take this into consideration when forecasting Travis
Perkins’ future revenue.
5. UK Economic Recovery
Figure 6: showing a summary of UK economic prospects
Figure 7: showing projections for consumer spending
A further element that we took into consideration when making our forecast for Travis Perkins’s
revenue growth is the general economic outlook. As can be seen in figure 6, GDP was forecast to
grow at a rate of between 2.4% and 2.5% in 2015 and between 2.3% and 2.4% in 2016 by three
different entities, therefore giving us some impression of what to expect in the coming years.
Figure 7 shows that disposable income was forecasted to grow at a rate of 3.5% in 2015, gradually
tailing off to around 1.8% over the next five years. Disposable income is an important driver for
Travis Perkins’ revenue forecasts because it dictates how much money consumers will have to spend
on the products and services provided by Travis Perkins. This downward trend in overall household
disposable income can also be seen in real household expenditure forecasts which suggested a fall
from 2.9% in 2015 to 2.3% over the following five years. It is important to note that this reduction is
15. 29-Feb-16
less pronounced than that seen in disposable income, therefore suggesting that despite an overall
fall in disposable income, consumers may be less concerned about saving their money and
consequently potentially buoying Travis Perkins’ revenues over the next few years.
6. Small market share
Travis Perkins has a small market share at around 8.6% Therefore meaning that there is plenty of
scope for growth within the market by improving their competitive advantage, as they can be seen
to be doing with their various future development projects including developing online platforms
and unifying their fragmented market place through acquisitions.
7. Adapting to changes in tech
Travis Perkins has noted that it it committed to adapting to changes in technology. It is doing this by
implementing new online platforms and developing those that already exist within their business.
This will enable them to reach more consumers who wouldn’t necessarily visit their physical stores.
In addition, this may also allow the group to develop its business outside of the UK as many of its
competitors have done, again, representing a significant opportunity for growth in the business.
There are, however, drawbacks to this change. Firstly, it can be costly to implement an effective
system that will enhance the businesses operations rather than hinder their growth and potentially
negatively affect their image. In addition, they have also noted that online penetration is ‘modest at
3% and 7% for the DIY sector’. However, it is forecast that this will increase and so despite these
drawbacks, adapting to changes in technology will still help to grow the group’s revenues.
Final Valuation
Having reviewed these factors, we have projected that both streams will gradually have a growth
rate for 2020 that is 0.2% greater than the growth rate in 2016.
16. 29-Feb-16
Financial Ratio Analysis
Cost of Goods Sold/Revenue
Relative to its peers, Travis Perkins has a
moderate COGS/Revenue ratio. While it is
not the lowest ratio in the chart, Travis
Perkins has managed to keep a consistent
COGS/Revenue ratio despite a rise in COGS
from nearly doubling from 2bn to 3.9bn in
four years. This means that Travis Perkins has
managed to keep cost efficiency and increase
its revenues consistently over the past four
years. The spike in 2011 was due to COGS
rising from 2bn to 3.3bn in one year, and despite this Travis Perkins was able to keep this ratio level.
This is a good indicator that Travis Perkins can maintain cost efficiency and growing revenue streams
at a consistent level.
Net Interest Expense/Debt
Travis Perkins has the highest Net Interest
Expense to Debt ratio of all of its competitors. The
huge spike in 2012 can be attributed to a £155m
reduction in debt relative to its interest expense
payments, thereby causing a spike in interest
expense relative to debt as debt dropped from
£607m to £452m by the end of 2012. The drop
that followed by a further reduction of debt in
2013, and leveled off due to an issuance of £250m
in debt in 2014. This indicator means that relative
to its debt, Travis Perkins is paying more out in interest to its bondholders than its competitors,
which is attractive to new bondholders but may mean that the company needs a higher yield due to
a higher perceived risk.
Operating Margin
Travis Perkin’s operating margin has
decreased from 7% to about 6% over the past
years, which can be attributed to increased
expenses associated with expansion.
Presently, their operating margins are higher
than KingFisher, which is impressive
considering that KingFisher has a significantly
larger operation. It is notable that in 2014
Travis Perkins began a modernization
programme in order to upgrade its business
and capabilities; had it not done this
program, operating margins would have been 10% higher than they presently are, indicating
tremendous profits and growth on top of already higher profit margins. The modernization
programme will ensure that costs are minimized in the future, and thus can predict that the
operating margins will increase over the next few years, while KingFisher’s continues to decrease.
-2
0
2
4
6
8
2010 2011 2012 2013 2014 2015
Operating Margin
TPK.L WOS.L KFG.L
0.55
0.6
0.65
0.7
0.75
2010 2011 2012 2013 2014 2015
COGS/Revenue
TPK.L WOS.L KFG.L
0.00%
2.00%
4.00%
6.00%
2010 2011 2012 2013 2014 2015
Net Interest Expense/Debt
TPK.L WOS.L KFG.L
17. 29-Feb-16
Capital Expenditure/Revenue
Relative to its peers, Travis Perkins has a
higher Capital Expenditure to Revenue
ratio. Capital Expenditure to Revenue
measures how a company reinvests in
revenue-producing assets relative to its
total sales. KingFisher’s ratio has
decreased since 2012, meaning it is
slowing down its investments into its
business. On the other hand, Travis
Perkins is increasing its investments into
itself, which can be seen through its
modernization programme and the opening of 400 new stores over the next four years, which will
require more investment in property, plants and equipment. This is a good indicator of growth for
the company, as it is confidently investing in itself to drive growth.
Current Ratio
With a Current Ratio of 1.19, Travis Perkins is in a
very healthy position, and is comparable to its peers.
This ratio means that Travis Perkins would be able to
pay down its liabilities with assets on hand without
requiring support. While this is a good sign that
Travis Perkins is credit worthy and financially
healthy, this current ratio also means that Travis
Perkins could be taking on more liabilities in order to
expand its businesses further to drive growth and
create returns for shareholders. At the same time, it
is notable that Travis Perkins is acquiring new
companies and building new stores to expanding operations, and thus is driving growth for its
shareholders.
Return on Invested Capital
Travis Perkins is generating a 9.38% return on
invested capital, which is on par with its
competitors. This ratio is not particularly great,
considering that in2015 its Weighted Average
Cost of Capital was 13.38%. A WACC that is
greater than ROIC means that the firm is not
creating value for every dollar spent on capital.
While this is low right now, it is attributable to
large investments that have not started
generating revenues for the firm yet- these
include the 2014 modernization programme,
and the acquisitions of PrimaFlow and Rudridge. While right now this is producing a low ROIC, these
programs will generate positive returns for the future, and thus will boost ROIC for the next few
years.
0.00%
2.00%
4.00%
6.00%
2010 2011 2012 2013 2014 2015
Capital Expenditure/Revenue
TPK.L WOS.L KFG.L
0
0.5
1
1.5
2
2010 2011 2012 2013 2014 2015
Current Ratio
TPK.L WOS.L KFG.L
-10
0
10
20
2010 2011 2012 2013 2014 2015
ROIC
TPK.L WOS.L KFG.L
18. 29-Feb-16
EV/EBITDA
Travis Perkins’ EV/EBITDA has risen in the past five years, but remains at a healthy level overall.
The average EV/EBITDA for the industry was 11.42, meaning that at 10.78, Travis Perkins’ EV/EBITDA
value is relatively healthy. The EV/EBITDA rose drastically in 2013 because while EBITDA has been
growing at a steady pace, Enterprise Value rose from 2.7bn to 4.9bn between 2012 and 2013,
therefore causing the huge spike. This meant that from 2012 to 2013, the overall price of the firm
rose 1.2bn. This was due to stock price rising 798 January 2012 to 1832 at the end of 2013,
increasing the overall value of the firm. These stock prices were also a result of exceptional
performance during that year.
Debt/Equity
Travis Perkins maintains a Debt to Equity
Ratio of 0.195 meaning that it is not highly
leveraged. This means that, with £400m in
long term debt, Travis Perkins is not at a
high risk of being unable to make
payments on its debt. This also means that
they are not susceptible to changes in
interest rates and credit conditions. In
2014, Travis Perkins issued £250m worth
of investment grade bonds that matures in
2021. While this will increase its debt to equity ratio for the future, overall the company is still at a
very low debt to equity ratio. This means that Travis Perkins has the capability to take on more debt
in order to expand operations, which is something that the company should consider in order to
expand operations and generate positive returns for shareholders and bondholders.
0
50
100
150
200
250
300
2010 2011 2012 2013 2014 2015
EV/EBITDA
TPK.L WOS.L KFG.L
0
5
10
15
2011 2012 2013 2014 2015
EV/EBITDA
TPK.L WOS.L KFG.L
0
0.5
1
2010 2011 2012 2013 2014 2015
Debt/Equity
TPK.L WOS.L KFG.L
19. Research Report Basic Materials
29-Feb-16
19
Key risks
Housing Market Conditions and Consumer Confidence
The entirety of Travis Perkin’s business relies on the housing market and consumer confidence, as
the business relies on consumers being able to either build or renovate their homes. The UK Home
building has reached a 7 year high, with 166,900 housing starts in 2015, which is a statistic that does
indicate strong growth in the economy overall. However, this number still falls short of the 222,630
housing starts in 2007. Additionally, consumer confidence fell in February, and household
expectations about the economy over the next 12 months have dropped to the lowest levels since
2013. This means that despite an increase in housing starts, the housing market is not experiencing
the growth necessary to indicate stability in the housing markets, and with consumer confidence
anticipated to remain low over the next twelve months, there may be a risk of slowed business for
the Group.
Supplier Dependency
Travis Perkins has a large range of suppliers to support its business. In most cases, it is the largest
customer to most of its suppliers, and these suppliers have large enough orders with the company
that they can cause significant supply disruptions should economic factors or operational factors
affect these suppliers. Moreover, while Travis Perkins has attempted to remedy this problem with
establishing supplier relationships with overseas factories to expand its sourcing capabilities, there is
a potential that European anti-dumping legislation efforts could be expanded to apply to more Asian
countries, which could complicate supply issues or increase the costs of imported products.
Online Substitution and Technological Limitations:
Travis Perkins has nearly 2000 outlets and millions of products in inventory distributed throughout
the United Kingdom. As a result, it relies on an increasingly complex and wide range of Information
Technology systems in order to maintain its inventory and to conduct trade in a profitable manner.
As the Group expands, it must constantly maintain and update both the hardware and software for
these IT services, including hiring technology consultants and staff to maintain and address any
limitations in these systems. Any delays or failures to maintain or modernize these systems in the
future will negatively impact its ability to trade, which will affect profits and cause consumers to look
elsewhere to purchase goods. Travis Perkins is investing in online channels in order to meet the new
and changing needs of consumers that use the internet to shop for their building material supplies,
and is investing in modernization programs to address technological limitations in their current
systems. However, consumer preferences are shifting rapidly towards the internet, and these trends
may make storefronts redundant or less effective in the long term.
Competitive Pressures and Substitution
Travis Perkins has remained a market leader through innovating and adapting to changes in market
trends and consumer preferences for decades. However, new channels have opened up in the
distribution of goods and services in this industry due to technological advancements and economic
policies. In order to remain cost efficient, many consumers may rather purchase materials through
different supply channels rather than through the Group or traditional competitors, which may make
stores and branches less profitable or relevant. These supply channels, whether through new
entrants via overseas markets, businesses seeking to enter the market, or through manufacturers
directly dealing with consumers, may pose a threat to the profitability and overall relevance of Travis
Perkins in the future, especially with new mediums of trading becoming relevant.
20. Research Report Basic Materials
29-Feb-16
20
Appendix
Revenue Model Mortgage Rate source: http://www.dailymail.co.uk/news/article-
3464467/Get-ready-sub-ONE-CENT-mortgage-Borrowing-set-fall-lowest-levels-
thanks-bank-price-war-rock-bottom-rates.html
Global Assumptions:
We set the upper and lower WACC within a deviation of 1%. The terminal rate was 1%,
with a high terminal rate of 2% and a low terminal rate of 1%. The risk-free rate was set
at the UK 10 year Gilt yield, which is currently 1.39%, and the corporate tax rate of 20%
reflects the updated tax laws as of April 2015.
21. Research Report 29-Feb-16
21
Disclaimer
The information and opinions in EUTIC Research were prepared or are disseminated by EUTIC.
For important disclosures, stock price charts and equity rating histories regarding companies that are the
subject of this report, please see the EUTIC Research Disclosure Website at www.eutic.org
For valuation methodology and risks associated with any price targets referenced in this research report,
please contact the EUTIC Fund Team at fund@eutic.org.
Important Disclosures
EUTIC is not acting as a municipal advisor and the opinions or views contained herein are not intended to be,
and do not constitute, advice within the meaning of Section 975 of the Dodd-Frank Wall Street Reform and
Consumer Protection Act.
EUTIC Research does not provide individually tailored investment advice. EUTIC Research has been prepared
without regard to the circumstances and objectives of those who receive it. EUTIC recommends that investors
independently evaluate particular investments and strategies, and encourages investors to seek the advice of a
financial adviser. The appropriateness of an investment or strategy will depend on an investor's circumstances
and objectives. The securities, instruments, or strategies discussed in EUTIC Research may not be suitable for
all investors, and certain investors may not be eligible to purchase or participate in some or all of them. EUTIC
Research is not an offer to buy or sell or the solicitation of an offer to buy or sell any security/instrument or to
participate in any particular trading strategy. The value of and income from your investments may vary
because of changes in interest rates, foreign exchange rates, default rates, prepayment rates,
securities/instruments prices, market indexes, operational or financial conditions of companies or other
factors. There may be time limitations on the exercise of options or other rights in securities/instruments
transactions. Past performance is not necessarily a guide to future performance. Estimates of future
performance are based on assumptions that may not be realized. If provided, and unless otherwise stated, the
closing price on the cover page is that of the primary exchange for the subject company's
securities/instruments.
With the exception of information regarding Morgan Stanley, EUTIC Research is based on public information.
EUTIC makes every effort to use reliable, comprehensive information, but we make no representation that it is
accurate or complete. We have no obligation to tell you when opinions or information in EUTIC Research
change apart from when we intend to discontinue equity research coverage of a subject company. Facts and
views presented in EUTIC Research have not been reviewed by, and may not reflect information known to,
professionals in other EUTIC business areas.
EUTIC may make investment decisions or take proprietary positions that are inconsistent with the
recommendations or views in this report.
The reader should independently evaluate the investment risks and is solely responsible for their investment
decisions. EUTIC Research may not be distributed to the public media or quoted or used by the public media
without the express written consent of EUTIC.
EUTIC is not incorporated under PRC law and the research in relation to this report is conducted outside the
PRC. EUTIC Research does not constitute an offer to sell or the solicitation of an offer to buy any securities in
the PRC. PRC investors shall have the relevant qualifications to invest in such securities and shall be
responsible for obtaining all relevant approvals, licenses, verifications and/or registrations from the relevant
governmental authorities themselves.
The trademarks and service marks contained in EUTIC Research are the property of their respective owners.
Third-party data providers make no warranties or representations relating to the accuracy, completeness, or
timeliness of the data they provide and shall not have liability for any damages relating to such data.
EUTIC Research or portions of it may not be reprinted, sold or redistributed without the written consent of
EUTIC.
As required by the Capital Markets Board of Turkey, investment information, comments and recommendations
stated here, are not within the scope of investment advisory activity. Investment advisory service is provided
exclusively to persons based on their risk and income preferences by the authorized firms. Comments and
recommendations stated here are general in nature. These opinions may not fit to your financial status, risk
and return preferences. For this reason, to make an investment decision by relying solely to this information
stated here may not bring about outcomes that fit your expectations.