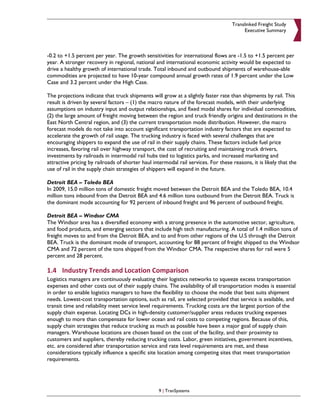
Translinked Freight Study


              December 2011


                 Prepared for:

                  Detroit
                 Regional
                Chamber
Translinked Freight Study


Table of Contents

1       EXECUTIVE SUMMARY ................................................................................................................................... 1
    1.1         TRANSLINKED ................................................................................................................................................... 1
    1.2         RECOMMENDATIONS ......................................................................................................................................... 2
    1.3         REGIONAL FREIGHT FLOWS ................................................................................................................................. 5
    1.4         INDUSTRY TRENDS AND LOCATION COMPARISON .................................................................................................... 9
2       DETROIT BEA FREIGHT FLOWS ..................................................................................................................... 11
    2.1     INTRODUCTION ............................................................................................................................................... 11
    2.2     DETROIT BEA TOTAL CARGO............................................................................................................................. 12
    2.3     DETROIT BEA TRUCK CARGO ............................................................................................................................ 16
       2.3.1 Total ....................................................................................................................................................... 16
       2.3.2 Domestic Inbound and Outbound .......................................................................................................... 18
       2.3.3 Domestic Internal and Through Cargo ................................................................................................... 22
       2.3.4 Imports and Exports ............................................................................................................................... 22
       2.3.5 Canada ................................................................................................................................................... 23
       2.3.6 Mexico ................................................................................................................................................... 24
    2.4     DETROIT BEA RAIL CARGO ............................................................................................................................... 25
       2.4.1 Total ....................................................................................................................................................... 25
       2.4.2 Domestic Inbound and Outbound .......................................................................................................... 27
       2.4.3 Domestic Internal and Through ............................................................................................................. 31
       2.4.4 Imports and Exports (excl. NAFTA) ........................................................................................................ 31
       2.4.5 Canada ................................................................................................................................................... 32
       2.4.6 Mexico ................................................................................................................................................... 33
    2.5     OTHER TRANSPORT MODES .............................................................................................................................. 33
    2.6     CORRIDOR SPECIFIC FLOWS............................................................................................................................... 33
       2.6.1 Halifax Freight Flows ............................................................................................................................. 33
       2.6.2 Montreal Freight Flows .......................................................................................................................... 34
       2.6.3 U.S. Intermodal Rail Corridors ............................................................................................................... 35
3       TOLEDO AND WINDSOR FREIGHT FLOWS .................................................................................................... 37
    3.1         TOLEDO, OHIO ............................................................................................................................................... 37
    3.2         WINDSOR, ONTARIO ....................................................................................................................................... 38
4       INDUSTRY TREND ANALYSIS ........................................................................................................................ 40
    4.1     EXISTING TRANSPORTATION INFRASTRUCTURE AND LOCATION SELECTION FACTORS ..................................................... 40
       4.1.1 Logistics and Transportation Infrastructure Summary .......................................................................... 40
       4.1.2 Rail ......................................................................................................................................................... 41
       4.1.3 Highways ............................................................................................................................................... 43
       4.1.4 Ocean Gateways .................................................................................................................................... 44
       4.1.5 Airports .................................................................................................................................................. 45
       4.1.6 Toledo, OH ............................................................................................................................................. 46
       4.1.7 Windsor, ON .......................................................................................................................................... 47
    4.2     INLAND STRATEGIES AND NETWORK OPTIMIZATION............................................................................................... 48
    4.3     REAL ESTATE INFRASTRUCTURE .......................................................................................................................... 51
    4.4     LABOR AND DEMOGRAPHIC PROFILE ................................................................................................................... 52
    4.5     BUSINESS AND TAX ENVIRONMENT..................................................................................................................... 53
    4.6     FOREIGN TRADE ZONES .................................................................................................................................... 53
    4.7     TRENDS IN TRANSPORTATION AND THE NEAR-TERM OUTLOOK ................................................................................ 54


                                                                             i | TranSystems
Translinked Freight Study


       4.7.1 Trucking Industry ................................................................................................................................... 54
       4.7.2 Trends in U.S. Containerized Trade ........................................................................................................ 57
       4.7.3 Trends in Intermodal Rail ....................................................................................................................... 62
    4.8     REPRESENTATIVE SERVICE PROVIDERS AND SHIPPERS ............................................................................................. 67
5        DETROIT BEA FREIGHT FORECAST ................................................................................................................ 70
    5.1            INTRODUCTION ............................................................................................................................................... 70
    5.2            METHODOLOGY .............................................................................................................................................. 70
    5.3            ECONOMIC REVIEW AND OUTLOOK .................................................................................................................... 71
    5.4            FREIGHT FLOW FORECAST................................................................................................................................. 73
6        COMPARATIVE LOCATION ANALYSIS ........................................................................................................... 77
    6.1     INTRODUCTION ............................................................................................................................................... 77
    6.2     REGIONAL TRUCK/RAIL LOGISTICS COMPARISON................................................................................................... 77
       6.2.1 Transit Time Hurdle ............................................................................................................................... 78
       6.2.2 Total Landed Cost Comparison .............................................................................................................. 78
       6.2.3 Rail Transits ........................................................................................................................................... 79
       6.2.4 Transportation Cost Indication by Gateway .......................................................................................... 79
       6.2.5 Trucking Transits and Market Coverage ................................................................................................ 80
    6.3     LOCATION PROFILES – COLUMBUS AND CHICAGO.................................................................................................. 85
       6.3.1 Columbus, OH ........................................................................................................................................ 85
       6.3.2 Chicago, IL.............................................................................................................................................. 86
    6.4     REGIONAL COMPARISON SUMMARY ................................................................................................................... 88


List of Tables
Table 1-1: Selected Regional Freight Flows in 2009 .................................................................................................................................................5
Table 1-2: Inbound and Outbound Freight Forecast for 2020 – Base, Low and High ....................................................................................8
Table 2-1: Warehouse-able Commodities ............................................................................................................................................................... 14
Table 4-1: Detroit Logistics Summary....................................................................................................................................................................... 40
Table 4-2: West Coast Transit Time Comparison (Transit Days): Shanghai to Detroit .......................................................................... 45
Table 4-3: East Coast Transit Time Comparison (Transit Days): Hong Kong and Rotterdam to Detroit .......................................... 45
Table 4-4: Detroit MSA Warehouse Vacancy and Lease Rates, Third Quarter 2011 ................................................................................ 51
Table 4-5: Detroit-Warren-Livonia, MI Employment by Industry Percent Changes between 2001 and 2011 .................................... 52
Table 4-6: Tax Foundation Business Tax Climate Rank for Selected States ................................................................................................. 53
Table 4-7: Sample of Logistics Providers in the Study Region – Located in Michigan ................................................................................. 67
Table 4-8: Sample of Logistics Providers in the Study Region – Located in Ohio and Ontario ............................................................... 68
Table 4-9: Sample of Major Shippers in the Study Region ................................................................................................................................... 69
Table 5-1: Real Gross Domestic Product by MSA within the Detroit BEA ................................................................................................... 71
Table 5-2: Economic and Industry Factors Related to Goods Movement in the East North Central Region and the Detroit BEA:
Ten-Year Annual Growth Rates, 2010-2020 .......................................................................................................................................................... 72
Table 5-3: Forecast of Inbound and Outbound Freight Flows ........................................................................................................................... 74
Table 5-4: Macro Forecast Growth Rates by Transport Mode ......................................................................................................................... 75
Table 5-5: Inbound and Outbound Freight Forecast for 2020 – Base, Low and High ................................................................................. 76
Table 6-1: Estimated Rail Transits in Hours from Key Port Gateways to Selected Midwest Points ...................................................... 79
Table 6-2: Translinked Study Area Cost* Evaluation by North American Port Gateway ......................................................................... 80
Table 6-3: U.S. and Canada Population within 10-Hour Truck Drive-Time of Detroit and Selected Cities ........................................ 81
Table 6-4: Truck Transit Time from Detroit and Selected U.S. Distribution Hubs to Major Cities ...................................................... 83
Table 6-5: Estimated Truckload Costs from Detroit and Selected U.S. Distribution Hubs to Major Cities ........................................ 84
Table 6-6: Columbus Regional Logistics Summary ............................................................................................................................................... 85
Table 6-7: Chicago Regional Logistics Summary ................................................................................................................................................... 86
Table 6-8: Detroit, Chicago and Columbus Summary Table............................................................................................................................. 88

List of Figures
Figure 1-1: Map of Translinked Region ........................................................................................................................................................................1


                                                                                          ii | TranSystems
Translinked Freight Study


Figure 1-2: Detroit BEA Cargo in 2009 by Transport Mode.................................................................................................................................6
Figure 1-3: Detroit BEA Cargo in 2009 by Trade Flow ..........................................................................................................................................7
Figure 1-4: Detroit BEA Cargo Tons in 2009, Total and Warehouse-able .......................................................................................................7
Figure 1-5: 10-Hour Truck Drive-Time Area Comparison: Detroit, MI, Chicago, IL, Columbus, OH, and Harrisburg, PA ........... 10
Figure 2-1: Map of Detroit BEA .................................................................................................................................................................................. 11
Figure 2-2: Detroit BEA Cargo in 2009 by Transport Mode.............................................................................................................................. 12
Figure 2-3: Detroit BEA Cargo in 2009 by Trade Flow ....................................................................................................................................... 13
Figure 2-4: Value per Cargo Tons .............................................................................................................................................................................. 14
Figure 2-5: Detroit BEA Cargo Tons in 2009, Total and Warehouse-able .................................................................................................... 15
Figure 2-6: Detroit BEA Truck Cargo by Trade Flow in 2009........................................................................................................................... 16
Figure 2-7: Detroit BEA Truck Cargo in 2009 – Top Ten Commodity Groups .......................................................................................... 17
Figure 2-8: Detroit BEA Inbound and Outbound Truck Cargo in 2009 – Top 20 Commodity Groups ............................................... 18
Figure 2-9: Detroit BEA Inbound and Outbound Truck Cargo in 2009 – Top 20 Freight Lanes ............................................................ 19
Figure 2-10: Domestic Inbound Truck Freight ....................................................................................................................................................... 20
Figure 2-11: Domestic Outbound Truck Freight ................................................................................................................................................... 21
Figure 2-12: Detroit BEA Import Truck Cargo in 2009....................................................................................................................................... 22
Figure 2-13: Detroit BEA Export Truck Cargo in 2009....................................................................................................................................... 23
Figure 2-14: Detroit BEA - Canada Truck Cargo in 2009 ................................................................................................................................... 23
Figure 2-15: Detroit BEA - Mexico Truck Cargo in 2009 ................................................................................................................................... 24
Figure 2-16: Detroit BEA Rail Cargo by Trade Flow in 2009............................................................................................................................. 25
Figure 2-17: Detroit BEA Rail Cargo in 2009 – Top Ten Commodity Groups ............................................................................................ 26
Figure 2-18: Detroit BEA Inbound and Outbound Rail Cargo in 2009 – Top 15 Commodity Groups ................................................. 27
Figure 2-19: Detroit BEA Inbound and Outbound Rail Cargo in 2009 – Top Freight Lanes .................................................................... 28
Figure 2-20: Domestic Inbound Rail Freight ............................................................................................................................................................ 29
Figure 2-21: Domestic Outbound Rail Freight........................................................................................................................................................ 30
Figure 2-22: Detroit BEA Import Rail Cargo in 2009 ........................................................................................................................................... 31
Figure 2-23: Detroit BEA Export Rail Cargo in 2009 ........................................................................................................................................... 31
Figure 2-24: Detroit BEA - Canada Rail Cargo in 2009 ....................................................................................................................................... 32
Figure 2-25: Detroit BEA - Mexico Rail Cargo in 2009 ....................................................................................................................................... 33
Figure 2-26: Detroit BEA – Cargo Flows from the Halifax Area in 2009 ....................................................................................................... 34
Figure 2-27: Detroit BEA – Cargo Flows with the Montreal CMA in 2009................................................................................................... 35
Figure 2-28: Detroit BEA - Top-10 U.S. Intermodal Rail Lanes by Cargo Tons in 2009 ............................................................................ 36
Figure 3-1: Port of Toledo Cargo ............................................................................................................................................................................... 37
Figure 3-2: Port of Toledo Commodity Mix ........................................................................................................................................................... 37
Figure 3-3: Detroit BEA Domestic Freight Flows with Toledo BEA, 2009 .................................................................................................... 38
Figure 3-4: Windsor, Ontario CMA Freight Flows in 2009 ................................................................................................................................ 39
Figure 3-5: London, Ontario CMA Freight Flows in 2009 .................................................................................................................................. 39
Figure 4-1: Class I Railroad Map with Container Ports........................................................................................................................................ 42
Figure 4-2: Regional Highway Map ............................................................................................................................................................................. 43
Figure 4-3: Detroit Truck Border Crossings .......................................................................................................................................................... 44
Figure 4-4: Current Rail System in Windsor ........................................................................................................................................................... 47
Figure 4-5: Comparison of Container Sizes............................................................................................................................................................. 48
Figure 4-6: Example of Distribution Center Network ......................................................................................................................................... 49
Figure 4-7: Example of Distribution Center and Cross-Dock Network......................................................................................................... 50
Figure 4-8: Detroit-Warren-Livonia, MI Number of Employees by Industry, August Year over Year, 2001 – 2011 (000) ............ 52
Figure 4-9: Indexes of Trucking Volume (TL and LTL), U.S. Industrial Production and Real GDP: 1995-2010 (1995=100) ........... 54
Figure 4-10: Indexes of Real Revenue per Load for Truckload Freight versus Real Diesel Fuel Prices: 1995-2010 (1995=100) ... 55
Figure 4-11: Indexes of Truckload Loads by Length-of-Haul Segment: 1996-2010 (1996=100) .............................................................. 56
Figure 4-12: Growth of U.S. Containerized Import and Export Loads, 1995-2010 ..................................................................................... 58
Figure 4-13: Far East as a Share of U.S. Containerized Imports and Exports, 1995-2010 ......................................................................... 59
Figure 4-14: Trends in the Composition of U.S. Containerized Imports and Exports, 1995-2010 ......................................................... 60
Figure 4-15: Annual North America Intermodal Rail Volume, 2000 to 2010 ................................................................................................ 62
Figure 4-16: Growth of North America Intermodal Service by Equipment Type, 2000 to 2010 ............................................................ 63
Figure 4-17: Quarterly Average Intermodal Train Speeds for North American Class I Railroads, 2000-2010 ................................... 63
Figure 4-18: Midwest Inbound Intermodal Volume from West Coast and Share, 2000 to 2010 ............................................................ 65
Figure 4-19: Detroit BEA - Top-10 U.S. Intermodal Rail Lanes by Cargo Tons in 2009 ............................................................................ 66
Figure 5-1: Forecast of Detroit BEA Inbound and Outbound Freight Flows – Warehouse-able Commodities ................................. 73
Figure 6-1: 10-Hour Truck Drive-Time Area Comparison: Detroit, MI, Chicago, IL, Columbus, OH, and Harrisburg, PA ........... 82


                                                                                            iii | TranSystems
Translinked Freight Study
                                                                                          Executive Summary


1 EXECUTIVE SUMMARY
1.1 Translinked
The Detroit Regional Chamber is one of the largest chambers of commerce in the country. The Chamber
seeks to power the economy of southeast Michigan through economic development programs, advocacy,
strategic partnerships and valuable member benefits. One key initiative of the Detroit Regional Chamber’s
Economic Development activities is Translinked.

The goal of Translinked is to create an industry cluster of excellence around transportation, distribution and
logistics in the region comprising southeast Michigan, northwest Ohio and southwest Ontario. The
Translinked strategy envisions the mobilization of public, private and academic resources around a
consensus on the physical, financial and institutional infrastructure necessary to create this cluster. This
initiative seeks to attract more freight, perform value-added service and become a key intermodal supply
hub. The overall goal of Translinked is to create an efficient and cost-effective first-tier multimodal
transportation and logistics hub in southeast Michigan, northwest Ohio and southwest Ontario. Translinked
is supported by the Michigan Economic Development Corporation (MEDC), the New Economy Initiative
(NEI), and the Detroit Regional Chamber.

The Translinked region (Figure 1-1) includes major freight centers, including Detroit, Ann Arbor, Lansing,
Flint and Port Huron in Michigan, Toledo in Ohio and Windsor and Sarnia in Ontario, Canada. The region
encompasses major manufacturing
activity (e.g. the automotive industry)
and is situated on the principal border                 Figure 1-1: Map of Translinked Region
crossings for overland trade between
the United States and Canada. A
comprehensive set of freight
infrastructure supports regional
economic activity, including rail and
road border crossings, airports, marine
ports, rail yards, and interstate highways
and rail corridors. The region is also
connected by rail and highway to major
U.S. and Canadian international sea
ports, including New York/New Jersey,
Halifax, Montreal and Norfolk on the
East Coast.

The Translinked Freight Study provides,
subject to the availability of data on
regional freight movements, a data-
driven analysis of existing regional
freight movements, an assessment of
key freight industry trends, and makes
recommendations on how to further
develop the Translinked region.
                                                                  Source: Detroit Regional Chamber


                                                1 | TranSystems
Translinked Freight Study
                                                                                     Executive Summary


1.2 Recommendations
The evaluation of freight flows and industry trends drive the following recommendations for future
development of the Translinked initiative:

        Establish a Translinked Commercial Marketing Initiative
        Involve the Private Sector, Remove Barriers that Slow Down Decision Making
        Remove Variability from the Border Crossing Process
        Include Rail Facilities and Third Party Logistics Providers (3PLs) that Reduce Transportation Costs,
        and Increase Flexibility
        Marketing Initiative and Freight Corridors

The recommendations and next steps are discussed below.

Establish a Translinked Commercial Marketing Initiative
Translinked opportunities are with companies that have specific distribution needs, such as a high
concentration of customers in Northern Michigan, over to Toronto, and including the US Midwest.
Companies that require fastest ocean transits from China or Europe, especially for high value goods, or
manufacturers that receive materials used in production from nearby sources are potential candidates.

      Next Steps: Develop Translinked Marketing Plan

      TranSystems recommends a detailed, company by company analysis to identify opportunities
      based on the specific advantages of the Translinked region.

                  Develop a list of potential Translinked customers. Identifying and selling value will
                  require detailed knowledge of the customer’s business, particularly its supply chain;
                  and facts about the customer’s inventory and supply chain strategy. Carefully
                  identify (segment) beneficial cargo owners (BCO) with high costs, complicated
                  supply chains, or poor inventory performance.

                  Conduct private sector outreach to gather input. Develop supply chain straw-men
                  using various distribution strategies and present them to shippers to assess the
                  viability of Translinked as a supply chain hub. Demonstrate how a Translinked
                  location reduces lowest landed costs. Present regional advantages, such as the CSX
                  intermodal facility in North Baltimore, OH to private sector logistics managers.

                  Once strategies are validated, market regional advantages in industry publications,
                  such as DC Velocity, Inbound Logistics, Journal of Commerce, and American
                  Shipper. The KC (Kansas City) Smartport initiative is an excellent model for
                  marketing strategies that may be applicable to the Translinked initiative.


Involve the Private Sector, Remove Barriers that Slow Down Decision Making
Time is of the essence. Comments made during interviews as part of this study suggest there is a perception
that the overall direction and ownership of Translinked is unclear, and the initiative lacks sufficient
involvement from commercial interests. Commercial participation will be necessary to lend support and


                                                2 | TranSystems
Translinked Freight Study
                                                                                      Executive Summary


credibility to the project. It should be noted that recent improvements in Ohio, such as CSX’s Northwest
Ohio Intermodal Terminal at North Baltimore, Norfolk Sothern’s Heartland Corridor Initiative serving
Columbus, and BNSF’s Chicago rail terminal adjacent to the CenterPoint Intermodal Park have been noticed
in the industry. Successes in the Translinked region itself, such as improvements at the Port of Toledo, have
been attributed to public/private cooperation and agreed priorities. Barriers impeding Translinked progress
should be identified, and addressed. Slow-moving initiatives will lose out to locations that are established,
and proven, and that have active engagement with the private sector.

      Next Steps: Identify and Remove Barriers to Progress

      Focus and prioritize opportunities based on strengths identified in the Marketing Plan, and
      gather private sector support as quickly as possible.

              Solicit active and ongoing participation on the Translinked committee from companies
              such as railroads and third party logistics companies to provide a sense of what is
              commercially viable. The CN Railroad for example actively participated in the design,
              and invested $25 million in the new West Coast ocean terminal at Prince Rupert, BC -
              private investment will signal commercial viability. The Detroit Intermodal Freight
              Terminal (DIFT) may be another example of a successful transportation related
              public/private development.

              Public sector involvement and coordination is crucial, but all parties should adhere to
              commercially based priorities. A failure to agree on priorities may signal an inability to
              move the project forward, and a review of Translinked overall goals and makeup is
              advised.


Remove Variability from the Border Crossing Process
Supply chain managers work to eliminate events that introduce variability into supply chains. The Translinked
region opportunities will be aided by addressing perceptions about the unpredictability of border crossings.
The inclusion of the Toronto area population of 5 million within a distribution range served by the
Translinked region will elevate the effectiveness of the region as a transportation hub. Therefore, addressing
perceptions about unpredictable crossing delays is critical.


      Next Steps: Assess and Manage Border Crossing Perception

              As part of the development of the Translinked Sales/Marketing plan, gather border
              crossing information, including an assessment of perceived vs. real barriers, expected
              delays, and suggestions for improvement.

              Based on this input, develop strategies to correct misconceptions about crossing delays,
              or work with US and Canadian customs agencies to develop programs that reduce
              variability in border wait times. An evaluation of the effectiveness of the Fast Past
              program, which allows truckers to us the “FAST” lane, and reduces the amount of
              paperwork, should be included in the analysis.


                                                3 | TranSystems
Translinked Freight Study
                                                                                       Executive Summary


Include Rail Facilities and Third Party Logistics Providers (3PLs) that Reduce
Transportation Costs, and Increase Flexibility
Distribution centers (DC) on-site at rail terminals, including multiple rail carriers, will reduce truck drayage
costs. Include railroads and shippers in terminal location and design discussions. The presence of 3PL
services, such as warehouse and distribution services, will enable shippers to introduce flexibility to their
supply chains and will provide distribution options in the Translinked region without requiring shippers to
commit capital to an owned facility.

      Next Steps:

               Confirm importance of the Detroit Intermodal Freight Terminal (DIFT) during the
               development of the Translinked Marketing and Sales Plan.

               Revitalize and develop a sense of urgency around the DIFT rail project if potential users
               are attracted to this kind of facility.

               Explore willingness of large DCs, trucking companies; 3PL’s to locate near new DIFT
               facility, and zone appropriately if needed to support logistics facilities.


Marketing Initiative and Freight Corridors
The Translinked region is strategically located on several major trade corridors, notably cross-border with
Canada. In addition, the region’s consumers and industry are served by several important port gateways in
the U.S. (e.g. ports of New York/New Jersey, Norfolk and Los Angeles/Long Beach) and Canada (the ports
of Halifax, Montreal and Prince Rupert). In developing the Translinked marketing initiative discussed above,
focus should be placed on companies that could benefit from the following freight corridors:

        International trade via:
            − Canadian ports of Halifax, Montreal and Prince Rupert.
            − U.S. Northeast ports, notably New York/New Jersey, Norfolk, and Baltimore. Investments
                in rail infrastructure by CSX and NS are making these gateways even more accessible for
                the Translinked region.
            − U.S. West Coast ports, which are the principal gateways for U.S. trade with the Far East.

        Highway and rail corridors serving major consumption markets in the U.S.

        Cross-border highway and rail corridors with major consumption markets in Canada, notably
        markets in Ontario.

The marketing initiative should also incorporate testing the perceived value of the different North American
Gateways, such as the Prince Rupert Gateway, with the fastest transit from China, or the Halifax Gateway,
and evaluate shipper preferences of North American gateways into the study area. The market strategy
initiative should include shippers who transport the fastest growing commodities. For example, Machinery
and Parts Manufacturing, and Electronics Manufacturing have projected ten-year annual growth rates of 4.4
percent and 5.0 percent respectively. Keep in mind that these growth rates may reflect a recovery from
steep declines experienced during the economic downturn; however, logistics service opportunities may
emerge as the recovery continues.


                                                  4 | TranSystems
Translinked Freight Study
                                                                                                            Executive Summary


1.3 Regional Freight Flows
Regional economic activity generates inbound, outbound and internal freight flows. The Translinked region
also sees freight moving through the region between Canada and the rest of the U.S. An overview of
selected regional freight flows in 2009, the latest year for Transearch Freight Data1, is presented in Table
1-1. The main characteristics of freight flows are discussed below.

                                         Table 1-1: Selected Regional Freight Flows in 2009
                                                         Tons by         Tons by        Tons by     Tons by Other          Total
                                       Total Tons
                                                           Truck            Rail         Water             Modes           Value
                                          Detroit BEA Freight Flows in 2009 (Million Tons and Billion $)
        Total                               286.60          206.07          52.81           26.60                 1.12     $413.5
                    1
        Domestic                            212.00          160.42          30.85           20.69                 0.04     $248.8
                         Inbound            107.54           66.10          22.44           18.99                 0.02     $107.1
                        Outbound             51.30           42.00           8.20            1.07                 0.02     $101.7
                         Internal            47.07           46.22           0.21            0.63                 0.00      $26.1
                         Through              6.09            6.09           0.00            0.00                 0.00      $13.9
        Canada                               54.02           34.09          18.85            0.00                 1.08     $129.7
                         Inbound              5.97            3.37           1.95            0.00                 0.65      $18.3
                        Outbound              3.16            2.40           0.39            0.00                 0.37      $10.7
                         Through             44.89           28.32          16.51            0.00                 0.06     $100.7
        Mexico                                2.64            1.12           1.52            0.00                 0.00      $14.0
                         Inbound              1.63            0.56           1.07            0.00                 0.00      $10.1
                        Outbound              0.94            0.49           0.45            0.00                 0.00       $3.6
                         Through              0.08            0.07           0.01            0.00                 0.00       $0.2
        Import & Export 2                    17.93           10.44           1.59            5.91                 0.00      $21.1

                                    Detroit BEA – Toledo BEA Freight Flows in 2009 (Million Tons and Billion $)
        Total 3                              15.81           14.57           0.35            0.89                 0.00      $6.95
                         Inbound             10.84            9.82           0.14            0.88                 0.00      $4.47
                        Outbound              4.97            4.74           0.21            0.01                 0.00      $2.47

                                Detroit BEA – Windsor CMA Freight Flows in 2009 (Million Tons and Billion $)
                4
        Total                                 1.42            1.16           0.19            0.00                 0.07      $4.75
                         Inbound              0.25            0.19           0.06            0.00                 0.00      $1.28
                        Outbound              0.18            0.13           0.00            0.00                 0.05      $0.39
                         Through              0.99            0.83           0.13            0.00                 0.02      $3.08

         (1) Domestic flows include some international cargo that moves as “domestic” freight – e.g. overseas imports moving in
             domestic 53-foot containers from the U.S. discharge port to the Detroit BEA.
         (2) Overseas import and export cargo that moves intact between U.S. ports and the Detroit BEA.
         (3) Freight moving between the Detroit BEA and the Toledo BEA.
         (4) Freight moving between the Detroit BEA and the Windsor CMA, and freight moving through the Detroit BEA
             between the Windsor CMA and the rest of the U.S.
                                            Source: IHS Global Insight Transearch Data


1
    This Study includes content supplied by IHS Global Insight (USA), Inc; Copyright 2011 IHS Global Insight (USA), Inc.


                                                                 5 | TranSystems
Translinked Freight Study
                                                                                           Executive Summary


Detroit BEA Freight Flows
The Detroit-Warren-Flint Business Economic Area
                                                               Figure 1-2: Detroit BEA Cargo in 2009 by
(Detroit BEA) covers the cities of Detroit, Flint and
                                                                            Transport Mode
Warren, and surrounding areas. The Detroit BEA
had total estimated cargo flows amounting to 287
million tons in 2009 with an estimated value of
$414 billion. Total cargo comprises several
different transport modes – truck, rail, water (via
the Great Lakes), air and other – and includes all
trade flows, domestic and international, inbound,
outbound, internal (movements within the Detroit
BEA) and through (not stopping in the Detroit
BEA).

Truck is the dominant mode with 72 percent of
cargo volume and 81 percent of cargo value, the
larger share of value reflecting the higher-value
commodities that move via truck. Rail handles both
lower-value and higher-value commodities, and it
accounts for 18 percent of both volume and value.
The water mode accounts for 9 percent of tons but
less than one percent of value due to the low-value        Note: Includes domestic and international, and all directions
bulk commodities shipped by water. The highest                     – inbound, outbound, internal and through
value freight is shipped by air.                            Source: Derived from IHS Global Insight Transearch Data

Total cargo is spread across different directions
and trades (Figure 1-3). Domestic cargo accounts for 74 percent of total tons and 60 percent of value.
Domestic cargo includes some international cargo that moves as domestic freight to or from U.S. ports (e.g.
New York/New Jersey). International trade related to Canada accounted for 19 percent of tons and 31
percent of value, while international trade with Mexico was one percent of tons and 3 percent of value.
Import and Export trade that moves intact to and from U.S. ports accounted for 6 percent of tons and 5
percent of value.

Inbound and outbound cargo amounted to 183 million tons in 2009 with an estimated value of $270 billion.
These flows are driven by industry and consumption, and generate the principal demand for warehousing
and logistics facilities. The largest directional flow is inbound to the Detroit BEA.

The region also has a large volume of internal cargo movement (18 percent of total tons and 7 percent of
value), a significant share of which is truck shipments to and from warehouses within the region and drayage
of containers to and from intermodal rail yards. A large amount of cargo also moves through the Detroit
BEA, notably between Canada and other regions of the U.S., and is handled by the border crossing points in
the Detroit BEA.


                                                 6 | TranSystems
Translinked Freight Study
                                                                                               Executive Summary


                            Figure 1-3: Detroit BEA Cargo in 2009 by Trade Flow


                                Source: Derived from IHS Global Insight Transearch Data


When evaluating the region’s cargo, it is helpful to
focus on commodities that are more suited to                    Figure 1-4: Detroit BEA Cargo Tons in 2009,
added-value logistics services or undergo some form                      Total and Warehouse-able
of manufacturing process. Such commodities will be
of primary interest to the development of industry
and logistics services. The broadly defined
“warehouse-able” commodities are those with a
relatively high value per metric ton and/or
commodities that are processed (e.g. food products)
as opposed to raw materials (e.g. grain). These
commodities are more likely to require added-value
logistics services.

Warehouse-able cargo was an estimated 141 million
tons in 2009, 49 percent of total Detroit BEA cargo.
Warehouse-able cargo accounted for an estimated
90 percent of total cargo value, which reflects the
higher value nature of warehouse-able commodities
(e.g. consumer products). These commodities
accounted for 42 percent of inbound tons, and their       Source: Derived from IHS Global Insight Transearch Data
share was highest in the cross-border inbound trade
– 64 percent of tons from Canada and 99 percent of
tons from Mexico – and compared to 41 percent of domestic inbound tons. Warehouse-able commodities
accounted for 66 percent of total outbound tons. Penetration by trade was – domestic outbound 68 percent
of domestic tons, shipments to Canada 48 percent and shipments to Mexico 87 percent.


                                                   7 | TranSystems
Translinked Freight Study
                                                                                                      Executive Summary


Detroit BEA Freight Flow Forecast
The forecast of inbound and outbound freight (warehouse-able) commodities is presented in Table 1-2. The
Base projections of cargo flows driven by assumptions related to regional, national and international
economic activity, and relationships between industry inputs and outputs. Total inbound and outbound
freight is projected to have increased from 89.9 million tons in 2009 to 97.8 million tons in 2010, driven by
recovery from the recession and growth of industries in the region. Total inbound and outbound freight is
projected to increase to 126.0 million tons in 2020, based on domestic economic growth and the expansion
of cross-border trade with Mexico and Canada, and growth of trade with overseas markets. The projected
10-year (2010 to 2020) compound annual growth rate (CAGR) is 2.6 percent.

               Table 1-2: Inbound and Outbound Freight Forecast for 2020 – Base, Low and High
                                         Inbound Freight (Warehouse-able Commodities)
                                                                   2020 Tons                            CAGR 2010 to 2020
 Trade               2009 Tons        2010 Tons            Base            Low           High         Base       Low         High
 Domestic            44,334,660       47,678,414      59,970,374     57,318,605     63,775,639         2.3%      1.9%        3.0%
 Canada               3,835,424        4,232,502       5,513,774      5,127,613      5,798,233         2.7%      1.9%        3.2%
 Mexico               1,613,233        1,761,005       2,981,832      2,708,501      3,145,764         5.4%      4.4%        6.0%
 Import               1,205,197        1,343,248       2,028,841      1,859,298      2,273,105         4.2%      3.3%        5.4%
 Grand Total        50,988,514       55,015,169      70,494,821     67,014,016     74,992,742         2.5%       2.0%        3.1%
                                        Outbound Freight (Warehouse-able Commodities)
                                                                   2020 Tons                            CAGR 2010 to 2020
 Trade               2009 Tons        2010 Tons            Base            Low           High         Base       Low         High
 Domestic            34,989,373       38,422,157      49,083,371     44,989,601     51,752,543         2.5%      1.6%        3.0%
 Canada               1,512,627        1,665,247       2,218,630      2,059,365      2,308,990         2.9%      2.1%        3.3%
 Mexico                812,665           927,945       1,451,046      1,369,738      1,658,503         4.6%      4.0%        6.0%
 Export               1,581,080        1,796,395       2,756,368      2,495,304      3,036,918         4.4%      3.3%        5.4%
 Grand Total        38,895,745       42,811,744      55,509,415     50,914,008     58,756,955         2.6%       1.7%        3.2%
                                  Inbound & Outbound Freight (Warehouse-able Commodities)
                                                                   2020 Tons                            CAGR 2010 to 2020
 Trade               2009 Tons        2010 Tons            Base            Low           High         Base       Low         High
 Domestic            79,324,033       86,100,571     109,053,745    102,308,206    115,528,183         2.4%      1.7%        3.0%
 Canada               5,348,051        5,897,749       7,732,404      7,186,977      8,107,223         2.7%      2.0%        3.2%
 Mexico               2,425,898        2,688,950       4,432,877      4,078,239      4,804,267         5.1%      4.3%        6.0%
 Import & Export      2,786,277        3,139,643       4,785,209      4,354,602      5,310,023         4.3%      3.3%        5.4%
 Grand Total        89,884,258       97,826,912    126,004,235     117,928,024    133,749,697         2.6%       1.9%        3.2%

                                  Source: TranSystems Forecasts and IHS Global Insight 2009 data.

Low and high case projections are also presented in Table 1-2. The basis for these alternative projections is
that the principal driver of freight flows is economic activity, represented by indicators such as disposable
income and industrial production. In addition, housing-sensitive commodities are subject to more
uncertainties going forward due to uncertainty as to the timing of recovery in regional housing markets. In
general, the sensitivities for non-housing related commodities (e.g. transportation equipment) are -0.5to
+0.5 percent per year. Secondary traffic is assumed to be 25 percent housing-related and the sensitivities are


                                                         8 | TranSystems
Translinked Freight Study
                                                                                         Executive Summary


-0.2 to +1.5 percent per year. The growth sensitivities for international flows are -1.5 to +1.5 percent per
year. A stronger recovery in regional, national and international economic activity would be expected to
drive a healthy growth of international trade. Total inbound and outbound shipments of warehouse-able
commodities are projected to have 10-year compound annual growth rates of 1.9 percent under the Low
Case and 3.2 percent under the High Case.

The projections indicate that truck shipments will grow at a slightly faster rate than shipments by rail. This
result is driven by several factors – (1) the macro nature of the forecast models, with their underlying
assumptions on industry input and output relationships, and fixed modal shares for individual commodities,
(2) the large amount of freight moving between the region and truck friendly origins and destinations in the
East North Central region, and (3) the current transportation mode distribution. However, the macro
forecast models do not take into account significant transportation industry factors that are expected to
accelerate the growth of rail usage. The trucking industry is faced with several challenges that are
encouraging shippers to expand the use of rail in their supply chains. These factors include fuel price
increases, favoring rail over highway transport, the cost of recruiting and maintaining truck drivers,
investments by railroads in intermodal rail hubs tied to logistics parks, and increased marketing and
attractive pricing by railroads of shorter haul intermodal rail services. For these reasons, it is likely that the
use of rail in the supply chain strategies of shippers will expand in the future.

Detroit BEA – Toledo BEA
In 2009, 15.0 million tons of domestic freight moved between the Detroit BEA and the Toledo BEA, 10.4
million tons inbound from the Detroit BEA and 4.6 million tons outbound from the Detroit BEA. Truck is
the dominant mode accounting for 92 percent of inbound freight and 96 percent of outbound freight.

Detroit BEA – Windsor CMA
The Windsor area has a diversified economy with a strong presence in the automotive sector, agriculture,
and food products, and emerging sectors that include high tech manufacturing. A total of 1.4 million tons of
freight moves to and from the Detroit BEA, and to and from other regions of the U.S through the Detroit
BEA. Truck is the dominant mode of transport, accounting for 88 percent of freight shipped to the Windsor
CMA and 72 percent of the tons shipped from the Windsor CMA. The respective shares for rail were 5
percent and 28 percent.

1.4 Industry Trends and Location Comparison
Logistics managers are continuously evaluating their logistics networks to squeeze excess transportation
expenses and other costs out of their supply chains. The availability of all transportation modes is essential
in order to enable logistics managers to have the flexibility to choose the mode that best suits shipment
needs. Lowest-cost transportation options, such as rail, are selected provided that service is available, and
transit time and reliability meet service level requirements. Trucking costs are the largest portion of the
supply chain expense. Locating DCs in high-density customer/supplier areas reduces trucking expenses
enough to more than compensate for lower ocean and rail costs to competing regions. Because of this,
supply chain strategies that reduce trucking as much as possible have been a major goal of supply chain
managers. Warehouse locations are chosen based on the cost of the facility, and their proximity to
customers and suppliers, thereby reducing trucking costs. Labor, green initiatives, government incentives,
etc. are considered after transportation service and rate level requirements are met, and these
considerations typically influence a specific site location among competing sites that meet transportation
requirements.


                                                  9 | TranSystems
Translinked Freight Study
                                                                                      Executive Summary


The Translinked region performs well under a variety of criteria used by shippers and manufacturers to
select locations, including transportation infrastructure (rail and highway and airports), access to ocean
gateways for international trade, and the availability of warehousing and distribution facilities.

The Translinked region must compete against two regional hubs – Columbus, OH, and Chicago, IL – that
are well established and in a strong position to compete for DC operations in the Midwest. Columbus has a
higher U.S. and Canadian population reach, and Chicago has superior rail and air cargo services, as well as a
large Midwest distribution reach. Both of these locations have competitive labor and industrial real estate
costs as well. Translinked region opportunities are with companies with specific distribution needs, such as a
high concentration of customers in Northern Michigan, over to Toronto, and including parts of the U.S.
Midwest. Companies that require fastest ocean transits from China or Europe, or manufacturers that
receive materials used in production from nearby sources are other potential candidates.


    Figure 1-5: 10-Hour Truck Drive-Time Area Comparison: Detroit, MI, Chicago, IL, Columbus,
                                     OH, and Harrisburg, PA


                                             Source: TranSystems


                                                10 | TranSystems
Translinked Freight Study
                                                                                           Existing Freight Flows


2 DETROIT BEA FREIGHT FLOWS
2.1 Introduction
The first step in the evaluation of freight flows is to address the Detroit BEA2, which encompasses the main
Translinked centers of Detroit, Flint, Ann Arbor, Lansing and Port Huron. As shown in Figure 2-1, the
Detroit BEA covers the eastern portion Michigan and the major freight corridors through Southeast
Michigan.

                                           Figure 2-1: Map of Detroit BEA


                                                    Source: TranSystems

The primary source for freight flows related to the Detroit BEA is the Transearch Database from IHS
Global Insight3. This database provides statistics on domestic freight flows, and cross-border freight flows
with Canada and Mexico. The latest year available for this study was 2009, which was a depressed year for

2
    BEAs are designated by the Department of Commerce and each Economic Area represents a major economic center
3
    This Study includes content supplied by IHS Global Insight (USA), Inc; Copyright 2011 IHS Global Insight (USA), Inc.


                                                      11 | TranSystems
Translinked Freight Study
                                                                                                Existing Freight Flows


economic activity and freight activity. However, the database is still appropriate for providing a profile of
freight flows related to the Detroit BEA. This database is supplemented by statistics on U.S. containerized
trade from JOC Piers and data on cross-border flows from the Bureau of Transportation Statistics.

2.2 Detroit BEA Total Cargo
The Detroit-Warren-Flint Business Economic Area (Detroit BEA) covers the cities of Detroit, Flint and
Warren, and surrounding areas. It had a population of 6.9 million in 2009, with Total Personal Income (TPI)
of $247 billion, and per capita income of $35,713.4 The Detroit BEA ranked 10th by population, 12th by TPI
and 75th by per capita income out of the country’s 179 BEAs tracked by the Bureau of Economic Analysis.
The Detroit BEA borders five other BEAs5 that had a combined population of 4.2 million in 2009, generating
TPI of $134 billion, and per capita income of $31,738.

The Detroit BEA had total estimated cargo flows
                                                                     Figure 2-2: Detroit BEA Cargo in 2009 by
amounting to 287 million tons in 2009 with an
                                                                                  Transport Mode
estimated value of $414 billion. Total cargo
comprises several different transport modes
(Figure 2-2) – truck, rail, water (via the Great
Lakes), air and other – and includes all trade flows,
domestic and international, inbound, outbound,
internal (movements within the Detroit BEA) and
through (not stopping in the Detroit BEA).

Truck is the dominant mode with 72 percent of
cargo volume and 81 percent of cargo value, the
larger share of value reflecting the higher-value
commodities that move via truck. Rail handles both
lower-value and higher-value commodities, and it
accounts for 18 percent of both volume and value.
The water mode accounts for 9 percent of tons but
less than one percent of value due to the low-value
bulk commodities (e.g. iron ore) shipped by water.
The highest value freight is shipped by air, but air
only handles 0.03 percent of total tons and 0.35                  Note: Includes domestic and international, and all directions
percent of total value. In 2009, the values per cargo                     – inbound, outbound, internal and through
ton by transport mode were $1,616 for truck,                       Source: Derived from IHS Global Insight Transearch Data
$1,456 for rail, $63 for water, and $17,445 for air.

As shown in Figure 2-3, total cargo is spread across different directions and trades. Domestic cargo
accounts for 74 percent of total tons and 60 percent of value. Domestic cargo includes some international
cargo that moves as domestic freight to or from U.S. ports (e.g. New York/New Jersey). For example, an
import will be “converted” to domestic freight when it, for example, enters an import distribution center
(IDC) and then departs the IDC in domestic equipment for the Detroit BEA.

International trade related to Canada accounted for 19 percent of tons and 31 percent of value, while
international trade with Mexico was 1 percent of tons and 3 percent of value. Import and Export trade that

4   Data is for 2009 from the Bureau of Economic Analysis
5   Alpena, Traverses City, Grand Rapids-Muskegon-Holland, Fort Wayne-Huntington-Auburn, and Toledo-Fremont


                                                       12 | TranSystems
Translinked Freight Study
                                                                                            Existing Freight Flows


moves intact to and from U.S. ports accounted for 6 percent of tons and 5 percent of value. For example,
this trade flow includes imports and exports moving in international marine containers by intermodal rail
service between the Detroit BEA and U.S. ports.

The main cargo flows of interest in this Study are inbound and outbound, which together amounted to 183
million tons in 2009 with an estimated value of $270 billion, 64 percent of total tons and 65 percent of total
cargo value. These flows are driven by industry and consumption, and generate the principal demand for
warehousing and logistics facilities, within the Detroit BEA. The largest directional flow is inbound to the
Detroit BEA, 43 percent of tons and 36 percent of value. Outbound flows account for 21 percent of tons
and 29 percent of value, the higher share of value driven by the presence of higher value manufactured
goods in the outbound trade from the Detroit BEA.

The region also has a large volume of internal cargo movement, 18 percent of total tons and 7 percent of
value. Nearly 70 percent of internal traffic is truck shipments to and from warehouses within the region (for
example, deliveries from warehouses to stores), drayage of containers to and from intermodal rail yards,
and movements of petroleum refining products. The internal cargo category includes an element of double
counting of the inbound and outbound flows. For example, an inbound shipment enters a warehouse in the
Detroit BEA and then departs the warehouse as a local delivery to a store or manufacturing plant. There is
also a large amount of cargo moving through the Detroit BEA, notably between Canada and other regions of
the U.S., and handled by the border crossing points in the Detroit BEA. Through freight is generated by
economic activity unrelated to the Detroit BEA.


                          Figure 2-3: Detroit BEA Cargo in 2009 by Trade Flow


                               Source: Derived from IHS Global Insight Transearch Data


The cargo flows identified above have considerable variation in terms of value per cargo ton. While
domestic inbound is the largest cargo flow it has one of the lowest values per cargo ton due to the presence
of a large volume of lower-value commodities. By contrast, higher-value commodities dominate the
international cargo flows. As shown in Figure 2-4, the highest values per cargo ton are present in the cross-


                                                  13 | TranSystems
Translinked Freight Study
                                                                                            Existing Freight Flows


border trade with Mexico and Canada, due to the
large presence movement of manufactured goods in                          Figure 2-4: Value per Cargo Tons
these lanes.

When evaluating the region’s cargo, it is helpful to
focus on commodities that are more suited to
added-value logistics services or undergo some
form of manufacturing process. Such commodities
will be of primary interest to the development of
industry and logistics services in the Detroit BEA.
The broadly defined “warehouse-able”
commodities are those with a relatively high value
per metric ton and/or commodities that are
processed (e.g. food products) as opposed to raw
materials (e.g. grain). These commodities are more
likely to require added-value logistics services
including warehousing and distribution services.
Commodity groups are identified as warehouse-
able (Table 2-1) based on value per ton data,            Source: Derived from IHS Global Insight Transearch Data
commodity characteristics and judgment using
experience from prior projects. Given the broad
commodity groups in the source data, a commodity
group may contain a mixture of higher value and lower value components.

                                   Table 2-1: Warehouse-able Commodities
            Warehouse-able Commodity Groups                                 Other Commodity Groups
           (Higher Value / Distribution Potential)                      (Lower Value / Distribution Potential)
    Alcoholic Beverages        Pharmaceutical Products        Agricultural Products         Petroleum Products
    All Other Machinery        Plastics And Rubber            Base Metal                    Rocks Stone And Sand
    Base Metal Articles        Printed Materials              Cereals                       Wood Products
    Food Products              Textiles And Articles          Chemical Products             Waste And Scrap
    Electronics                Tobacco Products               Coal
    Furniture                  Transportation Equipment       Fertilizer
    Live Animals And Fish      Vehicles And Parts             Logs And Rough Lumber
    Misc Manufactured Prod                                    Mineral Products
                                                Source: TranSystems

Warehouse-able cargo was an estimated 141 million tons in 2009, 49 percent of total Detroit BEA cargo.
Warehouse-able cargo accounted for an estimated 90 percent of total cargo value, which reflects the higher
value nature of warehouse-able commodities (e.g. consumer products).


                                                     14 | TranSystems
Translinked Freight Study
                                                                                     Existing Freight Flows


The distribution of warehouse-able commodities by
                                                           Figure 2-5: Detroit BEA Cargo Tons in 2009,
direction is shown in Figure 2-5. Looking at the                    Total and Warehouse-able
inbound flow, these commodities accounted for 42
percent of inbound tons. Their share was highest in
the cross-border inbound trade – 64 percent of tons
from Canada and 99 percent of tons from Mexico –
and compared to 41 percent of domestic inbound
tons.

Warehouse-able commodities accounted for 66
percent of total outbound tons. Penetration by trade
was – domestic outbound 68 percent of domestic
tons, shipments to Canada 48 percent and shipments
to Mexico 87 percent.

Warehouse-able commodities are also a prominent
part of through cargo, with a 71 percent share.
Through cargo is mostly freight moving between
Canada and other parts of the U.S. More detailed
discussion of cargo flows, with an emphasis on             Source: Derived from IHS Global Insight Transearch Data
inbound and outbound flows, is provided in Section
2.3 (truck cargo), Section 2.4 (rail cargo), and
Section 2.5 (other modes).


                                              15 | TranSystems
Translinked Freight Study
                                                                                                  Existing Freight Flows


2.3 Detroit BEA Truck Cargo
2.3.1 Total
Truck is the dominant transportation mode for freight moving in, out, within and through the Detroit BEA,
accounting for 72 percent of tons and 81 percent of cargo value in 2009. This truck freight is generated by
local consumption and industrial production, local and regional distribution, and freight movements through
the Detroit BEA between other regions (e.g. Canada to other parts of the U.S.). Total truck freight
amounted to 206 million tons with a total value of $333 billion.

Truck cargo comprises a variety of flows and truck modes as shown in Figure 2-6. The largest segment by
tonnage is domestic inbound freight, which accounted for 32 percent of tons in 2009 and 29 percent of total
value. This segment is followed by domestic internal6 (22 percent and 8 percent), and domestic outbound
(22 percent and 8 percent). Truck freight related to Canada (inbound, outbound and through) is also
significant with 17 percent of tons and 30 percent of value; Canada’s larger share of value is due to the
shipment of manufactured goods, notably finished motor vehicles and motor vehicle parts and accessories.


                            Figure 2-6: Detroit BEA Truck Cargo by Trade Flow in 2009


                   Note: Canada and Mexico is classified as Truck, which captures both truckload and LTL service.
                                    Source: Derived from IHS Global Insight Transearch Data


Truck cargo moves by several different truck modes – truckload, less-than-truckload (LTL), private fleet, and
truck (freight moving to and from Mexico and Canada). Private fleet involves freight handled by private in-
house truck fleets, such as those operated by retailers, as opposed to commercial common carrier
truckload services. LTL is a relatively specialist sector involving the transport of higher value and/or time
sensitive and/or small volume freight. Trade with Canada and Mexico is classified under a general “Truck”
category and this cargo is largely moved by commercial truckload service. Truckload freight is the principal

6
    Freight with its origin and destination within the Detroit BEA


                                                         16 | TranSystems
Translinked Freight Study
                                                                                            Existing Freight Flows


truck mode with 44 percent of both cargo tons and value. Private Fleet truck shipments are the second
largest truck mode measured by tons (38 percent) and the third largest by value (23 percent), which reflects
the lower value basic materials (e.g. gravel and sand) that are a significant amount of this truck mode.

A profile of regional truck cargo (domestic and international, all directions) by commodity group is provided
in Figure 2-7. The largest commodity group is Nonmetallic Minerals, which amounted to 31 million tons in
2009 and 15 percent of the region’s truck cargo, and involves shipments of low value materials including
sand and gravel. The second largest commodity group is Secondary Traffic (28 million tons and 14 percent),
which is largely made up of Warehouse and Distribution Center traffic (for example, deliveries of consumer
products from warehouses to stores) but also includes some freight drayage related to intermodal rail yards
and airports. Farm Products (28 million tons and 14 percent) includes grains, livestock, fruits and vegetables,
and other agricultural products. Food or Kindred Products (11 percent) includes a blend of intermediary
products for further processing and final products, and examples are animal by-products, pet food,
fresh/chilled/frozen meat, soft drinks and mineral water, and canned fruits and vegetables. The top four
commodity groups are then followed by a mixture of industrial inputs and outputs – chemicals, petroleum
and coal, primary metal products, etc. Transportation Equipment (ranked eighth with 4 percent of truck
tons) captures the shipment of Motor Vehicles and Motor Vehicle Parts or Accessories by truck.

The commodity ranking shifts when a filter is applied to identify the warehouse-able commodities, those
suited to warehousing and logistics services (see background discussion in Section 2.XX). Secondary Traffic
becomes the top commodity group and bulk-focused commodities fall down the rankings (e.g. Farm
Products and Nonmetallic Minerals). The second and third ranked commodity groups are Food or Kindred
Products and Chemicals or Allied Products. Further analysis of commodities, with a focus on the
warehouse-able commodities, is provided in the discussion of domestic and international truck flows by
direction (inbound, outbound, etc.) presented below.


               Figure 2-7: Detroit BEA Truck Cargo in 2009 – Top Ten Commodity Groups


                               Source: Derived from IHS Global Insight Transearch Data


                                                 17 | TranSystems
Translinked Freight Study
                                                                                               Existing Freight Flows


2.3.2 Domestic Inbound and Outbound
Domestic inbound and outbound flows together account for 52 percent of truck cargo tons related to the
Detroit BEA. This cargo is generated by industry and consumption within the Detroit BEA, and demand in
the rest of the country.

In 2009, the Detroit BEA had inbound truck cargo of 66 million tons with an estimated value of $95 billion.
Approximately 41 million tons (62 percent) with a value of $87 billion (92 percent) is classified as
warehouse-able cargo. As shown in Figure 2-8, nearly all the top commodity groups shipped inbound to the
Detroit BEA fall into the warehouse-able category. Some of the more significant individual warehouse-able
commodities are Warehouse and Distribution Center freight, a variety of dry food products (e.g. soft drinks
and canned goods), Motor Vehicle Parts and Accessories, and Forest Products. The lower-value and defined
as non-warehouse-able commodities include Grains, Broken Stone and Riprap and Petroleum Refining
Products.

The Detroit BEA generated 42 million tons of outbound cargo with a value of $76 billion in 2009. An
estimated 31 million tons (74 percent) with a value of $73 billion (95 percent) was defined as warehouse-
able cargo. The top outbound commodity group (Figure 2-8) was Secondary Traffic, nearly all falling into the
Warehouse and Distribution Center category. Other individual outbound warehouse-able commodities
include Grain Mill Products, Motor Vehicles, and Motor Vehicle Parts and Accessories.

       Figure 2-8: Detroit BEA Inbound and Outbound Truck Cargo in 2009 – Top 20 Commodity
                                              Groups


                                  Source: Derived from IHS Global Insight Transearch Data


                                                   18 | TranSystems
Translinked Freight Study
                                                                                              Existing Freight Flows


Domestic inbound and outbound truck freight is heavily concentrated in short-haul lanes with regions
surrounding the Detroit BEA. Figure 2-9 shows the top partner BEAs measured by tons. Based on 2009
data, the top-ten partner BEAs accounted for 70 percent of inbound and outbound truck tonnage, and all
these BEAs were in the states of Michigan, Ohio, Illinois and Indiana. The next ten BEAs accounted for 12
percent of inbound and outbound freight, and four of these BEAs were in Ohio and Wisconsin. More distant
BEAs ranked in the top-twenty were New York, Buffalo, Pittsburg, Los Angeles, Rochester and Minneapolis.

The distribution by lane is little changed when focusing on the warehouse-able commodity segment. As also
shown in Figure 2-9, the top ten part BEAs are all in Michigan, Ohio, Indiana and Illinois, and they accounted
for 68 percent of warehouse-able cargo tons. Prominent among the partner BEAs are important logistics
hubs, including Chicago, IL.


     Figure 2-9: Detroit BEA Inbound and Outbound Truck Cargo in 2009 – Top 20 Freight Lanes


                                 Source: Derived from IHS Global Insight Transearch Data


                                                   19 | TranSystems
Translinked Freight Study
                                                 Existing Freight Flows


Figure 2-10: Domestic Inbound Truck Freight


               20 | TranSystems
Translinked Freight Study
                                                  Existing Freight Flows


Figure 2-11: Domestic Outbound Truck Freight


               21 | TranSystems
Translinked Freight Study
                                                                                                   Existing Freight Flows


2.3.3 Domestic Internal and Through Cargo
The Detroit BEA had internal7 truck cargo of 46 million tons with an estimated value of $26 billion. Much of
this traffic is of lower value commodities and the largest commodity is Nonmetallic Minerals (17.1 million
tons). Other main commodity groups are Secondary Traffic (7.1 million tons), Farm Products (6.5 million
tons), Petroleum or Coal Products (6.4 million tons), Clay, Concrete, Glass or Stone (4.1 million tons),
Chemicals or Allied Products (1.5 million tons), Lumber or Wood Products (1.3 million tons), and Waste or
Scrap Materials (1.0 million tons).

Higher-value warehouse-able cargo was an estimated 13 million tons (28 percent) and accounted for 75
percent of the value of internal cargo. The largest component of the warehouse-able cargo is Secondary
Traffic, which is made up of Warehouse and Distribution Center traffic (5.6 million tons), drayage of rail
intermodal cargo to and from ramps (1.5 million tons), and a small amount of air freight drayage.

A large volume of domestic cargo flows through the Detroit BEA without stopping. In 2009, this domestic
through cargo amounted to 6.1 million tons with an estimated value of $14 billion. A majority of this cargo,
4.7 million tons or 76 percent, originates in and is destined for the Grand Rapids BEA, west of the Detroit
BEA. Approximately, 5.4 million tons or 89 percent with a value of $13.7 billion is classified as warehouse-
able. The two main warehouse-able commodities were Secondary Traffic and Food or Kindred Products,
which together accounted for 51 percent of warehouse-able commodity tons.

2.3.4 Imports and Exports
The IHS Global Insight database provides estimates of import and export shipments that move intact
between the international ocean port (e.g. Port of New York/New Jersey) and the Detroit BEA. These
estimates do not capture all international freight moving in these corridors, much of which moves in
domestic equipment as domestic freight. For example, a containerized import will be “converted” to
domestic freight when it, for example, enters an import distribution center (IDC) near the Port of Los
Angeles and then departs the IDC in domestic equipment for the Detroit BEA. Similarly, export cargo can
be shipped in domestic equipment to the international gateway port and then transloaded for shipment
overseas. These types of moves are captured as
domestic shipments and thus are included in the
domestic inbound and outbound data presented earlier.            Figure 2-12: Detroit BEA Import Truck
Additionally, the import and export data do not include                        Cargo in 2009
trade with Canada and Mexico, which are reviewed
separately in Sections 2.3.5 and 2.3.6 respectively.

The Detroit BEA had import cargo, excluding cross-
border trade with Canada and Mexico, of 5.0 million
tons in 2009 with a value of $12 billion. As shown in
Figure 2-12, this cargo is broken down into several
flows. The inbound flow of 1.4 million tons represents
imports, mainly of warehouse-able commodities, via
international cargo gateways to the Detroit BEA. The
top two gateways are New York (19 percent of tons)
and Los Angeles (16 percent of tons).
                                                                           Source: Derived from IHS Global Insight Transearch Data


7
    Internal refers to freight with its origin and destination within the Detroit BEA.


                                                        22 | TranSystems
Translinked Freight Study
                                                                                            Existing Freight Flows


The outbound flow of 1.0 million tons is import cargo arriving in the Detroit area from overseas and then
shipped to a final destination outside the Detroit BEA. The largest two commodities are Primary Metal
Products (53 percent of tons) and Clay, Concrete, Glass or Stone (29 percent). Final destinations are
primarily the regions surrounding the Detroit BEA. The internal flow, at 2.5 million tons, is cargo identified
as imports arriving in the Detroit BEA (for example, via the Great Lakes) that remain in the Detroit BEA.
The largest commodity in this segment is Nonmetallic Minerals (1.8 million tons).

Figure 2-13 shows the breakdown of export cargo by
                                                                    Figure 2-13: Detroit BEA Export Truck
direction. The Detroit BEA had total export cargo of
                                                                                 Cargo in 2009
5.4 million tons in 2009. The outbound flow of 2.2
million tons represents exports via international
gateways outside the Detroit BEA. The largest gateway
was Los Angeles (37 percent of tons) followed by
Toledo, OH (11 percent) and Houston, TX (8 percent).
The top three commodity groups were Chemicals or
Allied Products, Waste or Scrap Materials, and Farm
Products.

The inbound flow of 0.5 million tons captures exports
shipped from other parts of the country to the Detroit
BEA, and then exported overseas. Origins are
principally the areas around Detroit. Finally, the internal         Source: Derived from IHS Global Insight Transearch Data
flow captures exports originating within the Detroit
BEA and shipped overseas via the Detroit BEA. This
flow amounted to 2.5 million tons.

2.3.5 Canada
As a major border crossing point, the Detroit BEA has a significant volume of truck freight generated by
local and U.S. trade with Canada. In 2009, total volume was 34 million tons with a value of $98 billion.

As shown in Figure 2-14, the largest part this freight, 28
                                                                    Figure 2-14: Detroit BEA - Canada Truck
million tons or 83 percent, moved through the Detroit
                                                                                  Cargo in 2009
BEA to and from other parts of the U.S. This through
freight is dominated by warehouse-able cargo, including
shipments of Food or Kindred Products, Chemicals or
Allied Products, Transportation Equipment, Pulp, Paper
or Allied Products, Farm Products and Rubber or Misc
Plastics.

The inbound truck trade from Canada to the Detroit
BEA amounted to 3.4 million tons with a value of $9.4
billion. Locations in Ontario are the source for 89
percent of the inbound truck freight from Canada. The
top three commodity groups are Transportation
Equipment (32 percent of tons), Primary Metal Products              Source: Derived from IHS Global Insight Transearch Data
(19 percent), and Food or Kindred Products (7
percent).


                                                 23 | TranSystems
Translinked Freight Study
                                                                                          Existing Freight Flows


The outbound truck trade to Canada from the Detroit BEA was 2.4 million tons with a value of $7.9 billion.
Ontario dominates the outbound trade and was the destination for 95 percent of outbound tons. Major
commodity groups were Primary Metal Products (25 percent of tons), Transportation Equipment (25
percent), Farm Products (11 percent), and Chemicals or Allied Products (9 percent).

Finally, the source database provides estimates of freight flows by truck (and rail) between the Detroit BEA
and Canadian port hinterlands, including Halifax. These data are reviewed in Section 2.6 in a discussion of
freight flows along specific corridors.

2.3.6 Mexico
Truck trade with Mexico amounted to only 1.1 million tons with a value of $5.4 billion. This small amount of
truck freight, 42 percent of total trade volume with Mexico, reflects the preference for rail in the long-
distance corridor between the Detroit BEA and Mexico
and the likelihood that some Mexican trade flows
through import distribution centers in other parts of the       Figure 2-15: Detroit BEA - Mexico Truck
U.S. prior to arrival in the Detroit area, thus arriving in                    Cargo in 2009
Detroit as a domestic shipment.

As shown in Figure 2-15, inbound truck freight from
Mexico amounted to 0.56 million tons. This freight is
primarily higher-value commodities and the largest
commodity groups were Transportation Equipment (38
percent), Machinery (13 percent), and Electrical
Equipment (12 percent).

The outbound trade to Mexico was 0.49 million tons
and is dominated by Chemicals or Allied Products (50
percent), which includes plastics and synthetic fibers.
                                                                   Source: Derived from IHS Global Insight Transearch Data


                                                24 | TranSystems
Translinked Freight Study
                                                                                             Existing Freight Flows


2.4 Detroit BEA Rail Cargo
2.4.1 Total
Rail is predominant over longer distances and it was the transport mode for 18 percent of tons and 19
percent of cargo value moving in, out, within and through the Detroit BEA in 2009. This rail freight is
generated by local consumption and industrial production, and freight movements through the Detroit BEA
between other regions (e.g. Canada to other parts of the U.S.). Total rail freight amounted to 53 million
tons with a total value of $77 billion.

Rail involves a variety of trade flows and modes as shown in Figure 2-16. The largest segment by tonnage is
domestic inbound freight, which accounted for 42 percent of tons in 2009 but only 14 percent of total value,
due to the presence of low-value coal shipments, which account for 67 percent of the domestic inbound
tonnage. Canada rail shipments (by carload and intermodal) account for 17 percent of tons and 30 percent
of value, due to the presence of higher-value manufactured goods in this trade. Rail shipments through the
Detroit BEA between Canada and other U.S. regions dominate the Canada rail flows, accounting for 88
percent of tonnage. The third largest trade flow is domestic outbound shipments from the Detroit BEA,
accounting for 16 percent of tons and 33 percent of value, the larger share of value due to outbound
shipments of higher value commodities (e.g. Transportation Equipment). Rail shipments with Mexico are
another high value commodity trade, accounting for 3 percent of rail tons and 11 percent of rail cargo value.

Rail cargo involves different types of rail modes – carload, intermodal (that is, container or trailer on flatcar),
and rail (freight moving to and from Canada and Mexico). Lower value commodities dominate movements
by carload, which accounted for 57 percent of tons and 36 percent of value. Intermodal rail, with 4 percent
of tons and 14 percent of value, handles higher value commodities. Trade with Canada and Mexico is
classified under a generic rail mode. Intermodal rail has a presence in these trades due to the many higher
value commodities shipped.

                        Figure 2-16: Detroit BEA Rail Cargo by Trade Flow in 2009


                                Source: Derived from IHS Global Insight Transearch Data


                                                   25 | TranSystems
Translinked Freight Study
                                                                                           Existing Freight Flows


A profile of regional rail cargo (domestic and international, all directions) by commodity group is provided in
Figure 2-17. The largest commodity group is inbound shipments of Coal, which amounted to 15 million tons
in 2009 and 28 percent of the region’s rail cargo. The other top commodities are Chemicals and Allied
Products (13 percent of tons), Transportation Equipment (12 percent), Petroleum and Coal Products (8
percent), and Primary Metal Products (8 percent). Transportation Equipment is primarily Motor Vehicles
and Motor Vehicle Parts or Accessories. Agricultural and consumer related commodities, Food Products (5
percent) and Food or Kindred Products (4 percent) also appear in the top ten commodity groups.

The commodity ranking shifts when a filter is applied to identify the warehouse-able commodities, those
suited to warehousing and logistics services (see background discussion in Section 2.2). The total amount of
warehouse-able rail cargo is estimated at 21 million tons, dominated by Chemicals and Allied Products (32
percent of warehouse-able tons) and Transportation Equipment (30 percent). Examples of commodities in
the Chemicals and Allied Products group are Plastic Materials and Synthetic Fibers, Soap or Other
Detergents, and Dyes.

Further analysis of commodities, with a focus on the warehouse-able segment, is provided in the discussion
of domestic and international rail flows by direction (inbound, outbound, etc.) presented below. A review of
intermodal rail corridors is provided in Section 2.6.3.


              Figure 2-17: Detroit BEA Rail Cargo in 2009 – Top Ten Commodity Groups


                              Source: Derived from IHS Global Insight Transearch Data


                                                  26 | TranSystems
Translinked Freight Study
                                                                                                   Existing Freight Flows


2.4.2 Domestic Inbound and Outbound
Domestic inbound and outbound flows together account for 58 percent of rail cargo tons related to the
Detroit BEA. This cargo is generated by industry and consumption within the Detroit BEA, and demand in
the rest of the country.

In 2009, the Detroit BEA had inbound rail cargo of 22 million tons with an estimated value of $11 billion.
Approximately 15 million tons (65 percent) with a value of $486 million (5 percent) was inbound shipments
of coal. Warehouse-able rail cargo amounted to 3.2 million tons with a value of $8 billion (77 percent). As
shown in Figure 2-18, the top-15 rail commodities shipped inbound to the Detroit BEA are a mixture of
warehouse-able and other commodities. Four of the five top commodities are lower value and bulk-focused
commodities, and these are nearly all shipped by carload service. Carload service moved 78 percent of the
warehouse-able commodities, including shipments of transportation equipment (e.g., Motor Vehicles in
specialized auto railcars). The remaining 22 percent of the warehouse-able commodities (e.g. Motor Vehicle
Parts or Accessories) move by intermodal service (that is, container or trailer on flatcar).

The Detroit BEA generated 8 million tons of outbound cargo with a value of $25 billion in 2009. An
estimated 3.8 million tons (46 percent) with a value of $23.7 billion (94 percent) was defined as warehouse-
able cargo. The top outbound commodity group was Transportation Equipment (58 percent of outbound
tons), which moved by carload service and intermodal rail service. The two other main warehouse-able
commodities were Miscellaneous Mixed Shipments by intermodal rail and Food or Kindred Products, nearly
all shipped by carload service.


        Figure 2-18: Detroit BEA Inbound and Outbound Rail Cargo in 2009 – Top 15 Commodity
                                               Groups


                             * The chart excludes coal shipments, which amount to 14.6 million tons.
                                    Source: Derived from IHS Global Insight Transearch Data


                                                     27 | TranSystems
Translinked Freight Study
                                                                                              Existing Freight Flows


Apart from coal and iron ore related shipments, rail freight is widely dispersed across origin and destination
regions (Figure 2-19). The top four lanes involve inbound coal shipments from Wyoming, West Virginia and
Kentucky and mainly inbound iron ore shipments from the Cincinnati, OH BEA. Outside of these top four
lanes, rail freight is widely dispersed by origin and destination. Some of the larger lanes include BEAs
centered on ports and distribution hubs – for example, Chicago, New York, and Kansas City.

The distribution by lane shifts when focusing on the warehouse-able commodity segment, with port and
logistics hub related BEAs, as well as large population centers, more prominent. The mix of origins reflects
inbound shipments related to local industry, notably the automotive sector, and for local consumption.
Similarly, the outbound destinations are partly driven by shipments by the automotive sector, both of
finished vehicles and components.


        Figure 2-19: Detroit BEA Inbound and Outbound Rail Cargo in 2009 – Top Freight Lanes


                                 Source: Derived from IHS Global Insight Transearch Data


                                                   28 | TranSystems
Translinked Freight Study
                                                Existing Freight Flows


Figure 2-20: Domestic Inbound Rail Freight


              29 | TranSystems
Translinked Freight Study
                                                 Existing Freight Flows


Figure 2-21: Domestic Outbound Rail Freight


               30 | TranSystems
Translinked Freight Study
                                                                                           Existing Freight Flows


2.4.3 Domestic Internal and Through
Only a small volume of rail cargo is reported as moving internally within the Detroit BEA. The total volume
was 215,000 tons, including Petroleum or Coal Products (45 percent of tons), Transportation Equipment
(13 percent), Chemicals or Allied Products (13 percent), and Clay, Concrete, Glass or Stone (11 percent).
There was no domestic through rail cargo reported in the database.

2.4.4 Imports and Exports (excl. NAFTA)
Rail import cargo (excluding cross-border from Canada
and Mexico) amounted to 0.7 million tons in 2009 with
a value of $1.3 billion. As presented in Figure 2-22, the            Figure 2-22: Detroit BEA Import Rail
                                                                                 Cargo in 2009
cargo is reasonably balanced between inbound and
outbound flows. The principal difference is in the
commodity mix, with the inbound direction largely
made up of warehouse-able cargo. The top inbound
origins for this warehouse-able freight are coastal BEAs,
including Los Angeles (22 percent), New York (15
percent), Norfolk (13 percent), Seattle (11 percent),
and Houston (8 percent).

The outbound flow represents import cargo arriving in
the Detroit BEA from overseas (e.g. via the Great
Lakes) and then railed to other markets in the U.S. The
three main commodity groups are Nonmetallic
Minerals, Clay, Concrete, Glass or Stone, and Primary              Source: Derived from IHS Global Insight Transearch Data
Metal Products. Destination BEAs are mainly in
neighboring states, including Chicago (35 percent),
Columbus (14 percent) and Dayton (7 percent).

Overseas rail export cargo (excluding cross-border with              Figure 2-23: Detroit BEA Export Rail
Canada and Mexico) amounted to 0.9 million tons with                            Cargo in 2009
a value of $1.3 billion. As shown in Figure 2-23, the
majority of export rail cargo involves other than
warehouse-able commodities. The outbound flow,
exports from the Detroit BEA, mainly moves to port-
related BEAs, including Norfolk (18 percent), New
Orleans (17 percent), New York (14 percent), Los
Angeles (11 percent) and Jacksonville (8 percent). The
main commodity groups are Farm Products, Waste or
Scrap Materials, Misc Mixed Shipments, and
Transportation Equipment.

The inbound direction is export cargo from other BEAs
transported by rail to the Detroit BEA and then shipped
overseas. The main commodity groups are Coal,                      Source: Derived from IHS Global Insight Transearch Data
Petroleum or Coal Products, and Chemicals or Allied
Products. The main origin BEAs are Pittsburgh,
Wheeling, and Columbus.


                                                31 | TranSystems
Translinked Freight Study
                                                                                          Existing Freight Flows


2.4.5 Canada
Canada rail cargo amounted to 19 million tons with a value of $30 billion, Similar to Canada truck freight,
the principal rail flow is freight moving through the Detroit BEA between Canada and other regions of the
U.S.

Through rail cargo was 17 million tons (Figure 2-24) and
61 percent of this volume was moving southbound from              Figure 2-24: Detroit BEA - Canada Rail
Canada and 39 percent northbound to Canada. Nearly                             Cargo in 2009
90 percent of cargo originated in or was destination for
Ontario and Quebec. Major U.S. origin BEAs for
northbound through cargo were Houston, Chicago, Des
Moines, St. Louis, and Macon; while top U.S. destination
BEAs for southbound through cargo were Chicago, Los
Angeles, Houston, Grand Rapids, and Memphis. Major
commodities moving northbound are Chemicals or
Allied Products, Food or Kindred Products, Petroleum
or Coal Products, Farm Products, Clay, Concrete, Glass
or Stone, and Transportation Equipment. In the
southbound direction from Canada, the main
commodities are Chemicals or Allied Products, Primary
Metal Products, Pulp, Paper or Allied Products,
Petroleum or Coal Products, and Transportation                    Source: Derived from IHS Global Insight Transearch Data
Equipment.

The inbound rail trade from Canada to the Detroit BEA was 2 million tons with a value of $8.1 billion. The
three main Canadian origins were Ontario (63 percent), Quebec (13 percent) and British Columbia (8
percent). Nova Scotia, which includes the Port of Halifax, was the origin for one percent of the inbound rail
cargo. Leading commodity groups were Transportation Equipment (50 percent), Primary Metal Products (15
percent), Lumber or Wood Products (12 percent) and Chemicals or Allied Products (10 percent).

Outbound rail freight to Canada from the Detroit BEA was 0.4 million tons with a value of $1.6 billion.
Nearly 84 percent of the tons were shipped to Ontario and Quebec, and the main commodities were
Transportation Equipment (45 percent), Farm Products (15 percent), Chemicals or Allied Products (14
percent), and Petroleum or Coal Products (10 percent).


                                               32 | TranSystems
Translinked Freight Study
                                                                                             Existing Freight Flows


2.4.6 Mexico
Rail freight with Mexico amounted to 1.5 million tons
with a value of $8.5 billion. The inbound direction from              Figure 2-25: Detroit BEA - Mexico Rail
Mexico is the largest flow (Figure 2-25), with 1.07                                Cargo in 2009
million tons, and nearly all this cargo is classified as
warehouse-able. The inbound trade is driven by the
automotive industry and the major commodity groups
are Transportation Equipment (91 percent), Machinery
(2 percent) and Fabricated Metal Products (2 percent).

Outbound freight shipments by rail amounted to 0.45
million tons and, similar to the inbound, has a significant
component driven by the automotive industry. The
main commodity groups are Chemicals or Allied
Products (55 percent), Transportation Equipment (23
percent), and Farm Products (7 percent).


                                                                     Source: Derived from IHS Global Insight Transearch Data


2.5 Other Transport Modes
The Detroit BEA also handles freight by air and water. Total air freight was 83,000 tons in 2009 and valued
at $1.45 billion. The largest flow was outbound, accounting for 74 percent of cargo tons.

Freight moving by water amounted to 26.6 million tons with a total value of $1.68 billion tons. Its value per
ton was only $63 compared to $17,445 for air freight, $1,616 for truck and $1,456 for rail, due to the much
lower value bulk commodities shipped by water. The largest flow was inbound with 24.5 million tons and
the three main inbound commodities were Iron Ore (44 percent), Coal (34 percent) and Broken Stones or
Riprap (19 percent). The outbound flow was 1.1 million tons and involves a variety of mainly bulk
commodities. Finally, there was an additional 0.9 million tons of internal waterborne cargo.

2.6 Corridor Specific Flows
The discussion of Detroit BEA cargo flows presented above primarily focused on the composition of freight
by trade, direction, commodity type and mode of transport. The freight flow data also allows a review of
specific freight corridors to understand characteristics specific to those lanes. Section 2.6 addresses several
corridors of interest to the evaluation of logistics opportunities in the Detroit region.

2.6.1 Halifax Freight Flows
The Port of Halifax is the first deep-water container port on the Eastern seaboard of North America for
ships arriving from Europe and the Mediterranean, and from Asia via the Suez Canal. With a small
population in its hinterland, the port specifically targets containerized cargo moving to and from inland
regions of Canada and the U.S. Midwest, including the Detroit area. The Port is connected by CN rail
service to these markets. The Port had total throughput of 425,461 TEU in 2010 compared to the recession
impacted 344,811 TEU of 2009, but still below the high of 550,462 TEU seen in 2005. The following
discussion provides a profile of freight flows moving between the Halifax area and the Detroit BEA that
were identified in the IHS Global insight database.


                                                  33 | TranSystems
Translinked Freight Study
                                                                                            Existing Freight Flows


A total of 386,000 tons were identified as originating in
                                                                    Figure 2-26: Detroit BEA – Cargo Flows
the Halifax area (defined as the Halifax CMA8 and non-                   from the Halifax Area in 2009
CMA Nova Scotia), of which 356,000 tons passed
through the Detroit BEA to other regions and only
32,000 tons was inbound to the Detroit BEA (Figure
2-26. This broad regional view is assumed to capture
Nova Scotia origin freight shipped to the Detroit area
and other parts of the U.S., and imports through the
Port of Halifax.

Close to 100 percent of the cargo is defined as
warehouse-able, while 60 percent of the freight moved
by rail and 40 percent by truck. The largest commodity
groups are Pulp, Paper or Allied Products (55 percent of
total tons), Rubber or Misc Plastics (24 percent),
Lumber or Wood Products (7 percent), and Chemicals
or Allied Products (5 percent).                                     Source: Derived from IHS Global Insight Transearch Data


Forest products are most likely sourced from Nova
Scotia. The most likely containerized import commodities are: Rubber or Misc Plastics, Chemicals or Allied
Products; Food or Kindred Products; Transportation Equipment, Machinery, Furniture or Fixtures, Textile
Mill Products, Apparel and Related Products, and Electrical Equipment. The total volume of these
commodities in 2009 was 125,000 tons or 32 percent of the total. Assuming 10 tons per TEU, these
commodities generated the equivalent of 12,500 TEU of containerized import cargo bound for or through
the Detroit BEA from Halifax. Of this total, an estimated 15,800 tons or 1,580 TEU was inbound freight into
the Detroit BEA, and the balance through freight to other parts of the U.S. Ten U.S. states were the
destinations for 80 percent of freight from the Halifax area flowing through the Detroit BEA: Wisconsin,
Illinois, Kentucky, South Carolina, Tennessee, Ohio, Indiana, Texas, Mississippi, and Missouri. The above
analysis is based on 2009 data and volumes will have grown in 2010 based on the 26 percent growth of total
container throughput at Halifax in 2010.

Only 20,000 tons of cargo was identified as flowing through or from the Detroit BEA to the Halifax area,
and 99 percent of this freight was through cargo. Rail was the dominant mode with an 88 percent share and
76 percent of the freight was classified as warehouse-able. The three largest commodity groups were
Chemicals or Allied Products (47 percent), Food or Kindred Products (18 percent), and Primary Metal
Products (12 percent). The four largest origins in the U.S. were Chicago, Huntsville, AL, Cleveland, and
Minneapolis, which together accounted for 46 percent of the cargo tons.

2.6.2 Montreal Freight Flows
The Port of Montreal is an important gateway for containerized trade, notably with North Europe and the
Mediterranean, and the Port is connected by CN and CP rail service to U.S. markets. Montreal had total
throughput of 1.33 million TEU in 2010 compared to 1.25 million TEU in 2009, and 1.47 million TEU in
2008. The following discussion provides a profile of freight flows moving between the Montreal CMA and
the Detroit BEA that were identified in the IHS Global insight database.


8
    CMA – Census Metropolitan Area


                                                 34 | TranSystems
Translinked Freight Study
                                                                                           Existing Freight Flows


A total of 1.67 million tons of cargo flowed to and from
                                                                       Figure 2-27: Detroit BEA – Cargo Flows
the Montreal CMA in 2009, the principal flows                              with the Montreal CMA in 2009
southbound and northbound through the Detroit BEA
(Figure 2-27). Rail is the principal transport mode with a
61 percent share of the total volume. A portion of the
freight is believed to be international containerized
import and export trade handled by the Port of
Montreal.

A total 1.2 million tons were identified as originating
from the Montreal CMA, of which 1.1 million tons
passed through the Detroit BEA and only 87,000 tons
was destined for the Detroit BEA. Warehouse-able
cargo accounted for 63 percent of the through cargo
and 72 percent of the inbound cargo. The commodity
mix in the trade from Montreal through the Detroit
BEA is focused on Primary Metal Products, Pulp, Paper         Source: Derived from IHS Global Insight Transearch Data
or Allied Products (23 percent), Chemicals or Allied
Products (21 percent), Waste or Scrap Materials (17
percent), and Food or Kindred Products (8 percent). Trade inbound to the Detroit BEA is dominated by
Primary Metal Products (28 percent), Pulp, Paper or Allied Products (24 percent), and Food or Kindred
Products (11 percent).

The northbound flows were smaller than the southbound, amounting to 0.5 million tons. Total cargo flowing
through the Detroit BEA to the Montreal CMA was 0.47 million tons, while only 26,000 tons originated in
the Detroit BEA. Warehouse-able cargo made up 57 percent of the through cargo and only 17 percent of
the outbound cargo. The major commodities in northbound trade through the Detroit BEA to the Montreal
area were Food or Kindred Products (24 percent), Farm Products (16 percent), Clay, Concrete, Glass or
Stone (10 percent), Petroleum or Coal Products (9 percent), and Chemicals or Allied Products (9 percent).
Commodities flowing outbound from the Detroit BEA to the Montreal CMA were Farm Products (67
percent), Waste or Scrap Materials (11 percent), and Chemicals or Allied Products (11 percent).

2.6.3 U.S. Intermodal Rail Corridors
Nearly 2.0 million tons of cargo was identified as moving in intermodal rail corridors to and from the
Detroit BEA. The top-10 intermodal lanes by origin and destination are shown in Figure 2-28. The data is
broken into domestic freight and international freight, which moves intact between coastal ports and
Detroit. However, the domestic freight also includes some international cargo, which has been transloaded
at the import or export port, into or from domestic equipment. In particular, a substantial portion of the
intermodal freight labeled as domestic from Los Angeles and other port BEAs (e.g. New York, VA) is
containerized imports that are transloaded from marine containers at import distribution centers (IDCs)
into domestic 48- and 53-foot containers.

Turning to the inbound flows, the top three origins are the port BEAs of Los Angeles, New York and
Seattle. The largest commodity group flowing in these lanes is Miscellaneous Mixed Shipments, which
captures import merchandise moving in domestic equipment. This commodity group accounted for 98
percent of the intermodal freight from Los Angeles, 74 percent from New York and 99 percent from
Seattle. Other port BEAs are Norfolk and Jacksonville, and Miscellaneous Mixed Shipments accounted for 94
percent and 84 percent of cargo tons respectively. Transportation Equipment is the principal commodity


                                                    35 | TranSystems
Translinked Freight Study
                                                                                             Existing Freight Flows


flowing in other inbound intermodal lanes – 90 percent from Kansas City, 91 percent from San Antonio, 64
percent from Dallas, 45 percent from Atlanta, and 52 percent from St. Louis.

The top outbound lanes are also dominated by coastal BEAs – New York, Los Angeles, Norfolk and
Jacksonville. Miscellaneous Mixed Shipments is the dominant commodity flowing in these lanes – 84 percent
New York, 77 percent Los Angeles, 83 percent Norfolk, and Jacksonville 95 percent. The outbound
domestic lane to Kansas City is nearly all Transportation Equipment (94 percent). Other lanes have a
mixture of Transportation Equipment and Miscellaneous Mixed Shipments.

          Figure 2-28: Detroit BEA - Top-10 U.S. Intermodal Rail Lanes by Cargo Tons in 2009


                                Source: Derived from IHS Global Insight Transearch Data


                                                 36 | TranSystems
Translinked Freight Study
                                                                                              Existing Freight Flows


3 TOLEDO AND WINDSOR FREIGHT FLOWS
3.1 Toledo, Ohio
Toledo is located in northwest Ohio on the Maumee
                                                                              Figure 3-1: Port of Toledo Cargo
River, at the southern end of Maumee Bay. The primary
freight flows are related to activity at the Port of
Toledo, which handles domestic and international
freight moving by vessel, and is linked to overseas
markets by the Great Lakes and St. Lawrence Seaway
System.

The Port’s total throughput was 10.0 million tons in
2009 and 10.9 million tons in 2010 (Figure 3-1), both
years lower than the 12.3 million tons achieved in 2007.
The largest flows are shipments with other U.S. ports
(36 percent of tons in 2010) and shipments with Canada
(58 percent of tons). International cargo accounted for
6 percent of total tons in 2010.

The commodity mix is focused on lower value dry bulk                                   Source: Port of Toledo
commodities – coal, iron ore, grain and other dry bulk
commodities – which accounted for 99 percent of total
tons in 2010. The principal outbound commodities are                      Figure 3-2: Port of Toledo Commodity Mix
coal and grain (mainly corn and soybeans), and the main
inbound commodities are iron ore, crude materials (e.g.
limestone) and grain (mainly wheat and oats).9 General
cargo accounted for 0.3 percent of total tons in 2010.

The Port handles project cargo for the surrounding
region. For example, in mid-2010, the Port handled five
new wide-span cranes on route to the new CSX
Northwest Ohio Intermodal Terminal at North
Baltimore, Ohio, 40 miles south of Toledo.

As a primarily bulk cargo port, transportation activity
has a significant rail component. For example, inbound
iron ore is railed from the port to steel mills, while coal
for export is railed into the port.

The Port of Toledo handles freight for the Detroit BEA                     Source: Port of Toledo
reviewed in Section 3. In 2009, based on the IHS Global
Insight data, 4.9 million tons of cargo was shipped from
the Detroit BEA to the Toledo BEA, and this total included 0.25 million tons of identified export cargo,
which would have been shipped via the Port of Toledo. In the same year, 10.8 million tons were shipped


9   Major commodities by direction based on Waterborne Commerce Statistics from the U.S. Army Corps of Engineers.


                                                       37 | TranSystems
Translinked Freight Study
                                                                                                    Existing Freight Flows


from the Toledo BEA to the Detroit BEA, including 0.17 million tons of identified import cargo. Both export
and import cargo comprised lower value bulk commodities.

The Port has looked to the container market for possible future growth, as a load and discharge point for
future feeder services connecting to Canada’s East Coast container ports. However, there are many
challenges related to providing container feeder service to and from the Great Lakes, lock navigation and
total transit time, a constrained shipping season, and competition from intermodal rail service. In early 2010,
the Port took delivery of two new mobile harbor cranes capable of handling a variety of cargo types,
including containers if a short sea service develops in the future. Funding for the purchase of the cranes
came from American Recovery and Reinvestment Act resources, administered by the Ohio Department of
Transportation.

In 2009, 15.0 million tons of domestic freight moved                  Figure 3-3: Detroit BEA Domestic Freight
between the Detroit BEA and the Toledo BEA, 10.4                            Flows with Toledo BEA, 2009
million tons inbound from the Detroit BEA and 4.6
million tons outbound from the Detroit BEA. Truck
is the dominant mode accounting for 92 percent of
inbound freight and 96 percent of outbound freight.

The top five inbound commodities from the Toledo
BEA are Nonmetallic Minerals (40 percent),
Petroleum or Coal Products (14 percent), Farm
Products (12 percent), Clay, Concrete, Glass or
Stone (10 percent), and Food or Kindred Products
(6 percent). The top five outbound commodities
shipped to the Toledo BEA are Nonmetallic Minerals
Farm Products (44 percent), Petroleum or Coal
Products (17 percent), Chemicals or Allied Products
(6 percent), and Food or Kindred Products (6
                                                                          Source: Derived from IHS Global Insight Transearch Data
percent).

3.2 Windsor, Ontario
The Windsor area has a diversified economy with a strong presence in the automotive sector, agriculture,
and food products, and emerging sectors that include high tech manufacturing. Evaluation of Windsor freight
flows focuses on the Windsor Census Metropolitan Area (CMA), identified in the IHS Global Insight
database. The Windsor CMA is made up of the Canadian census subdivisions of Windsor, LaSalle,
Tecumseh, Amherstburg, and Lakeshore, and it had a total estimated population of 331,000 in 2010.10

A total of 1.4 million tons of freight was identified as related to the Windsor CMA (Figure 3-4). This total
covers freight to and from the Detroit BEA, and between the Windsor CMA and other regions of the U.S. It
excludes freight to and from other regions of Canada, and cross-border freight passing through the Windsor
CMA.

Truck is the dominant mode of transport, accounting for 88 percent of freight shipped to the Windsor CMA
and 72 percent of the tons shipped from the Windsor CMA. The respective shares for rail were 5 percent
and 28 percent.

10   Annual Demographic Estimates: Subprovincial Areas 2005 to 2010, Statistics Canada


                                                       38 | TranSystems
Translinked Freight Study
                                                                                          Existing Freight Flows


The freight flows from the Windsor BEA to the
Detroit BEA and other parts of the U.S. are primarily             Figure 3-4: Windsor, Ontario CMA Freight
warehouse-able commodities related to the                                       Flows in 2009
automotive sector. Transportation Equipment
accounted for 91 percent of freight shipped to the
Detroit BEA and 72 percent of freight shipped to the
rest of the U.S.

Warehouse-able commodities accounted for a
smaller share of freight flowing to the Windsor BEA,
26 percent of tons from the Detroit BEA and 59
percent of tons from the rest of the U.S.

Some additional perspective on freight activity in the
southwest region of Ontario is provided by data for
the London CMA, which is located approximately
116 miles northeast of Windsor and 67 miles east of
the Port Huron/Sarnia border crossing. The London            Source: Derived from IHS Global Insight Transearch Data
CMA had an estimated population of 492,000 in
2010, nearly 50 percent more than the Windsor
CMA, and has a similar industry profile with a strong presence in the automotive industry and agriculture
related food and food processing.

A total of 0.4 million tons of freight was identified as
                                                                   Figure 3-5: London, Ontario CMA Freight
related to the London CMA (Figure 3-5). This total
                                                                                 Flows in 2009
covers freight to and from the Detroit BEA, and to
and from other regions of the U.S. It excludes freight
to and from other regions of Canada, and cross-
border freight passing through the London CMA.

Truck is the dominant mode of transport, accounting
for 87 percent of freight shipped to the London
CMA and 70 percent of the tons shipped from the
London CMA. The respective shares for rail are 13
percent and 30 percent.

The freight flows are primarily warehouse-able
commodities. Transportation equipment accounts
for 49 percent of tons shipped to the Detroit BEA
and 17 percent of freight shipped to the rest of the
U.S. Food or Kindred Products is the largest            Source: Derived from IHS Global Insight Transearch Data
commodity shipped to the rest of the U.S.,
accounting for 29 percent of freight. Other major
commodities in freight flows between London CMA and the U.S. are Primary Metal Products, Chemicals or
Allied Products, and Farm Products.


                                                    39 | TranSystems
Translinked Freight Study
                                                                                                Industry Trend Analysis


4 INDUSTRY TREND ANALYSIS
4.1 Existing Transportation Infrastructure and Location Selection Factors
Logistics managers are continuously evaluating their logistics networks to squeeze excess transportation
expenses and other costs out of their supply chains. The availability of all transportation modes is essential
in order to enable logistics managers to have the flexibility to choose the mode that best suits shipment
needs. Lowest-cost transportation options, such as rail, are selected provided that service is available, and
transit time and reliability meet service level requirements. Trucking costs are the largest portion of the
supply chain expense. Because of this, supply chain strategies that reduce trucking as much as possible have
been a major goal of supply chain managers. Warehouse locations are chosen based on the cost of the
facility, and their proximity to customers and suppliers, thereby reducing trucking costs. Labor, green
initiatives, government incentives, etc. are considered after transportation service and rate level
requirements are met, and these considerations typically influence a specific site location among competing
sites that meet transportation requirements. The following sections evaluate how the Translinked region
(represented by Detroit) meets these selection factors.

4.1.1 Logistics and Transportation Infrastructure Summary
Transportation infrastructure serving the region features advantageous access to the Michigan Peninsula, the
Canadian border, and access to U.S. Midwest markets. Air, rail, truck, and warehousing services and access,
which are key factors for flexible and responsive supply chains, are well established as a result of their
support of the automotive industry. Table 4-1 summarizes logistics features, which will be discussed further
in this section.


                                        Table 4-1: Detroit Logistics Summary
      Infrastructure                    Description
                                        CSX – U.S. East, Midwest, main Western States Access
      Rail                              NS – U.S. East, Midwest access
                                        CN and CP - Canada Rail Markets, US Central Plain States, Gulf
                                        US-69 to Blue Water Bridge to CA-402, US 75,
      Highways                          US 375/CA-401 via Ambassador Bridge
                                        US-96, US-94, US-275 (to US-80)
      Key Ocean Gateways                Halifax, Montreal, Other Canadian and U.S. ports
                                        U.S. Rank 27th
      Airport
                                        Total Cargo 193,344 metric tons
                                        Total Space (sq. ft.) 366.8 - 524.0 million
                                        Vacancy Rate 13.5% - 14.9%
      Distribution Facilities           Average Lease Rate ($/sq. ft./yr) $3.87 – $3.93
                                        Detroit Transportation and Materials Moving Occupation (Hourly) $17.24
                                        US Transportation and Materials Moving Occupation (Hourly) $15.70
      Distribution Area Advantage       Ontario, Canada, Michigan Peninsula, OH, IN, WI, IL

                   Source: TranSystems, CB Richard Ellis, Grubb and Ellis, Colliers, Bureau of Labor Statistics


                                                        40 | TranSystems
Translinked Freight Study
                                                                                   Industry Trend Analysis


4.1.2 Rail
North America Class 1 railroads have been investing in programs to improve the speed and reliability of the
railroads, including rail infrastructure, and rail personnel staffing issues since the mid-1990s. The result has
been improved rail service. Rail rates are on the rise, but remain the lower cost option as compared to
trucking. Improved rail reliability and speed, mixed with uncertainty about truck rates and truck capacity
availability, have caused North American logistics managers to develop strategies to divert as much truck
volume as possible to rail.

There are currently seven Class I railroads operating in the U.S. U.S. railroads are generally divided into
Western and Eastern rail service areas, that connect to provide trans-continental service at key locations,
such as North Baltimore, OH, Columbus, OH, Chicago, IL, Kansas City, MO, St. Louis, MO, Memphis, TN,
and New Orleans, LA. The two Western railroads, The Union Pacific (UP) and Burlington Northern Santa
Fe (BNSF) serve states west of the Mississippi River. The CSX and Norfolk Southern (NS) railroads operate
in the eastern half of the U.S. The two Canadian railroads, the Canadian National (CN) and the Canadian
Pacific (CP), have rail networks extending across Canada, and down through the U.S. Midwest, as far south
as New Orleans. The Kansas City Southern Railroad (KCS) operates primarily in the U.S. Central Plains
States and Mexico. Interchanges between the railroads add a degree of complexity in terms of adding transit
time or negotiating rates; however, railroads do make efforts to streamline connections, especially in high
volume corridors, such as Los Angeles/Long Beach to New York. No single railroad has the ability to rail
freight from one US coast to the other without handing-off to another railroad.

Both NS and CSX have recently improved rail service to and from the Midwest, and Western Markets.
CSX’s National Gateway Project includes a new terminal in North Baltimore, OH, and is aimed at improving
their connection to West Coast markets. NS’s Crescent Corridor improves rail service from the South to
the Northeast. Another NS network enhancement, the Heartland Corridor, improves service from the port
of Norfolk, VA to Columbus, OH. Figure 4-1 maps the Class 1 Railroad network in North America.


                                                 41 | TranSystems
Translinked Freight Study
                                                         Industry Trend Analysis


Figure 4-1: Class I Railroad Map with Container Ports


                   42 | TranSystems
Translinked Freight Study
                                                                                      Industry Trend Analysis


Four Class 1 Railroads, CSX, NS, CP and CN, provide container-on-rail service, called intermodal serve the
Translinked region. Intermodal service availability in Detroit (the main intermodal hub in the region) is
essential if international freight opportunities are to be considered, as virtually all international retail trade is
transported in cargo containers. Detroit cargo does not have to interchange railroads to Canadian, or U.S.
Eastern or Southern locations. Freight from the East Coast to Detroit would switch to northbound tracks in
terminals in Ohio, but does not require a transfer to another railroad. Rail freight between Detroit and
Western states does require a transfer to a connecting railroad. Cargo originating in Detroit and destined
for Los Angeles for example might load at Detroit on the CSX railroad, transfer at North Baltimore, OH to
the UP Railroad for the journey to Los Angeles. Rail access in Detroit is desirable, because it supports
logistics mangers’ strategies to use the rail mode whenever possible.

4.1.3 Highways
Regional highway access is similar to major US areas of similar size, with additional advantages of border
access to Canada via CA-401 and CA-403. North/South access is provided by US-75, with East/West
transcontinental truck traffic accommodated by US-69, and US-80 to the south. A key feature of the region’s
highway network is the Canadian border crossing, where Michigan ranked first as the leading US truck
border crossing in 2010. Figure 4-2 maps major highways serving the Translinked region.


                                       Figure 4-2: Regional Highway Map


                                                Source: TranSystems


                                                   43 | TranSystems
Translinked Freight Study
                                                                                          Industry Trend Analysis


Figure 4-3 displays annual truck traffic (inbound and
outbound) for the three Detroit border crossings from
                                                                           Figure 4-3: Detroit Truck Border
2006 through 2010. After a sharp rise in truck traffic
                                                                                       Crossings
starting in 2006, truck crossings peaked in 2008, at 4.5
million truck crossings. Truck traffic fell in 2009, to
under 3.5 million transits, but climbed to nearly 4.0
million trips in 2010. The Ambassador Bridge handled
nearly half of all truck traffic crossing the U.S. Border at
Detroit.

Additional U.S. security measures put in place over the
past decade have created extra steps for trucking
providers and shippers, resulting in delays in border
crossing times. Recent improvements in border wait
times have been attributed to the economic downturn,
but are expected to lengthen as the economy improves.
As of October, 2011, adding capacity to the existing
Ambassador Bridge is planned to address future traffic
concerns.

4.1.4 Ocean Gateways
For purposes of this report, an ocean gateway is defined               Source: Public Border Operators Association

as a major port area handling containerized cargo
volume. The top three ocean gateways in North
America are Los Angeles/Long Beach, CA, New York, NY, and Savannah, GA. The gateway used is
important, because it affects the overall transit time or cost of a shipment. Ideally, the gateway that balances
transit time requirement and lowest overall transportation costs, called “total landed costs”11 is preferred.
Another gateway consideration is port diversification. In response to disruptions that began on the U.S.
West Coast starting in the late 1990’s, such as West Coast port congestion, labor lock outs and inland rail
congestion, logistics managers allocated shipments over several gateways, including East Coast gateways,
using Panama Canal “all water” services. This practice reduced the dependence on a single port. Prior to
2000, shipments from Asia to the region typically entered the U.S. via Los Angeles/Long Beach, and were
then transported inland. Today, this shipment might just as likely enter the U.S. via another gateway (e.g.
New York) and either railed or trucked to the region.

The trade-off between lowest total landed cost and transit time is most influenced by the value of the cargo
being carried. Sophisticated supply chain managers consider the inventory carrying cost component of total
landed costs of gateways that add days to the overall transit. High value cargo’s inventory carrying costs are
more sensitive to additional transit days, and therefore require the fastest transits, while lower value goods
are able to tolerate slower transits at generally lower rates. High value cargoes are goods such as
electronics or auto parts, while lower value goods are items such as forest products.


11
  Total Landed Cost is the total of all expenses associated with the shipment from the point of origin to its final
destination. Expenses included in the total landed cost calculation include, but are not limited to the product
purchasing price, ocean freight rates, rail and trucking costs, customs duties, and inventory carrying costs.


                                                     44 | TranSystems
Translinked Freight Study
                                                                                               Industry Trend Analysis


The Translinked region has access to all of the
North America gateways, but two are                       Table 4-2: West Coast Transit Time Comparison
important as they provide a transit time                        (Transit Days): Shanghai to Detroit
advantage over other key North American                   Port Gateway              Ocean       Inland       Total        Prince
ports. The Canadian ports of Prince Rupert and                                                   Rail       Transit*      Rupert
Halifax are situated in geographically                                                                                     Delta
advantageous positions that shorten ocean and             Prince Rupert               11.0        5.6          16.6             -
inland transits. Table 4-2 and Table 4-3
                                                          Seattle                     12.0        5.8          17.8            1.2
compare total transit times from key origins to
Detroit (representing the Translinked region)             Los Angeles                 13.3        6.0          19.3            2.7
by selected North American West and East                            * Based on website schedules, actual transits may vary
Coast gateways. Shipments over Prince Rupert                            Source: CN, BNSF and NS Railroad Websites
from Shanghai beat competing West Coast
ports by 1 to 2 days, and the Halifax gateway             Table 4-3: East Coast Transit Time Comparison
transit to Detroit is faster from Rotterdam by             (Transit Days): Hong Kong and Rotterdam to
an estimated 3.1 days over its regional                                       Detroit
competitor, Montreal. According to the Port of                                                                            Prince
                                                                                                 Inland       Total
Halifax, more congested ports, such as New                Port Gateway               Ocean                                Rupert
                                                                                                  Rail       Transit
York and Montreal add time to the overall                                                                                  Delta
transit due to additional container “dwell time”,         From Hong Kong
which is the time containers sit idle in port
                                                          Halifax                       25         5.2         30.2             -
awaiting an interchange to truck or rail services.
In addition to having the fastest transits, service       New York                      25         7.0         32.0            -1.8
from Prince Rupert is entirely on the CN                  Montreal*                     28         4.3         32.3            -2.1
Railroad, while service to Detroit from other             From Rotterdam
U.S. West Coast ports requires a railroad
interchange. A single service rail provider is            Halifax                        7         5.2         12.2             -
considered to be less cumbersome to use, but              New York                      11         7.0         18.0            -5.8
does raise concerns from some shippers who                Montreal                      11         4.3         15.3            -3.1
require redundancy in their supply chains. From
                                                                    * Montreal transits based on Halifax transit plus 3 days
the lowest total landed cost perspective, high
                                                                                Source: Halifax Port Authority
value commodities that are suited to rail in
particular may favor the Canadian gateways.

4.1.5 Airports
A leading regional intermodal cargo hub must have air cargo services to accommodate time sensitive
shipments as part of an overall supply chain strategy. Detroit Metro Airport, handling 193,344 metric tons
of cargo in 2010, ranked 27th in a list of North America’s busiest cargo airports12. UPS and FedEx are the
only two regularly scheduled cargo airlines servicing the Detroit airport. International cargo services are
also provided by “belly cargo” carriers, which are combination cargo and passenger airlines, such as Air
Canada, Air France, American Airlines, Continental, Delta, Lufthansa, KLM and others. These airlines serve
as direct links to the International air freight network.

The Willow Run Airport, in Ypsilanti, MI handled 92,484 metric tons in 2010, making it the 42nd busiest
cargo airport in North America. Cargo airlines serving the airport are Kalitta Air, Active Aero, and National
Airlines.

12   Airports Council International


                                                  45 | TranSystems
Translinked Freight Study
                                                                                 Industry Trend Analysis


4.1.6 Toledo, OH
The region around Toledo, OH is making significant improvements in transportation Key projects in the
Toledo area are terminal improvements at the Port of Toledo, and the CSX National Gateway North
Baltimore intermodal terminal.

Port of Toledo
The port of Toledo is the largest Great Lakes Port in terms of area, and second largest in terms of cargo
volume. Development focuses mainly on the port’s main commodities, which are coal, iron, grain, project
cargo (wind towers, construction projects), petroleum products, and cement. The port also has two
refineries that generate petroleum based cargo. Notable progress is evident both in terms of terminal
facilities and capabilities, as well as - and perhaps more importantly - the cooperation and coordination
between public and private entities that drive development in the area. The Toledo-Lucas County Port
Authority is partnering with Metropolitan Planning Organizations (MPO), such as the Toledo Metropolitan
Area Council of Governments (TMACOG) and the Southeast Michigan Council of Governments
(SEMCOG), and importantly, private industry, such as Midwest Terminals, CSX and Norfolk Southern
Railways, to develop and fund transportation planning throughout the region. Recent U.S. Stimulus Funding
was applied to local transportation projects because regional agencies were able to quickly identify projects
based on mutually agreed upon priorities. This regional, public/private partnership approach to
transportation planning considers port, rail and roadway requirements to accommodate and complement
multimodal needs. Intermodal rail access that takes trucks off the highway, or port infrastructure that
promotes Saint Lawrence Seaway traffic over other more costly truck to rail routes are examples of
regional coordination. Other developments are:

    •   Toledo Port Authority
         o Purchased and developed defunct Chevron and JEEP plants
         o Port crane purchases provide additional cargo handling capabilities
    •   Norfolk Southern
         o Norfolk Southern extend rail siding in Toledo yard to accommodate length of container unit
             trains
    •   CSX Railroad
         o North Baltimore Intermodal Terminal (discussed below)
    •   ODOT
         o Widening of I-75 between Toledo and North Baltimore
         o State Route 18 access improvement to North Baltimore
    •   MiDOT
         o Approved routes for overweight trucks

The Port of Toledo has experienced additional business as a direct result of improvements to port facilities
and equipment; however, key reasons are shippers understand the advantages of shipping over the Port of
Toledo, and a Port Authority and MPOs that agree, and act on regional priorities.

CSX National Gateway Initiative: North Baltimore Intermodal Terminal
The CSX National Gateway Initiative is a key railroad improvement project that will positively impact the
Northwest Ohio region. This public private partnership will create a more efficient CSX rail route linking
key U.S. Mid Atlantic ports with Midwestern and Western markets for double stack containers. The
terminal in North Baltimore, OH opened in February of this year, and is considered the cornerstone of the


                                                46 | TranSystems
Translinked Freight Study
                                                                                    Industry Trend Analysis


entire project. It comprises 500 acres total, with 280 acres being used by CSX initially. High speed cranes
installed at North Baltimore enable containers to be off-loaded from incoming trains, and re-loaded on re-
directed outbound trains so quickly, that the resulting overall transit reductions of containers from origin,
through North Baltimore, to final destination has opened new markets. Service from New York, through
North Baltimore to Detroit, for example, was cited by CSX as becoming more attractive due to overall
network improvements, and improved switching capabilities. To capitalize on on-site and near-site DC
opportunities, two thousand acres adjacent to the North Baltimore site have been re-zoned for industrial
use, in anticipation of a future need for logistical services in the area, given improved intermodal rail and air
access.

4.1.7 Windsor, ON
Windsor is strategically located at the border between Canada and Michigan, and on the rail networks of
the CN and CP, with several other railroads having user rights on CN and CP tracks through Windsor. The
rail network provides links to the two major container ports in Eastern Canada – Montreal and Halifax –
and other Canadian ports, and to the major Canadian population and production centers. The rail network
provides transportation options for the major industries in and around Windsor, notably the automotive
industry. In addition, Windsor is connected by highway to major population and industrial centers in
Ontario and Michigan. Short-haul rail service is provided in the Windsor area by the Essex Terminal
Railway, with track running from Windsor to Amherstburg, ON that connects with all the major railroads in
the region. ETR services a variety of industries – automotive, forest products, agricultural, and food
products, chemicals and others.

                                 Figure 4-4: Current Rail System in Windsor


                                                 47 | TranSystems
Translinked Freight Study
                                                                                                Industry Trend Analysis


                    Source: City of Windsor “Community Based Strategic Rail Study, Final Report”

For international trade moving by rail, the key piece of infrastructure in Windsor is the rail tunnel under the
Detroit River. This tunnel was enlarged in 1994 but cannot accommodate double-stack high-cube
containers13 and auto-max railcars14. The number of high-cube containers has increased over time as
shippers take advantage of their larger capacity, and this traffic cannot move via the tunnel. Similarly, use of
larger auto railcars by the automotive industry has increased but this equipment cannot be routed through
the Windsor rail crossing. Construction of a new larger tunnel alongside the existing one has been proposed
and this would improve the freight capacity of the Windsor-Detroit border crossing.

4.2 Inland Strategies and Network Optimization
In addition to gateway and modal choices, shippers also consider inland transportation strategies to deliver
goods effectively. In general, rail deliveries are considered to be the lowest cost transpiration mode, but
other factors are considered. Cost, transit time, and inventory stock requirements drive the decision over
the strategy used. The following import inland strategies are well suited to the Translinked region:

       •    Direct Rail to Inland DC
            Due to rising fuel prices, and potential future driver shortages, shippers have developed strategies to
            utilize the lower cost rail mode versus truck over the last few years. Containers are diverted to rail
            from truck, directly from the port to the inland DCs that are near to inland intermodal rail
            terminals. This strategy requires longer transit lead times due to slower rail transits as compared to
            trucking.

       •    Transload Operations
            Truck costs can be lowered by consolidating                 Figure 4-5: Comparison of Container Sizes
            cargo at the port before it moves inland.                                                     Useable Capacity
                                                                      Container Size
            This is achieved by transloading three                                                        (cubic feet)
            international 40-foot containers into two
            domestic 53-foot containers or trailers at a
            transload facility. Two, instead of three                                                     Standard: 1,169
            container loads move to inland DCs, where
            the cargo is then re-distributed to its final
            destination, or is trucked directly to retail                                                 Standard: 2,395
            stores. In most cases, only very large                                                        High-Cube: 2,714
            retailers, such as big box stores take
            delivery directly from the transload facility.
                                                                                                          High-Cube: 3,830
       •    Inventory Hold/Cross-Dock
            This strategy is designed for shippers who
            import goods, and warehouse them in DCs                   Source: TranSystems derived from The Hub Group
            on the coasts. Their customers, usually
            footwear or garment retailers, place Just-In-
            Time (JIT) orders as needed, where they take delivery of the goods at the coastal DC. Retailers
            benefit from this arrangement because they avoid inventory carrying costs. Trucking is the preferred
            mode for this strategy due to the need for fast and flexible transit.

13   The high-cube container had a height of 9 feet 6 inches compared to 8 feet 6 inches for a standard container.
14   The auto-max railcar has a height of up to 20 feet 2 inches.


                                                          48 | TranSystems
Translinked Freight Study
                                                                                  Industry Trend Analysis


These strategies are used to deliver shipments to strategically placed DCs. As mentioned, the highest cost
portion of an international supply chain is the trucking to the final destination, or so-called “last-mile”
transportation. To illustrate this, consider a typical grocery store model. A single truckload delivers items to
the DC, but many trucks deliver goods from the DC to grocery stores in a given area, resulting in higher
“last mile” trucking expenses. To keep these expenses low, logistics managers consider the location of
customers and clients, and select DC’s that produce the lowest last mile trucking costs.
Figure 4-6 shows an example of a DC network optimization that calculates transportation costs, and
identifies lowest cost locations for DCs. This analysis estimates locations based on customer density areas,
using nine DCs. In this example, a distribution center in Detroit is responsible for cargo distribution to
much of the U.S. Midwest, while a distribution center in Toronto is responsible for deliveries to Windsor,
ON, which is just across the border from Detroit.

                           Figure 4-6: Example of Distribution Center Network


                                              Source: TranSystems

An alternative approach for the incorporation of the Translinked region into a distribution strategy is
illustrated in Figure 4-7. In this case, the shipper reduces overall network costs by establishing cross-dock
operations in markets previously served directly by the regional distribution centers. The cross-dock
strategy facilitates more efficient local distribution.


                                                49 | TranSystems
Translinked Freight Study
                                                                      Industry Trend Analysis


     Figure 4-7: Example of Distribution Center and Cross-Dock Network
        Existing DC Network Is Looking for Ways to Reduce Transportation Costs


New Network Incorporates DCs and Cross-Docks; Translinked Region Served via Cross-Dock


                                 Source: TranSystems


                                   50 | TranSystems
Translinked Freight Study
                                                                                                Industry Trend Analysis


4.3 Real Estate Infrastructure
Logistics managers choose warehouses and distribution center (DC) locations based on how they fit into
the overall supply chain operating cost and product lead time standards. DCs that are located close to rail
hubs, or that are located near to customers or suppliers, are desirable because they reduce trucking costs.
Competing sites that satisfy transportation cost and service level considerations are evaluated based on the
cost of the warehouse itself, labor costs, and increasingly, “green” considerations such as a having a small
energy footprint, to select the final site location.

Table 4-4 displays summary statistics on
                                                           Table 4-4: Detroit MSA Warehouse Vacancy and
industrial real estate, and the average hourly
                                                                   Lease Rates, Third Quarter 2011
wage for Transportation and Materials
Moving Occupation workers for the Detroit                                            Detroit MSA
Metropolitan Statistical Area (MSA) 15. Over              Total Space (million sq. ft.)                         524.0
five hundred million square feet of
                                                          Vacancy Rate (percent)                             13.6% - 14.6%
warehouse space reside within the Detroit
MSA, and up to 14.6% of warehouse space                   Average Lease Rate $/sq. ft./yr) *                 $3.87 - $3.93
was available as of the end of September                      Transportation and Materials Moving Occupation
2011. The average wage for Transportation                                   Mean Hourly Wage
and Materials workers is higher than the U.S.             Detroit-Warren-Livonia MI MSA                         $17.24
average, by $1.54 per hour, which may be of
concern to supply chain managers evaluating               U.S. Total                                            $15.70
competing DC location options at the                     * Asking lease rate for Warehouse and Distribution Use Facilities >
national level.                                                                      10,000 sq. ft
                                                         Source: TranSystems, US Bureau of Labor Statistics, CBRE, Grubb
                                                                                 and Ellis, and Colliers


15
     The Detroit MSA includes Lapeer, Livingston, Macomb, Oakland and St. Clair counties.


                                                     51 | TranSystems
Translinked Freight Study
                                                                                    Industry Trend Analysis


4.4 Labor and Demographic Profile
Figure 4-8 shows the number of employees by industry
for the Detroit-Warren-Livonia District by Industry,             Table 4-5: Detroit-Warren-Livonia, MI
and the unemployment rate for the District between            Employment by Industry Percent Changes
                                                                          between 2001 and 2011
2001 and August 2011. The Detroit-Warren-Livonia
region unemployment rate rose sharply, particularly                                      10 Year     Ten Year
                                                              Sector
                                                                                          CAGR        Change
between the years of 2008 and 2010, where
unemployment reached 15.8 percent, and then fell back         Trade and Transportation     -2.2%       -20.0%
to 12.9 by August, 2011. The National Unemployment            Professional Services        -1.9%       -17.3%
Rate stood at 9.1 percent in August of 2011. Industries       Manufacturing                -5.6%       -43.9%
hit particularly hard by the downturn were the three
                                                              Health and Education          1.7%        18.8%
largest sectors in 2001. During the next 10 years,
Trade and Transportation, Professional Services, and          Government                   -1.1%       -10.1%
Manufacturing jobs fell by 20.0 percent, 17.3 percent,        Hospitality Services         -0.4%        -3.9%
and 43.9 percent respectively. Only Healthcare and
                                                              Financial Services           -1.8%       -17.0%
Education shows a positive trend over this time period,
growing by 1.7 percent per year, and 18.8 percent over        Mining and Construction      -4.4%       -36.4%
ten years. While most segments improved, or halted            Information Services         -2.7%       -23.6%
their declines in 2010, only the Government and
                                                             Source: TranSystems and US Bureau of Labor Statistics
Hospitality sectors continue downward; although
neither of these sectors experienced sharp declines
similar to the Transportation, Professional Services or
certainly the Manufacturing sectors. Table 4-5 displays changes in growth for industries shown in Figure 4-8.


        Figure 4-8: Detroit-Warren-Livonia, MI Number of Employees by Industry, August Year
                                    over Year, 2001 – 2011 (000)


                                         Source: US Bureau of Labor Statistics


                                                   52 | TranSystems
Translinked Freight Study
                                                                                     Industry Trend Analysis


4.5 Business and Tax Environment
In 2007, the State of Michigan changed its business tax code, replacing a modified Value Added Tax (VAT)
with the Michigan Business Tax (MBT). The MBT was considered to be difficult to administer, especially for
smaller firms that did not typically have dedicated tax accounting personnel. The MBT will itself be replaced
in the 2012 tax year with a Corporate Income Tax (CIT), which will assess business tax at a simple rate of 6
percent. CIT compliance requirements are far less cumbersome than the MBT, and the new taxation
approach is viewed as a positive development, especially for medium to small sized business.

A component of the MBT that remains as a stand-alone tax
in 2012 is a Personal Property Tax (PPT). Under the MBT,            Table 4-6: Tax Foundation Business
credits for machinery and equipment are allowed. The PPT           Tax Climate Rank for Selected States
effective in 2012 eliminates credits for machinery and                                        U.S. Rank
equipment. This tax disproportionately affects
manufacturing companies with large equipment inventories;                                  2006        2011
however, there is an effort underway to repeal the PPT in            Indiana                12           10
its entirety.                                                        Michigan               28           17

Under the new CIT, almost all tax incentives have been               Illinois               26           23
eliminated, and the focus is to grow existing Michigan               Wisconsin              37           40
business, while de-emphasizing attempts to attract business
                                                                     Ohio                   47           46
from outside of Michigan.
                                                                                Source: Tax Foundation
The effects of the Michigan tax changes are unknown at this
time; however, The Tax Foundation, which is an
organization that ranks States by their “Business Tax Climate”, moved Michigan up 11 places, to 17th place in
2011 from 28th place in 2006. Table 4-6 provides ranking for Michigan and its top interstate trading partners.
Of the East North Central States, only Indiana provides a better tax climate than Michigan, according to the
Tax Foundation.

4.6 Foreign Trade Zones
One trend for companies involved in international trade that has been growing globally, is the use of foreign
trade zones (FTZ) for certain types of activities where these zones can provide economic benefits to clients.
Customs duties are deferred, or even reduced for items that are stored or handled in a FTZ. For imported
cargo simply stored in a FTZ, payment of customs duties are deferred for the length of time the cargo
remains within the FTZ. This can be especially useful for warehoused goods that are awaiting sale, where
sellers do not have to carry the import duty costs until after the sale of merchandise is actually transacted.
Manufacturers or product assemblers also benefit from the use of a FTZ because in many cases, individual
imported components of an item carry higher import duties than does the assembled item itself. A feature
of a FTZ is that all components used in the manufacturing or assembly of an item are assessed at the rate of
the assembled item, at a lower duty rate. Domestic items can also be used in FTZ product assembly.
Products exported from a FTZ are free of duty and tax.

Import cargo from Asia and Europe may benefit from FTZ tax and import duty reduction programs.
Canadian goods, which are not assessed import duties under NAFTA, gain no particular advantage of FTZ
processing, unless they are co-mingled with cargoes that are subject to import duties.


                                                53 | TranSystems
Translinked Freight Study
                                                                                    Industry Trend Analysis


When considering the overall suitability of the Translinked region as a logistics hub, FTZs are a required
feature, but do not necessarily provide a logistical advantage because they can be established almost
anywhere in the country. The region has gained much experience in the set-up and operation of FTZs,
mainly due to the automotive industry’s participation in the 1980’s and 1990’s, and assistance to companies
interested in setting up FTZ status in the Translinked area is readily available. Finally, having a FTZ is not an
advantage, but not having one is a distinct disadvantage for firms that require FTZ services.

4.7 Trends in Transportation and the Near-Term Outlook
4.7.1 Trucking Industry
The near-term outlook for the U.S. trucking industry is for rising costs due to rising diesel fuel prices and
steadily increasing constraints on labor supply. There is likely to be a continued modal shift away from over-
the-road to rail intermodal for highway truckload shipments, and a corresponding need for shippers to be
more aligned with intermodal as their distribution networks evolve. Shippers are expected to face increases
of 9 to 18 percent in trucking rates by 2012, due to rising truck fuel and labor costs, and will step up efforts
to explore opportunities for network changes to substitute intermodal for truck.

Trends in the Trucking Industry: 1995 to 2010

•   The volume of trucking activity in the United States, both for-hire and private, is about 8.5 billion tons of
    freight, accounting for about 70 percent of U.S. freight tons and 40 percent of ton-miles (U.S. Bureau of
    Transportation Statistics, Commodity Flow Survey).

•   Truck shipments, measured
    by number of Truckloads               Figure 4-9: Indexes of Trucking Volume (TL and LTL), U.S.
    (TL), Less-Than-Truckload             Industrial Production and Real GDP: 1995-2010 (1995=100)
    (LTL) tons, etc., have tended
    to move in tandem with the
    growth of the U.S. economy
    and U.S. industrial
    production, represented by
    Real GDP and the Industrial
    Production Index (IP),
    respectively. Figure 4-9shows
    these relationships on an
    annual basis from 1995 to
    2010, highlighting the most
    recent years of recession and
    recovery, 2008-2010. As
    shown in Figure 4-9, TL
    volume tended to grow at a
    somewhat faster rate relative           Source: American Trucking Associations; TranSystems’ estimates
    to the economy (GDP and
    IP) from 1995 to 2002, and
    then at a slower rate from 2002 to 2010. The slower growth relative to GDP reflects the growing
    importance of services relative to goods in the U.S. economy. However, there is even a clear decline in
    truck volume relative to Industrial Production, which indicates both modal substitution (e.g., rail for
    truck) and changing logistics networks.


                                                 54 | TranSystems
Translinked Freight Study
                                                                                 Industry Trend Analysis


•   The falloff in truckload volume relative to the economy was particularly severe in the recession year of
    2009. By contrast, the growth of LTL tonnage tended to lag the overall economy for the entire period.
    Also, as shown in the highlighted section of Figure 4-9, both TL and LTL volume significantly lagged the
    recovery in 2010. Finally, Figure 4-9 shows that the growth of both TL and LTL volume was far more
    variable over time than the overall economy.

•   Trucking pricing and revenue have tended to lag the overall economy as well. Exhibit II shows annual
    indexes of TL revenue per load and LTL revenue per ton, adjusted for inflation, from 1995 through
    2010. As shown in Figure 4-10, the TL index fell significantly from 1995 to 2003, recovered strongly
    from 2003 to 2006, then fell again from 2006 to 2009, particularly in the recession year of 2009, and
    recovered slightly during 2010. By contrast, the LTL index increased through 2006, and then flattened in
    2007-2008 before declining sharply in 2009. Even in the recovery period of 2010, real LTL revenue per
    ton continued to decline.

•   Figure 4-10 also shows that
                                         Figure 4-10: Indexes of Real Revenue per Load for Truckload
    this overall fall in real revenue
                                         Freight versus Real Diesel Fuel Prices: 1995-2010 (1995=100)
    per load occurred during a
    period of rapidly rising real
    fuel prices. For example, by
    2008, inflation-adjusted prices
    of diesel fuel were, on
    average, 2.5 times the level in
    1995. Although fuel prices fell
    sharply after mid-2008, by
    2010, they were still more
    than double the level of 1995
    and continued to rise into
    2011. The inability of truckers
    to raise rates in the face of
    rising fuel prices is largely due
    to competitive forces. In the
    case of TL freight, rail              Source: American Trucking Associations; U.S. Dept. of Energy, EIA;
    intermodal shipments have                                 TranSystems’ estimates
    increased their share of
    longer-haul segments, and
    LTL shipments have been displaced by competition from small package operators. This severe cost-price
    squeeze has led to sharp deterioration in finances for many trucking companies and owner-operators.

•   In addition to rapidly rising fuel prices, many trucking companies and owner-operators have faced
    increased difficulty in obtaining financing and in recruiting drivers. This has particularly affected the
    relatively long-haul segment of the industry (length of haul over 1,000 miles), as shown in Figure 4-11,
    which presents annual TL volume for 1996-2010 in three broad categories of length-of-haul. TL volume
    in the long-haul segment fell 25 percent from the peak in 1999 to 2010. The long-haul segment is where
    the difficulties of recruiting drivers have been most acute.


                                               55 | TranSystems
Translinked Freight Study
                                                                                  Industry Trend Analysis


•   Meanwhile, Figure 4-11 also shows that both the medium-haul (500-1,000 miles) and short-haul (less
    than 500 miles) segments grew significantly over the period. The medium-haul segment grew the fastest,
    especially through 2007, but has since declined sharply. Indeed, the medium-haul segment showed the
    most rapid decline in the recent recession and also the slowest recovery. In the case of both the
    medium-haul and long-haul segments, there has been major competition from rail intermodal service.
    Intermodal has long been
    making inroads on the long-
    haul traffic lanes, driven by          Figure 4-11: Indexes of Truckload Loads by Length-of-Haul
    rapid growth in international                        Segment: 1996-2010 (1996=100)
    container volumes,
    particularly for those very
    long length-of-haul lanes
    (1,500-3,000 miles) between
    the West Coast and the
    Midwest, Gulf and Eastern
    Seaboard. However, more
    recently, with heavy
    investment in rail
    infrastructure, and as rail
    service performance and
    operating cost have steadily
    improved relative to highway
    shipments, rail intermodal has
    gained share in the medium-
    haul traffic lanes as well,           Source: American Trucking Associations and TranSystems’ estimates
    particularly in rail-eligible
    lanes east of the Mississippi
    River.

Trucking Industry Outlook for 2011-2012

•   Looking forward, as the U.S. economy continues to gradually recover from the recession; the trucking
    industry will be faced with continued and even more intense constraints on growth and upward cost
    pressure. The supply of truck drivers has been the major constraint over the last several years, and this
    constraint will be exacerbated by three major developments on the regulatory front:

        o   Compliance, Safety and Accountability (CSA) initiative – The U.S. Department of Transportation
            (DOT) has placed increased emphasis on tracking of large over-the-road vehicles—buses and
            trucks—to identify and address safety issues. Truck drivers with less-than-perfect safety
            performance will be more rapidly removed from the pool of eligible drivers.

        o   Hours-of-Service Regulations – Further limits on driving hours per week or per day and stricter
            enforcement of those limits will increase the number of drivers required for a given amount of
            freight movement. DOT will implement further restrictions beginning in late 2011 or early 2012.

        o   Increased scrutiny on illegal aliens – as truck drivers’ licenses come up for renewal, those unable
            to provide documentation of U.S. citizenship will be denied a license. Ultimately, this might affect
            up to 10 percent of drivers.


                                                56 | TranSystems
Translinked Freight Study
                                                                                   Industry Trend Analysis


•   An offsetting effect on the supply of driver labor is the potential for allowing Mexican truck drivers to
    enter the U.S. However, this is not a certainty, and, in any case, only applies to cross-border shipments,
    as Mexican drivers would still not be permitted to move freight on traffic lanes within the U.S.

        o   A constraint on Mexican truck transportation is being caused by increasing violence in the
            northern Mexican states, which is prompting shippers to consider the more secure rail option
            when possible.

•   In addition to driver constraints, the industry will encounter equipment shortages due to increasingly
    stringent financial requirements placed on borrowers, which are particularly constraining for poorly-
    financed firms and owner-operators in the long-haul segments of the market. At the same time, there is
    a strong possibility (although it is far from certain) that diesel fuel prices will continue to climb toward
    previous peak levels in 2008.

•   The effects of these regulatory and economic factors will generally be to reduce supply and raise prices
    in over-the-road trucking. The effect on shippers will vary by traffic lane and will depend on the lengths-
    of-haul and presence of viable competition from rail in a particular lane. In cases where rail intermodal
    competition exists, over-the-road service will continue to rapidly lose share to rail, especially as
    railroads continue to invest heavily in the infrastructure for intermodal—both terminals and right-of-
    way. As fuel prices increase, the prices of both rail and truck will increase, but overall, truck prices will
    rise relative to rail. In addition, shortages of drivers and over-the-road equipment will put highway
    trucking at an increased disadvantage, particularly for longer length-of-haul traffic lanes and during
    periods of peak seasonal demand. Rail competition will limit price increases in these lanes. For traffic
    lanes not well-served by rail, however, truckers will have significant pricing power and rates will rise
    sharply. On average, supply constraints due to labor and equipment will increase truckload rates by 5 to
    10 percent by 2012 over 2010 levels, with larger increases occurring in lanes that face no intermodal
    competition. In addition, increases in diesel fuel prices could add up to 10 percent in additional truckload
    rate increases by 2012.

•   In view of these factors, the outlook for the next two years, 2011-2012, is for a continued steady
    decline of the highway share of Medium-to-Long-Haul shipments. In fact, with the increased constraints
    on the supply of drivers, there may even be a decline in the amount of longer-haul over-the-road TL
    shipments, even with a continued recovery of the U.S. economy.

•   Therefore, shippers are advised to be alert to impending truck shortages and rate hikes, particularly
    during periods of peak seasonal freight movement. Longer term, shippers should consider orienting their
    distribution networks, to the extent possible to take maximum advantage of rail intermodal, where
    there are no comparable constraints on supply.

4.7.2 Trends in U.S. Containerized Trade
The international container trade, particularly imports, is by far the fastest-growing driver of freight
transportation activity in the U.S. In terms of tonnage, the international container trade (there is a
moderate-size domestic container trade, mainly between the mainland U.S. and Alaska, Hawaii and U.S.
territories) accounts for approximately 3 percent of the U.S. freight market. However, when measured in
ton-miles, it is nearly 12 percent. Moreover, a substantial portion of the freight traffic moving in the U.S.
classified as “domestic” is actually imports moving from import distribution centers in the vicinity of the
inbound ocean ports to second-tier warehouses or to final destinations. Similarly, a significant portion of


                                                 57 | TranSystems
Translinked Freight Study
                                                                                   Industry Trend Analysis


export freight moves as “domestic” from interior U.S. origins to ports for loading into containers to be
shipped to overseas destinations.

The growth of the international container trades to and from the U.S. averaged 5.3 percent per year over
the past 15 years, with imports growing at a faster annual rate, 6.4 percent, and exports growing at 3.8
percent. The growth of the total international container trade was 6 to 7 times the annual growth rate of
about 0.8 percent per year for domestic freight over the same period. Although growth of the container
trade is likely to slow considerably over the next several decades, it will still be significantly faster than
domestic, and developments in international trade will continue to play an increasing role in shaping the
pattern of freight flows and logistics networks in the U.S.

The following sections describe the container trade, its size, geographic distribution, commodity
composition and growth; the major trends in the trade and their effects on transportation and distribution
patterns in the U.S.; and the impact on the Midwest and the Translinked area.

Growth of Containerized Imports and Exports
 In 2010, the most recent full year for which data are available, containerized imports into the U.S. from
foreign overseas ports totaled 16.9 million twenty-foot equivalent units (TEU) and exports from the U.S. to
foreign destinations totaled 11.0 million TEU. Domestic shipments between the U.S. Mainland and Alaska,
Hawaii and U.S. territories totaled an estimated 2.9 million TEU.

                                                                             Figure 4-12 shows the fifteen-year
   Figure 4-12: Growth of U.S. Containerized Import and Export               trend in containerized imports
                        Loads, 1995-2010
                                                                             and exports, 1995 to 2010. As
                                                                             shown, the growth of imports
                                                                             over this period, 6.4 percent
                                                                             annually, far outpaced the growth
                                                                             of exports, 3.8 percent. Due to
                                                                             the disparity in growth, the ratio
                                                                             of import to export TEU
                                                                             increased sharply, from 1.07 in
                                                                             1995 to a high of 2.14 in 2006 and
                                                                             1.54 in 2010. This import/export
                                                                             imbalance has had major
                                                                             implications for the routing of
                                                                             both domestic and international
                                                                             loads in the U.S., as explained
                                                                             below.

               Source: JOC Piers and TranSystems’ estimates                The relatively rapid growth of
                                                                           imports over this period is mainly
                                                                           due to an unprecedented growth
in goods consumption in the U.S. and an acceleration of the trend toward off-shoring of production of both
consumer goods and related capital goods. After falling almost continuously from the end of World War II,
the share of goods in total U.S. consumption began to rise in the early 1990s and continued a gradual
increase up to 2007. The rapid growth in goods consumption was further boosted by the housing market
boom of 2002-2007, which increased the demand for such goods as Building Materials and Furniture, which
were being increasingly sourced from overseas, and produced a “wealth effect” on consumption from rising


                                                 58 | TranSystems
Translinked Freight Study
                                                                                    Industry Trend Analysis


home values. However, when the housing boom turned to bust, containerized imports reversed course. In
2007, imports declined slightly, and then in 2008, by 7.9 percent, the first significant yearly decline ever. This
was followed by a further 14.9 percent in 2009. Even with a 13.1 percent increase in 2010, imports were still
11.3 percent below the peak annual volume reached in 2006.

Exports grew at a rate substantially less than imports over the past 15 years, but overall have had a more
robust performance than imports since 2006, as shown in Exhibit I. The key reasons for the recent surge in
exports are a sharp decline in the U.S. Dollar relative to most major overseas currencies and continued
strong growth of production and incomes in overseas economies.

The sourcing of U.S. imported
merchandise has been increasingly          Figure 4-13: Far East as a Share of U.S. Containerized Imports
dominated by Far East countries,                               and Exports, 1995-2010
particularly China. Figure 4-13
shows that for imports, the share of
the Far East increased from 59.9
percent in 1995 to 69.7 percent in
2010. By contrast, the Far East
share of U.S. exports was essentially
the same, 50.1 percent, in both
1995 and 2010. But with imports
still the “heavy leg” in U.S. container
trades, the steady shift to sourcing
from the Far East tended to
increase the role of West Coast
port gateways.

Impact of Container Trade on                           Source: JOC Piers and TranSystems’ estimates
the U.S. Supply Chain
The effect of the container trade on
transportation and logistics in the continental U.S. depends on the particular commodities moved. Imports
are mainly relatively high-value, light-density consumer goods and related capital or semi-finished goods,
which are mainly sensitive to trends in U.S. real disposable income, industrial production and wealth. By
contrast, exports tend to be lower-value raw or semi-finished products, sensitive to the value of the U.S.
Dollar relative to other currencies and growth of overseas economies. Trends in commodity composition
are shown for containerized imports and exports in Figure 4-14.

For imports, those commodities most closely related to housing led the surge over the period 1995 to
2006, increasing their share of total imports from 14.8 percent to 24.1 percent over this period. However,
these same commodities fell most rapidly in the 2007-2009 downturn, and stayed well below their peak
share during the 2010 recovery. The share of the highest-value imports—Electronics, Apparel, Industrial
Machinery, etc.—remained remarkably constant over the entire 1995-2010 period, falling only slightly from
37.8 percent in 1995 to 36.9 percent in 2010.

Trends in exports show an increasing share of the lowest-value commodities—Forest Products, Recycled
Material, etc.—although certain higher-value commodities such as Vehicles & Parts showed significant
growth. The lowest-value export commodities increased their share from 33.5 percent in 1995 to 41.0
percent in 2010, and this was largely due to increased demand from China.


                                                 59 | TranSystems
Translinked Freight Study
                                                                                    Industry Trend Analysis


Since containerized imports are oriented toward consumer goods, the geographic distribution of these
goods by their ultimate destination in the U.S. tends to resemble the distribution of the population. By
contrast, exports tend to originate in the coastal areas near container ports. The mismatch between the
origin of exports and the destination of imports leads shippers to use domestic freight to reposition back to
the port of entry those containers carrying imported merchandise to inland destinations.


    Figure 4-14: Trends in the Composition of U.S. Containerized Imports and Exports, 1995-2010


                                     Source: JOC PIERS and TranSystems estimates


Interior destinations such as in the Midwest are primarily served by intermodal rail service from the port of
discharge. Destinations near the coasts are served either by truck from a nearby ocean port, or, in the case
of many imports from the Far East, by intermodal service from West Coast ports. However, increasingly for
long-distance inland movements—by rail or truck— international containers, 20-foot and 40-foot, are being
unloaded at locations close to the discharge ports and their merchandise is reloaded into higher-cube
domestic containers, normally 53-foot units. This transfer is done either at special-purpose transloading
facilities or, more often, at Import Distribution Centers (IDCs) near the discharge ports. The capacity of
two 53-foot domestic containers can typically absorb the contents of three 40-foot international containers,
and this produces significant savings on inland linehaul costs. In addition, the “round-trip” economics of the
inland shipment are improved with the 53-footer, which can be more easily repositioned back to the port
area loaded with domestic freight. By 2010, the major California ports handling containerized imports—Los
Angeles, Long Beach and Oakland—were shipping an estimated 55 percent of imported merchandise to
inland destinations via high-cube domestic containers. The trend to transferring imported merchandise from


                                                  60 | TranSystems
Translinked Freight Study
                                                                                 Industry Trend Analysis


20- and 40-footers into 53-foot units also increases the importance of IDCs in areas near major
containership ports.

It is also important to note that the transfer of the imported merchandise from an international container to
a domestic unit, whether in a straight transload or via an IDC, changes the designation of the shipment from
“international” to ‘domestic,” even though, in most cases, the merchandise hasn’t changed in any significant
way. This is seen in a high percentage of so-called domestic freight coming in from a coastal origin to an
inland metro area such as Detroit that is labeled “Warehouse and Distribution” freight. Most of this is
essentially imported merchandise.

All-Water versus Intermodal Service for Far East Imports
Despite the proximity of West Coast ports to Far East markets and the widespread availability of
intermodal rail service from West Coast ports to destinations in the interior as well as the East Coast and
Gulf Coast, the West Coast has lost share of the Far East trade over the past 10-15 years. The West Coast
share of Far East containerized imports went from a high of 85.1 percent in 1997 down to 71.4 percent in
2009. Geographically, the main destination areas affected by this shift were points along the U.S. Eastern
Seaboard. Starting around 1997, rapid growth of Far East imports produced a series of intermodal service
failures on the West Coast, particularly at the largest port complex, L.A./Long Beach. These failures
accelerated the shift, already underway, of major retailers such as Walmart, Target and Home Depot to
diversify their import distribution away from too much reliance on West Coast port gateways. Ocean
carriers accommodated these shifts by expanding capacity and improving service to East Coast and Gulf
Coast ports. The share of Far East imports moving in “all-water” service (AWS) through the Panama Canal
and Suez Canal to East Coast ports (and, beginning in 2004, Gulf Coast ports) was the mirror image of the
fall in the West Coast share. Most of the AWS traffic is “eastbound” from the Far East via the Panama
Canal, but more recently, since 2007, vessel deployments from the Far East are moving “westbound” via the
Suez Canal, particularly where vessels are too large to fit through the Panama Canal. Such westbound
deployments also include not only U.S. East Coast ports, but also ports in Eastern Canada such as Halifax,
and several U.S. and Canadian ports can provide reverse intermodal rail service for Far East imports to
inland destinations such as Detroit.

The trend toward increased share of AWS was halted in 2010, however, as the West Coast share of the Far
East increased slightly to 72.1 percent versus a low of 71.4 percent in 2009. Moreover, there is a significant
likelihood that AWS share of the Far East may stop increasing and even decline going forward. There are
several reasons for this, and international distribution to the Midwest and other interior locations is a key
determinant.

    •   In the first place, the major gains in AWS share of Far East imports have already been achieved. For
        example, in 2000, about 60 percent of Far East imports to destinations in the Northeastern U.S.
        were shipped via intermodal service over the West Coast, but by 2010, that share had fallen to less
        than 6 percent, meaning that over 94 percent of these shipments were entering the U.S. via East
        Coast ports. Similar conditions prevail in the Southeast.

    •   Secondly, the Eastern Seaboard region, which has the highest potential for AWS, is growing
        relatively slowly as U.S. population and industry gradually move in a southwesterly direction.

    •   Finally, the railroads have sharply improved the performance of their intermodal services off the
        West Coast, and, at the same time, AWS ocean carriers have shifted to so-called “slow steaming” in
        order to reduce fuel costs and mitigate air pollution. These developments have led to an


                                                61 | TranSystems
Translinked Freight Study
                                                                                 Industry Trend Analysis


        improvement in the overall service performance of West Coast intermodal over East Coast
        services, especially for high-value, time-sensitive cargo.

    •   Even if AWS maintains its very high share of the Eastern Seaboard destinations, it is unlikely that
        AWS could be substituted for intermodal service from the Far East to the interior of the U.S.,
        particularly the Midwest. The routings via the Panama Canal to the interior are too circuitous to
        make sense and for either Canal, the transit time differential between AWS and intermodal service
        off the West Coast would be even greater than for shipments to the Eastern Seaboard. The only
        significant potential for shipments from the Far East to Midwest destinations via East Coast ports is
        for westbound traffic using the Suez Canal. However, the potential for these routings appears to be
        minimal.

4.7.3 Trends in Intermodal Rail
Intermodal rail volumes in the U.S. and
Canada have grown at an annual rate of
2.6 percent over the last decade, as             Figure 4-15: Annual North America Intermodal Rail
                                                                Volume, 2000 to 2010
shown in Figure 4-15. Like most
segments of the U.S. freight market,
intermodal rail volume in the most
recent full year, 2010, is still well below
its peak. In the case of intermodal,
2010 volume, at 13.4 million loads, is
still 5.9 percent below the peak volume
of 14.2 million loads in 2006. Exhibit I
also shows that growth of intermodal
has been volatile over this period,
particularly from 2007 to 2010, a
period of deep recession followed by
partial recovery.

Intermodal growth has also varied by
                                                                        Source: IANA
type of equipment. As shown in Figure
4-16, use of standard truck trailers in
intermodal service declined sharply over the period 2000-2010, at an annual rate of -5.0 percent, while the
share of container loads, both international and domestic, increased at a rate of 5.0 percent per year. Exhibit
II also shows that among the containers, the fastest-growing are the 48- and 53-foot high-cube units,
growing at a rate of 7.4 percent annually. With the percentage of high-cube domestic containers growing
rapidly (and 53-footers rapidly replacing 48-footers), the merchandise moving in containers is growing at an
even faster rate. When adjusted for container size, it is estimated that the growth of merchandise moving
via intermodal service in containers is growing at a rate of 5.6 percent per year from 2000-2010, which is
about twice the rate of growth of the U.S. and Canadian economies (Real GDP) over this period. The
fastest-growing intermodal markets are long length-of-haul (1500+ miles) east-west traffic lanes, particularly
those associated with containerized imports moving through ports on the West Coast to points east of the
Rockies. Container volumes on these lanes have been growing at a rate two to three times as fast as the
real growth of the U.S./Canadian economies, particularly with a growing dominant share of the Far East as a
source of merchandise imports. In addition, since 2008, domestic intermodal volumes have gained an
increased share of medium-haul (500-1,500 mile) traffic lanes at the expense of over-the-road truck service.


                                                62 | TranSystems
Translinked Freight Study
                                                                                   Industry Trend Analysis


The growth of international container
volume is the principal driver of rail        Figure 4-16: Growth of North America Intermodal Service
intermodal growth, and loads arising                       by Equipment Type, 2000 to 2010
from international imports or exports
(mostly imports) account for about 60
percent of total intermodal loads. The
share of international in total
intermodal volume is even greater
when expressed in terms of container-
miles or ton-miles, because, as noted
above, international loads are typically
moving in the long length-of-haul traffic
lanes. In terms of container (or trailer)-
miles, international accounts for about
75 percent of total intermodal volume.
However, as noted above, more
recently intermodal has made
significant gains in the domestic freight                               Source: IANA
market, as

    •   Operating costs of over-the-road truck service have risen rapidly relative to rail and are expected to
        increase further, due to substantial increases in the price of diesel fuel and intensifying shortages of
        truck driver labor. The threat of a labor shortage is particularly prevalent in medium- and long-haul
        traffic lanes, and could create spot shortages of truck service, particularly in peak months.

    •   Rail service (e.g., transit speed
        and reliability, terminal dwell
                                               Figure 4-17: Quarterly Average Intermodal Train Speeds
        times, service frequency and
                                                   for North American Class I Railroads, 2000-2010
        coverage of origin-destination
        pairs) continues to improve
        due to major rail investments
        in infrastructure, such as
        expanded terminal facilities and
        improved right-of-way.

As an example of improved rail service,
Figure 4-17 presents quarterly data on
the average intermodal linehaul speeds,
in miles-per-hour (mph), for the two
major U.S. western railroads, the BNSF
and the UP, from the first quarter of
2000 to the fourth quarter of 2010.
BNSF’s average intermodal train speed
                                                                         Source: IANA
increased from a low of 30.5 mph in
third quarter 2004 to a high of 39.3
mph in second quarter 2009. The latter quarter was near the trough of the recent recession and was
positively affected by light traffic volume, but even by fourth quarter 2010 after a substantial recovery in
traffic, BNSF average speed was 36.3 mph or 19 percent faster than the low point. Similarly, the UP’s


                                                 63 | TranSystems
Translinked Freight Study
                                                                                 Industry Trend Analysis


average speed increased from a low of 24.3 mph in fourth quarter 2005 to a high of 33.6 mph in third
quarter 2009 and most recently at 32.4 mph in fourth quarter 2010, or a 33 percent improvement over the
worst quarter. Also, the improvements in transit speed for both BNSF and UP by fourth quarter 2010 were
achieved with substantially greater traffic volumes than in their periods of slowest intermodal train speeds.

Containers and Transloading
As shown in Figure 4-16, the container is rapidly becoming the dominant unit for intermodal transport in the
U.S. and Canada, and higher-capacity containers are increasing their share of both international and
domestic intermodal shipments. In 2000, the first year for which data are available, intact highway trailers
accounted for 27.2 percent of total intermodal moves, and detached containers, both international (20-, 40-
and 45-foot) and domestic (48- and 53-foot), the other 72.8 percent. By 2010, the share of intact highway
trailers had fallen by more than half to 12.6 percent of total intermodal moves. Since 2000, use of containers
has grown dramatically with the relatively rapid growth of international and the increasing dominance of
double-stack service (DSS). The use of higher-cube domestic containers, particularly the 53-foot units, has
grown most rapidly. Use of domestic 53-foot containers has been spurred by their role in transloading of
inbound international containers at locations close to the inbound container port for movement inland. This
transloading is performed at special-purpose trans-load facilities or, more often, at Import Distribution
Centers (IDCs) for inland movement. Typically, the contents of three 40-foot international containers can fit
inside two 53-foot units, and this conversion

    •   Saves on rail linehaul and destination drayage costs

    •   Provides for more efficient repositioning of units with loads back to container port areas

    •   Allows importers to re-allocate merchandise by destination at a point in time only 5 to 10 days
        before scheduled delivery, providing a better match between supply and consumer demand.

By 2010, containers accounted for 87.4 percent of intermodal loads (and an even higher share of intermodal
ton-miles). The share of 53-foot containers was about 31 percent in 2010, up from 8 percent in 2000.
Moreover, as noted earlier, 53-foot containers have significantly larger cubic capacity and account for an
estimated 38 percent of the merchandise moved in intermodal transit.

West Coast Intermodal versus All-Water and East Coast Intermodal
As noted in an earlier section on the international container trade, the growth of the international
component of intermodal volume has been affected by the change in share of West Coast discharge versus
East Coast or Gulf Coast discharge of containerized import cargo.

    •   The West Coast share of imports has tended to increase, due to the growing dominance of Asia,
        particularly China, as the source of containerized merchandise. Approximately 60 percent of Asia-
        origin cargo discharged at West Coast ports makes its way (either as intact international containers
        or trans-loaded domestic containers) to destinations east of the Rocky Mountains, and nearly all of
        this traffic moves via intermodal.

    •   However, the extraordinarily rapid year-in/year-out growth of the Asia trade beginning in the late
        1990s led to a deterioration of intermodal service off the West Coast, and a steady shift to
        alternative routes from Asia via the Panama and Suez Canals to East and Gulf Coast locations. The
        share of such all-water service (AWS) from Asia increased from a low of 14.8 percent in 1997 to a


                                                64 | TranSystems
Translinked Freight Study
                                                                                Industry Trend Analysis


        high of 26.7 percent in 2009. Destinations on the Eastern Seaboard within 200 miles from the East
        Coast shifted almost entirely to AWS.

    •   At the same time, import cargo via East Coast ports from Europe or via the Suez Canal to
        destinations in the Midwest shifted from highway truck to intermodal. This service was enhanced
        due to major initiatives by Eastern railroads like CSX’s National Gateway and Norfolk Southern’s
        Heartland Corridor.

    •   Beginning in mid-2009, the share of Asia-origin import cargo discharging on the West Coast began
        to rise again. For the full year 2010, the West Coast share increased to 73.1 percent, up from 71.8
        percent in 2009. The main reasons for this shift appear to be (1) the exhaustion of opportunities for
        expansion of AWS to destinations on the Eastern Seaboard, and (2) the improvement in intermodal
        service relative to AWS—including the steady improvement in intermodal transit speeds referenced
        above, and the advent of “slow steaming” in AWS vessel deployments.

    •   The re-emergence of the West Coast advantage appears to have significant staying power. The
        AWS share is not likely to exceed the peak in 2009 even after the expansion of the Panama Canal in
        2014-15 increases the capacity and potentially lowers unit costs of AWS.

Implications for the Midwest
The Midwest share of total North America intermodal traffic has generally increased over the last decade,
and the main driver of this increase in share has been inbound loads with imported merchandise. As shown
in Figure 4-18, Midwest inbound volume increased from 2.55 million loads in 2000 to 3.53 million in 2010, a
compound annual growth rate of 3.3
percent, well above the overall North
America intermodal growth rate for              Figure 4-18: Midwest Inbound Intermodal Volume from
2000-2010 of 2.6 percent. For                            West Coast and Share, 2000 to 2010
shipments originating on the West
Coast, most of which are imported
merchandise, Midwest destination
volume increased at a still faster annual
rate of 4.5 percent, and the Midwest
share of intermodal shipments
originating on the West Coast
increased from 38.7 percent in 2000 to
45.8 percent in 2010.

The composition of intermodal loads
into the Midwest has been shifting
more towards high-cube 53-foot
domestic containers and a lower
percentage of 20-, 40- and 45-foot
international containers. For example,                               Source: IANA
in the West Coast-to-Midwest
intermodal market, the share of 48-
and 53-foot container loads increased from a low of 18.6 percent in 2005 to 30.0 percent in 2010. The
increased share of the high-cube domestic container suggests that import containers moving through West
Coast ports with merchandise ultimately bound for the Midwest are increasingly being unloaded on the


                                               65 | TranSystems
Translinked Freight Study
                                                                                             Industry Trend Analysis


West Coast with their contents transferred to high-cube domestic containers. Therefore, an increasing
percentage of this import merchandise has already been through one “tier” of import distribution by the
time it reaches a Midwest destination. Accounting for the higher cube of the domestic container,
approximately 40 percent of the import merchandise coming through the West Coast to the Midwest has
already been through one tier of distribution. This tends to reduce the share of total import distribution
activity in the Midwest. The remainder of inbound intermodal volume into the Midwest is domestic loads
plus a relatively small amount of import loads via East Coast and Gulf Coast ports. These loads grew at an
average annual rate of 1.9 percent from 2000 to 2010, well below the overall average North America
intermodal growth of 2.6 percent. Among the import loads via East and Gulf ports, an increasing percentage
of the first-tier import distribution is handled in the area of the ports.

The flow of intermodal freight to and from the Detroit BEA is similar to that of the total Midwest area.
Figure 4-19 presents estimates for 2009 of total intermodal tonnage inbound to and outbound from the
Detroit BEA for 2009 (see analysis Section 2.6.3). As shown, most of the largest intermodal lanes are
inbound from and outbound to port related BEAs – Los Angeles, New York, Seattle, Norfolk and
Jacksonville. In the case of these port-related BEAs, the “import” designation represents only those imports
that are moving “intact” in international containers destined for plants or first-tier distribution warehouses
in the Detroit area. As noted previously in Section 2.6.3, a substantial portion of what is labeled “domestic”
actually represents freight that is essentially still import merchandise that has moved through an IDC or a
transload facility and will be part of second-tier distribution in the Detroit BEA. For exports, a portion of
freight that is labeled as “domestic” moving from the Detroit BEA is actually export cargo, to be transferred
to export containers at the port.

          Figure 4-19: Detroit BEA - Top-10 U.S. Intermodal Rail Lanes by Cargo Tons in 2009


                                  Source: Derived from IHS Global Insight Transearch Data


In summary, growth of Midwest and Translinked region distribution activity has been increasingly driven by
the relatively rapid growth of import merchandise, but the Midwest role in the distribution of much of that


                                                    66 | TranSystems
Translinked Freight Study
                                                                                      Industry Trend Analysis


merchandise is shifting to second-tier. This is not to say that the Midwest role in first-tier import
distribution is disappearing—indeed, in 2010 an estimated 60 percent of import merchandise to the Midwest
via the West Coast is either going to a manufacturing facility or first-tier distribution. However, the
percentage appears to be declining.

4.8 Representative Service Providers and Shippers
A sample of major logistics service providers within the study region is presented in Table 4-7 and Table
4-8. The value added services provided by such companies, such as trucking, warehousing and distribution,
enable shippers to service population and industries within the Translinked region and in surrounding areas.
The companies and services support the various supply chain strategies and freight flows discussed in this
study.

            Table 4-7: Sample of Logistics Providers in the Study Region – Located in Michigan
  Provider                                     Value Added Services Offered                     Location
                                                  Michigan
  All American Warehouse and Cold Storage      Refrigerated warehouse services                  Detroit
  APL Logistics                                Warehousing, 3PL transportation contractor       Farmington
  Bay Logistics Inc.                           Warehousing, 3PL transportation contractor       Various
  Detroit Machinery Center Inc.                Warehousing, transportation services for         Detroit
                                               machinery and parts
  Expeditors Intl.                             Air freight, ocean freight, customs              Romulus
                                               brokerage, trucking, warehousing, logistics
  FedEx and FedEx SmartPost                    Small package, truckload and LTL trucking,       Detroit
                                               logistics, ocean and air freight management,
                                               supply chain management
  Freezer Services of Michigan                 Refrigerated storage, import/export              Detroit
                                               inspection, blast freezing, rail access
  Furniture Turn LLC                           Furniture manufacturing and distribution         Detroit
  Hollingsworth Logistics Management, L.L.C.   Hollingsworth Logistics Management, L.L.C.       Dearborn
  JB Hunt                                      Warehousing, 3PL transportation contractor       Detroit
  Kuehne & Nagel                               Air freight, ocean freight, customs              Romulus
                                               brokerage, trucking, warehousing, logistics
  Nippon Express                               Air freight, ocean freight, customs              Romulus
                                               brokerage, trucking, warehousing, logistics
  NorthGate                                    Warehousing and distribution of automotive       Flint
                                               parts
  UPS                                          Small package, truckload and LTL trucking,       Livonia, Grand
                                               logistics, ocean and air freight management,     Rapids, Taylor,
                                               supply chain management                          Madison Heights
                                        Source: Hoovers and TranSystems


                                                67 | TranSystems
Translinked Freight Study
                                                                               Industry Trend Analysis


    Table 4-8: Sample of Logistics Providers in the Study Region – Located in Ohio and Ontario
Provider                                 Value Added Services Offered                    Location
                                               Ohio
Cauffiel Technologies Corp.              General warehousing, manufacturing and          Toledo
                                         distribution services for the steel industry
CSX Intermodal Yard                      Intermodal rail terminal                        North Baltimore
Midwest Terminals                        Port terminal, warehousing                      Toledo
Toledo Harbor Warehousing Corp.          Freight consolidation, trucking warehousing,    Toledo
                                         cross-docking, trans-load services
                                             Ontario
Cargill                                  Grain Warehousing                               Sarnia
Cole International                       Freight forwarding, 3PL warehousing and         Windsor
                                         transportation,
Con-Way Freight                          Trucking, and Less then Truckload (LTL)         Windsor
                                         services'
Harbour Warehousing                      All purpose warehousing complex with rail       Sarnia
                                         access
Laser Transport, Inc.                    Trucking warehousing, distribution              Windsor
VersaCold Canada Corp.                   Warehousing and processing of refrigerated      Chatham-Kent
                                         and frozen food products
Wolverine Freight Systems                Trucking, warehousing and distribution          Windsor
                                  Source: Hoovers and TranSystems


                                          68 | TranSystems
Translinked Freight Study
                                                                                        Industry Trend Analysis


A representative sample of major shippers within the Translinked region is shown in Table 4-9, based on the
presence of large warehouse facilities in the area and major commodity groups. It should be noted Logistics
providers listed above are also major shippers in their own right, in light of the large amount of freight that
they control and manage on behalf of multiple shippers. Small to medium-sized shippers in particular favor
the use of 3PLs to manage their supply chains.

                           Table 4-9: Sample of Major Shippers in the Study Region
                                            2010 Revenue
             Company                                               Commodity Segment
                                              (Billions)
            Federal-Mogul Corporation             $6.84            Transportation Equipment
            Ford Motor Company                  $134.12            Transportation Equipment
            General Motors LLC                  $149.17            Transportation Equipment
            The Chrysler Group LLC               $41.90            Transportation Equipment
            TRW Automotive, Inc.                 $15.97            Transportation Equipment
            Alticore, Inc. (Amway)               $92.00            Secondary Traffic
            CVS, Inc.                           $104.01            Secondary Traffic
            KMart Corporation                    $16.03            Secondary Traffic
            Steelcase                             $2.64            Secondary Traffic
            Target Corporation                   $69.24            Secondary Traffic
            Whirlpool                            $18.80            Secondary Traffic
            Domino's Inc                          $1.60            Food or Kindred Products
            Meijer Companies, Ltd                 $0.02            Food or Kindred Products
            Spartan Stores                        $2.58            Food or Kindred Products
            Dow Chemical Corporation             $59.66            Chemicals or Allied Products
            Kelloggs                             $13.04            Farm Products
                                         Source: Hoovers and TranSystems


                                                69 | TranSystems
Translinked Freight Study
                                                                                         Freight Forecast


5 DETROIT BEA FREIGHT FORECAST
5.1 Introduction
Section 5 sets out a 10-year forecast of domestic and international, inbound and outbound, freight flows of
warehouse-able commodities. The forecasts are used to identify growth sectors, and potential target sectors
for development. The forecast methodology is described below followed by the forecast results and findings.

5.2 Methodology
The approach to forecasting freight flows uses, for domestic flows, input-output data for the Detroit BEA
and for combinations of U.S. regions external to the Detroit BEA. The international flows—overland
from/to Mexico and Canada, and from/to overseas origins and destinations—are forecast based on
commodity-specific econometric models, where freight flows are a function of macro-economic variables
such as Disposable Income, Wealth, Exchange Rates and Industrial Production. Forecasts of industry-specific
variables (growth of real output and employment) and macro-economic variables used in this analysis are
provided by Moody’s Economic.com and The International Monetary Fund. Each of the forecasting
techniques is described below.

Input-Output Forecasting
Inter-industry Input-Output tables are prepared periodically by the U.S. Department of Commerce. The
tables specify, for each of 60 industries (mining, agriculture, manufacturing, services, transportation,
education, health care, government) the estimated full input requirements for each unit of output of these
60 industries. The input requirements encompass primary, secondary, tertiary, etc. requirements for the
output of various industries. For example, a unit of output from the Construction Industry may require
direct input of a certain amount of output from the Building Materials industry, which may, in turn, require
input from Mining, which may, in turn, require input from Construction and Building Materials, and so on.
The input-output “coefficients” incorporate all of these effects. To forecast the inbound freight into the
Detroit BEA, the growth rates for all goods-using industries are estimated (using industry data specific to
Detroit from Economy.com), and the input-output table for Detroit is used to estimate the growth of
goods-input requirements, which help estimate the forecast growth of inbound goods flow into Detroit.
These industry-specific growth rates are then applied to the Base Year 2009 commodity- and origin-specific
freight flows into the Detroit BEA (described in Section 2) to get annual forecasts of these Detroit inbound
commodity-specific freight flows to 2020. To forecast outbound freight flows for the Detroit BEA, input-
output tables and Economy.com industry-specific growth rates are applied to industry output for the East
North Central Region (Indiana, Illinois, Wisconsin, Michigan, Ohio), which is the destination for most of
Detroit’s outbound freight, and the remainder of the U.S. states. These forecasts of Detroit inbound and
outbound domestic freight flows derived from input-output analysis are then adjusted as necessary to
account for changes in the nature of the goods shipped (e.g., value per ton).

Econometric Forecasting
For foreign origins and destinations, where input-output data are not readily available, forecasts of inbound
and outbound freight flows can be derived from econometric (statistical) models, relating time-series data
on freight flows (quarterly or annual) to macro-economic variables related to Detroit, the U.S. or overseas
countries. These econometric models are commodity-specific, and, like forecasts of domestic freight flows,
forecast growth rates for each commodity by country origin or destination are applied to Base Year 2009
freight flows between Detroit and other countries (based on the data from IHS Global Insight) to forecast
the commodity-specific freight flows.


                                                70 | TranSystems
Translinked Freight Study
                                                                                                   Freight Forecast


5.3 Economic Review and Outlook
The Detroit BEA includes seven metropolitan statistical areas (MSA) that generate the vast majority of the
region’s economic activity. They are Detroit-Warren-Livonia, Ann Arbor, Flint, Lansing-East Lansing,
Saginaw-Saginaw Township North, Monroe, and Bay City. In turn, the Detroit-Warren-Livonia MSA is the
largest economy in the region, accounting for 76 percent of the Gross Product generated by the seven
MSAs. As shown in Table 5-1, the combined Gross Product of the seven MSAs expanded by 3.7 percent in
2010 after contracting in 2008 and 2009. In 2010, the combined MSAs expanded at a faster rate than the
overall U.S. economy, which was partly driven by a recovery in manufacturing activity in the MSAs.

                   Table 5-1: Real Gross Domestic Product by MSA within the Detroit BEA
 Real GDP (Billions of 2005                                                                      2010         Share of
                                   2006          2007         2008        2009     2010
 Dollars)                                                                                       Growth       2010 GDP
 Detroit-Warren-Livonia             194           195          186         174      179           2.8%          75.9%
 Ann Arbor                           17           18            17         17       18            4.4%          7.4%
 Flint                               17           17            17         16       17            2.6%          7.1%
 Lansing-East Lansing                12           12            11         10       11            1.7%          4.5%
 Saginaw-Saginaw Township North      7             6            6           6        6            3.8%          2.6%
 Monroe                              4             4            3           3        3            3.1%          1.4%
 Bay City                            3             3            3           3        3            2.0%          1.1%
 Total Above MSAs                   254           255          243         229      236           2.9%         100.0%
 Michigan                           368           368          352         335      345           2.9%            -
 Toledo MSA                          25           25            24         23       24            1.6%            -
 Total USA                         12,896       13,144        13,100      12,774   13,100         2.6%            -
                                            Source: Bureau of Economic Analysis

The “Gross Product” of the Detroit BEA16 is forecast to grow at an annual rate of 1.3 percent between
2010 and 2020, as shown in Table 5-2. This is significantly slower than the 2.4 percent growth rate forecast
over the same period for the East North Central Region, which accounts for about 70 percent of the
inbound and outbound flows of warehouse-able freight to/from the Detroit BEA.

Projections for the components of Gross Product that pertain to goods movement and storage are also
presented in Table 5-2. Among these components, the largest as a percentage of Gross Product are
Machinery & Parts manufacturing at 5.7 percent and Transportation Equipment & Parts manufacturing, 5.4
percent. The fastest growth is expected from Electronics manufacturing with a forecast CAGR of 5.0
percent between 2010 and 2020, and Machinery & Parts with a CAGR of 4.4 percent. Food & Related
Products manufacturing accounted for an estimated 2.4 percent of the Detroit BEA’s Gross Product in
2010, but is forecast to grow at only a 0.3 percent annual rate from 2010 to 2020.

The data in Table 5-2 also indicate that the Detroit BEA’s industries related to goods movement—
manufacturing, transportation and warehousing—are forecast to grow faster than overall Gross Product.
The weighted-average annual growth rate for these industries in the Detroit BEA is 3.1 percent. However,

16
  Projections for the Detroit BEA are based on a review of economic data from the Bureau of Economic Analysis for
the MSAs within the Detroit BEA and forecast data from Moody’s Economy.com.


                                                       71 | TranSystems
Translinked Freight Study
                                                                                               Freight Forecast


for Transportation & Warehousing, projected annual growth in the Detroit BEA, at 2.5 percent, is
significantly less than the corresponding growth in the East North Central Region, at 3.7 percent.

   Table 5-2: Economic and Industry Factors Related to Goods Movement in the East North Central
               Region and the Detroit BEA: Ten-Year Annual Growth Rates, 2010-2020
                                                                         Percent of
                                                                                               Forecast
                                                                        Detroit BEA
         Economic Variable                                                                   Growth Rate
                                                                       Gross Product in
                                                                                            (%), 2010-2020
                                                                            2010
         East North Central Region Gross Product                              -                    2.4
         East North Central Transportation and Warehousing                    -                    1.3
         Detroit BEA Gross Product                                            -                    3.7
         Detroit BEA Machinery & Parts Manufacturing                         5.7                   4.4
         Detroit BEA Transport Equipment & Parts Manufacturing               5.4                   3.0
         Detroit BEA Electronics Manufacturing                               2.8                   5.0
         Detroit BEA Food & Related Products Manufacturing                   2.4                   0.3
         Detroit BEA Textile & Related Products Manufacturing                2.2                   2.4
         Detroit BEA Transportation and Warehousing                          2.0                   2.5
         Detroit BEA Miscellaneous Products Manufacturing                    1.8                   1.6
         Detroit BEA Chemical and Plastics Products Manufacturing            0.4                   4.2
         U.S. Gross Product                                                   -                    2.7
         U.S. Transportation and Warehousing                                  -                    4.7
                      Source: Based on MSA data from Bureau of Economic Analysis and Economy.com


                                                    72 | TranSystems
Translinked Freight Study
                                                                                                 Freight Forecast


5.4 Freight Flow Forecast
The results of the forecast of inbound and outbound freight flows of warehouse-able commodities are
summarized in Table 5-3. Total freight is projected to have increased from 89.9 million tons in 2009 to 97.8
million tons in 2010, driven by recovery from the
recession and growth of industries in the Detroit
region. Total inbound and outbound freight is projected           Figure 5-1: Forecast of Detroit BEA
to increase to 112.4 million tons in 2015 and 126.0             Inbound and Outbound Freight Flows –
million tons in 2020 (Figure 5-1), based on domestic                Warehouse-able Commodities
economic growth and the expansion of cross-border
trade with Mexico and Canada, and growth of trade
with overseas markets. The projected 10-year (2010 to
2020) compound annual growth rate (CAGR) is 2.6
percent.

Domestic inbound and outbound trade is projected to
grow at a 10-year CAGR of 2.4 percent, this relatively
slow growth a reflection of the projected growth
pattern of the Detroit BEA and U.S. economies, and the
relative maturity of some of the larger commodities
(e.g. Food Products) that comprise domestic freight
flows. Domestic outbound freight is projected to grow
at a faster rate than domestic inbound (10-year CAGR
of 2.5 percent versus 2.3 percent) due to stronger
economic growth in other regions of the U.S., which
generates demand for commodities shipped from the                 Source: TranSystems Forecast for 2010, 2015 and 2020, and
Detroit BEA, notably in the manufacturing sector.                         IHS Global Insight Transearch data for 2009


Cross-border inbound and outbound freight flows with
Canada are projected to grow at a marginally faster rate (10-year CAGR of 2.7 percent) than domestic
flows. However, the growth of trade with Canada is lower than that projected for cross-border trade with
Mexico (10-year CAGR of 5.1 percent). This reflects the relative maturity of economic integration between
Canada and the Detroit region, slower projected economic growth in Canada than in Mexico, and the
presence of some relatively mature commodities (e.g. Food Products and Forest Products) in Canada trade.

Cross-border inbound and outbound trade with Mexico is projected to be the fastest growing component
of freight; with a 10-year CAGR of 5.1 percent, 5.4 percent for inbound from Mexico and 4.6 percent for
outbound to Mexico. The stronger performance of Mexico trade relative to the other freight sectors is
driven by the composition of Mexican trade and several trends that are expected to influence trade with
Mexico in the future. Regional trade with Mexico is centered on higher-value and faster-growth commodity
sectors – inbound and outbound shipments of Transportation Equipment and outbound shipments of
Chemicals or Allied Products, which includes plastics and synthetic fibers. Economic integration between the
U.S. and Mexico continues, including the expansion of manufacturing in Mexico for the U.S. market.
Relatively stronger economic growth in Mexico will also support demand for U.S. exports.

Overseas Import and Export freight, which is clearly identifiable international cargo moving between the
Detroit BEA and U.S. port gateways (e.g. Port of New York/New Jersey), is projected to register a 10-year
CAGR of 4.3 percent, with Exports (4.4 percent) growing at a slightly faster rate than Imports (4.2 percent).


                                               73 | TranSystems
Translinked Freight Study
                                                                                                      Freight Forecast


The slightly stronger performance by Exports reflects the projected favorable market environment for U.S.
exporters, international economic growth and a favorable U.S. dollar exchange rate. It is important to note
that the identified Import and Export flows understate the actual volume of overseas freight flows due to
the conversion of international cargo to a domestic cargo move. For example, a large amount of
containerized imports arriving at Los Angeles/Long Beach is transloaded from 40-foot marine containers to
53-foot domestic containers, and then shipped inland. This is captured in freight flow databases as domestic
freight.

                          Table 5-3: Forecast of Inbound and Outbound Freight Flows
                                       Inbound Freight (Warehouse-able Commodities)

                                                                                                       CACR 2010
           Trade                    2009 Tons        2010 Tons        2015 Tons        2020 Tons
                                                                                                          to 2020

           Domestic                  44,334,660       47,678,414       54,438,636       59,970,374             2.3%
           Canada                     3,835,424        4,232,502          4,778,201      5,513,774             2.7%
           Mexico                     1,613,233        1,761,005          2,278,608      2,981,832             5.4%
           Import                     1,205,197        1,343,248          1,638,317      2,028,841             4.2%
           Grand Total             50,988,514        55,015,169       63,133,762       70,494,821              2.5%
                                      Outbound Freight (Warehouse-able Commodities)

                                                                                                       CACR 2010
           Trade                    2009 Tons        2010 Tons        2015 Tons        2020 Tons
                                                                                                          to 2020

           Domestic                  34,989,373       38,422,157       43,783,939       49,083,371             2.5%
           Canada                     1,512,627        1,665,247          1,962,443      2,218,630             2.9%
           Mexico                      812,665          927,945           1,209,384      1,451,046             4.6%
           Export                     1,581,080        1,796,395          2,316,588      2,756,368             4.4%
           Grand Total             38,895,745        42,811,744       49,272,353       55,509,415              2.6%
                                 Inbound & Outbound Freight (Warehouse-able Commodities)

                                                                                                       CACR 2010
           Trade                    2009 Tons        2010 Tons        2015 Tons        2020 Tons
                                                                                                          to 2020

           Domestic                  79,324,033       86,100,571       98,222,574      109,053,745             2.4%
           Canada                     5,348,051        5,897,749          6,740,644      7,732,404             2.7%
           Mexico                     2,425,898        2,688,950          3,487,992      4,432,877             5.1%
           Import & Export            2,786,277        3,139,643          3,954,905      4,785,209             4.3%
           Grand Total             89,884,258        97,826,912      112,406,115      126,004,235              2.6%

                    Source: TranSystems Forecasts for 2010, 2015 and 2020, and IHS Global Insight 2009 data.

The Baseline projections indicate that truck shipments will grow at a slightly faster rate than shipments by
rail. This result is driven by several factors – (1) the macro nature of the forecast models, with their
underlying assumptions on industry input and output relationships, and fixed modal shares for individual
commodities, (2) the large amount of freight moving between Detroit and truck friendly origins and
destinations in the East North Central region, and (3) the current transportation mode distribution.
However, the macro forecast models do not take into account significant transportation industry factors
that are expected to accelerate the growth of rail usage. As discussed in Section 3.8, the trucking industry is
faced with several challenges that are encouraging shippers to expand the use of rail in their supply chains.
These factors include fuel price increases, favoring rail over highway transport, the cost of recruiting and


                                                       74 | TranSystems
Translinked Freight Study
                                                                                                 Freight Forecast


maintaining truck drivers, investments by railroads in intermodal rail hubs tied to logistics parks, and
increased marketing and attractive pricing by railroads of shorter haul intermodal rail services. For these
reasons, it is likely that rail freight will grow at a faster rate than projected under the macro forecast growth
rates summarized in Table 5-4.

                       Table 5-4: Macro Forecast Growth Rates by Transport Mode
                          Inbound & Outbound Freight (Warehouse-able Commodities)
                        Rail      Truck         Rail        Truck
    Trade              Share      Share       10-Year      10-Year                       Comment
                       2010       2010         CAGR         CAGR
    Domestic            8.8%       91.0%        2.2%         2.4%      Rail freight is likely to grow faster than
                                                                       projected here due to truck and rail industry
    Canada             34.3%       65.0%        2.8%         2.7%
                                                                       trends – driver recruitment, fuel costs, etc.,
    Mexico             60.1%       39.8%        5.0%         5.3%      shipper interest in using more rail, investments
                                                                       by railroads in intermodal hubs, and railroad
    Import & Export    16.0%       84.0%        4.2%         4.3%      expansion into shorter distance corridors.
                                Source: TranSystems Forecasts for 2010, 2015 and 2020

The Base projections of cargo flows shown in Table 5-3 are driven by assumptions related to regional,
national and international economic activity, and relationships between industry inputs and outputs. Low and
high case projections are presented in Table 5-5. The basis for these alternative projections is that the
principal driver of freight flows is economic activity, represented by indicators such as disposable income
and industrial production. In addition, housing-sensitive commodities are subject to more uncertainties going
forward due to uncertainty as to the timing of recovery in regional housing markets. In general, the
sensitivities for non-housing related commodities (e.g. transportation equipment) are -0.5to +0.5 percent
per year. Secondary traffic is assumed to be 25 percent housing-related and the sensitivities are -0.2 to +1.5
percent per year. The growth sensitivities for international flows are -1.5 to +1.5 percent per year. A
stronger recovery in regional, national and international economic activity would be expected to drive a
healthy growth of international trade.

As shown in Table 5-5, total inbound and outbound shipments of warehouse-able commodities are
projected to have a 10-year compound annual growth rate of 2.6 percent under the Base Case, 1.9 percent
under the Low Case, and 3.2 percent under the High Case.


                                                  75 | TranSystems
Translinked Freight Study
                                                                                                         Freight Forecast


              Table 5-5: Inbound and Outbound Freight Forecast for 2020 – Base, Low and High
                                        Inbound Freight (Warehouse-able Commodities)
                                                                  2020 Tons                            CAGR 2010 to 2020
Trade               2009 Tons        2010 Tons            Base             Low          High         Base       Low         High
Domestic            44,334,660       47,678,414      59,970,374     57,318,605     63,775,639         2.3%      1.9%        3.0%
Canada               3,835,424        4,232,502       5,513,774      5,127,613      5,798,233         2.7%      1.9%        3.2%
Mexico               1,613,233        1,761,005       2,981,832      2,708,501      3,145,764         5.4%      4.4%        6.0%
Import               1,205,197        1,343,248       2,028,841      1,859,298      2,273,105         4.2%      3.3%        5.4%
Grand Total        50,988,514       55,015,169      70,494,821     67,014,016     74,992,742         2.5%       2.0%        3.1%
                                       Outbound Freight (Warehouse-able Commodities)
                                                                  2020 Tons                            CAGR 2010 to 2020
Trade               2009 Tons        2010 Tons            Base             Low          High         Base       Low         High
Domestic            34,989,373       38,422,157      49,083,371     44,989,601     51,752,543         2.5%      1.6%        3.0%
Canada               1,512,627        1,665,247       2,218,630      2,059,365      2,308,990         2.9%      2.1%        3.3%
Mexico                812,665           927,945       1,451,046      1,369,738      1,658,503         4.6%      4.0%        6.0%
Export               1,581,080        1,796,395       2,756,368      2,495,304      3,036,918         4.4%      3.3%        5.4%
Grand Total        38,895,745       42,811,744      55,509,415     50,914,008     58,756,955         2.6%       1.7%        3.2%
                                 Inbound & Outbound Freight (Warehouse-able Commodities)
                                                                  2020 Tons                            CAGR 2010 to 2020
Trade               2009 Tons        2010 Tons            Base             Low          High         Base       Low         High
Domestic            79,324,033       86,100,571     109,053,745    102,308,206    115,528,183         2.4%      1.7%        3.0%
Canada               5,348,051        5,897,749       7,732,404      7,186,977      8,107,223         2.7%      2.0%        3.2%
Mexico               2,425,898        2,688,950       4,432,877      4,078,239      4,804,267         5.1%      4.3%        6.0%
Import & Export      2,786,277        3,139,643       4,785,209      4,354,602      5,310,023         4.3%      3.3%        5.4%
Grand Total        89,884,258       97,826,912    126,004,235     117,928,024    133,749,697         2.6%       1.9%        3.2%

                                 Source: TranSystems Forecasts and IHS Global Insight 2009 data.


                                                        76 | TranSystems
Translinked Freight Study
                                                                              Comparative Location Analysis


6 COMPARATIVE LOCATION ANALYSIS
6.1 Introduction
With the exception of air cargo, “last mile” delivery trucking costs make up the highest portion of
transportation expense in a typical supply chain. As such, the location of a regional hub is heavily influenced
by the trucking cost to distribute goods “the last mile”, to local area DCs, retail stores, or to local
manufacturers. Locating DCs in high concentration customer/supplier areas reduces trucking expenses
enough to more than compensate for lower ocean and rail costs to competing regions. The Translinked
region must overcome two regional hubs that are well established and in a strong position to compete for
DC operations in the Midwest; Columbus, OH, and Chicago, IL. Columbus has the highest U.S. and
Canadian population reach of Detroit (representing the Translinked region) or Chicago, and Chicago has
superior rail and air cargo services, as well as a large Midwest distribution reach. Both of these areas have
competitive labor and industrial real-estate costs as well. Translinked region opportunities lay with
companies with specific distribution needs, such as a high concentration of customers in Northern Michigan,
over to Toronto, and including parts of the U.S. Midwest. Companies that require fastest ocean transits
from China or Europe, or manufacturers that receive materials used in production from nearby sources are
other potential candidates. TranSystems recommends a detailed, company by company analysis to identify
opportunities based on the Translinked region’s specific advantages.

Translinked area opportunities will be aided by addressing perceptions about the unpredictability of U.S.-
Canada border crossings, or presenting the region in a “can do”, business friendly light. A short window of
opportunity may be open due to concerns over truck driver and rail crew shortages, and volatile fuel prices.
Logistics managers are currently open to considering location solutions that drive costs out of their
networks, or that build flexibility into their supply-chains. Improved rail facilities that incorporate features of
successful rail projects, such as on-site DC facilities, will also elevate the Translinked area as a competitive
distribution hub. Importantly, private sector investment is critical to the success of logistics transportation
infrastructure projects; therefore, we strongly urge more private industry involvement and representation in
the Translinked initiative.

Time is of the essence. It should be noted that recent improvements in Ohio, such as CSX’s Northwest
Ohio Intermodal Terminal at North Baltimore, Norfolk Sothern’s Heartland Corridor serving Columbus,
and BNSF’s Chicago rail terminal at Elwood combined with the CenterPoint Intermodal Center have been
noticed in the industry. Other recent success within the Translinked region itself, such as port
improvements in Toledo, have been attributed to public/private cooperation, and agreed upon priorities.
Barriers impeding Translinked progress should be identified, and addressed. Slow moving initiatives will lose
out to locations that are established, and proven. Creating a Translinked Marketing Organization, similar in
concept to the successful KC (Kansas City) Smartport initiative, dedicated to identifying companies that
would likely benefit from locating in the study area, is recommended as the first step that will identify
realistic transportation opportunities.

6.2 Regional Truck/Rail Logistics Comparison
Logistics managers evaluate the use of truck and rail within the context of cost savings on an ongoing basis.
Improved reliability and transit speeds of railroads, and uncertainty caused by volatile fuel prices, or
expected driver shortages have caused supply chain managers to consider the rail option whenever possible;
however, the flexibility and transit speed capabilities of the trucking mode is often the only option, especially


                                                  77 | TranSystems
Translinked Freight Study
                                                                                    Comparative Location Analysis


for time sensitive shipments. The choice of truck versus rail is decided based on delivery time and cost
considerations.

6.2.1 Transit Time Hurdle
When considering a move to rail from truck, the first hurdle that must be cleared is the transit time
requirement. Just-In-Time (JIT) cargo needed for manufacturing purposes, for example, often has a very
short lead time, and requires a high degree of on-time reliability. A late shipment can cause missed
production schedules, thereby quickly erasing savings gained by using lower cost transportation options.
Retail sales items that have to arrive in stores on-time, or perishable items are examples of goods that
require fast, reliable transit. This cargo is more suitable for truck transportation, given that trucks tend to
have faster transits than rail, and provide more scheduling flexibility. Shippers also consider trucks to have
greater resiliency to service failures, due to easier access to trucks on highways, as compared to railcars on
a rail network. This access enables shippers to change plans “mid-stream”. The lower cost rail option is
preferred over trucking, if transit time requirements are acceptable, and rail service is available.

6.2.2 Total Landed Cost Comparison
The motivation to use rail is to save money. Once transit time considerations are met, logistics mangers
calculate the Total Landed Cost, which is the total of product, transportation, storage, inventory carrying
costs, customs duties, transloading and any other costs that are incurred as a result of moving a product
from point A to point B. This analysis allows shippers to evaluate modes on an “all inclusive” basis.
Transportation costs examples include rail, trucking, barging, ocean or air.

A particularly important component of Total Landed Cost is Inventory Carrying Cost, because transit time
has a direct impact on Inventory Carrying Cost elements, as explained below:

       •   Cost of Money – the longer products stay in inventory, the longer money is tied up, incurring interest
           expense, and opportunity costs. Cargo in-transit is considered as inventory.

       •   Obsolescence – sales items, or items with a short shelf life, such as high fashion items carry a high
           inventory carrying cost, as the products become severely devalued after a short period of time.

       •   Safety Stock – the additional amount of inventory that must be kept on-hand to prevent stock-outs.
           Longer lead and transit time increases safety stock requirements, Cost of Money, Obsolescence…

Trucking may be more expensive than rail, but trucking’s faster transit may result in lower inventory
carrying costs, and no transloading17 costs. Rail may be less expensive than trucking, but rail may incur
additional inventory carrying costs, and may also result in truck transload costs. The transportation mode
that results in the lowest Total Landed Cost is preferred. One outcome of this approach is that high-value18
goods are often moved by truck, because additional inventory carrying costs caused by longer transits of
even a few days, or the threat of lost sales due to late train arrivals, overshadow cost savings gained by using
rail. Strategies to carry low inventory in retail outlets and distribution centers factor into the landed cost
calculation, and this strategy also favors faster transit trucking in order to reduce the risk of stock-outs, and
missed sales opportunities. Even for time sensitive and high-value cargo; however, rail is evaluated. Improved
rail reliability and transit capabilities are causing logistics managers to re-consider the rail option.


17
     Transloading occurs during an intermodal move, such as from a rail boxcar to a truck.
18
     High-value cargo is generally processed or semi-processed goods, and often retail items.


                                                      78 | TranSystems
Translinked Freight Study
                                                                                     Comparative Location Analysis


6.2.3 Rail Transits
Railroad transit times, measured in hours, from major port gateways are shown in Table 6-1. They are based
on information from railroad websites; however, TranSystems’ experience is that actual rail transits can vary
widely from published schedules based on port and rail corridor congestion, container dwell times at
terminals, priority given to various shippers and other factors. The Port of Halifax, for example estimates
that actual rail transits to Detroit from Halifax, Montreal, and New York are closer to 125, 103, and 168
hours respectively, if container “dwell time” is included in the transit. Railroad websites suggest a much
shorter transit, at 89, 40, and 68 hours from Halifax, Montreal, and New York respectively.

The most important characteristic of the
                                                       Table 6-1: Estimated Rail Transits in Hours from Key
inland rail move is reliability. Lead times for
                                                            Port Gateways to Selected Midwest Points
rail shipments have already been built into
delivery requirements, so logistics managers            Origin Port Gateway           Detroit      Chicago       Columbus
in many cases can tolerate a day or two                 Halifax                          89            73            97 a
extra rail transit if arrival times can be relied
                                                        Montreal                         48 b          96            64 c
upon. A separate market survey of
transportation practices undertaken by                  New York/New Jersey              68            51            65
TranSystems, included an interview with a               Norfolk                          63            47            39
U.S. retailer who used the fastest rail transit         Savannah                         81   d        65            57 d
lane available. When the rail operator raised
                                                        Prince Rupert                    127           97           124 e
rates in that corridor, the retailer switched
to a lower cost rail route because a transit            Seattle/Tacoma                   162          132            162
saving of two or three days did not justify             Los Angeles/Long Beach           145           78            113
the higher rate, as long as the shipments
                                                        a) Estimated based on Columbus versus Detroit transit difference
arrived on-time. It is important to note that              from NY/NJ
for some shippers of high-value or time-                b) Montreal to Toronto + 24 hours
sensitive cargo, a two or three day shorter             c) 24 hours from Detroit
transit IS valued, and they would likely                d) Based on Norfolk Chicago to Columbus and Detroit spreads
                                                        e) 24 hours from Chicago
consider premium rates for faster, reliable
service.                                               Note: Rail transit times are based on published schedules and do not
                                                        take account of other factors including congestion, container dwell
                                                       time, priority shipments, etc. In practice, transit times may be longer
Other influences on the use of a rail                                        than indicated in the Table.
corridor are the ocean carrier used to                                Source: TranSystems, Railroad Websites
import goods, or the type of North America
distribution strategy. For example, Prince
Rupert advertises the fastest ocean/rail transit from Shanghai to Detroit; however, if a shipper does not
contract with one of the two ocean carriers that have vessels calling Prince Rupert, or on carriers that have
space sharing agreements with those carriers, fast transit to Prince Rupert is not an option. An inland U.S.
transportation strategy might employ a coastal facility that combines shipments from several origins, and
redistributes cargo to North American destinations. The location of the coastal facility drives the rail
corridor used, which may or may not result in the lowest rail transit in a particular corridor. The overall
controlling considerations are service reliability, required transit time, and lowest total landed costs,
including ocean, costal distribution, rail, and truck costs.

6.2.4 Transportation Cost Indication by Gateway
When a shipper is considering gateway costs, ocean and rail costs are combined to arrive at the total cost
per gateway. Transit time, cargo volume, cargo types, and number of services offered in a given gateway all
affect total gateway costs. Table 6-2 provides a comparison by port gateway serving the U.S. Upper Midwest


                                                    79 | TranSystems
Translinked Freight Study
                                                                                  Comparative Location Analysis


region, categorized by Market or Blow Market cost (ocean plus inland) for imports from Asia or Europe. In
general, the shortest transits have the highest rates (e.g. Shanghai to Los Angeles/Long Beach), while longer
transit routes have the lower rates (e.g. Shanghai to Ney York via the Panama Canal). A notable exception
to this rule is Shanghai to Prince Rupert, where ocean carriers have increased capacity, and have
competitively priced the service to attract new business.

As a result of severe railroad delays starting in the late 1990’s, and a dock worker labor lockout on the US
West Coast in 2002, logistics managers began to diversify the number of gateways used to avoid reliance on
a single port. All-Water Service (AWS) from Asia that bypassed the West Coast via the Panama Canal to
access Eastern and Midwestern markets became more popular. Prior to this trend, AWS pricing was
discounted due to the longer transit time required to sail vessels through the Panama Canal; however, the
price gap between West Coast
Gateways and AWS East Coast
Gateways narrowed, as this route            Table 6-2: Translinked Study Area Cost* Evaluation by North
became more popular.                                            American Port Gateway
                                           Port Gateway               Cargo Origin Asia         Cargo Origin Europe
The difference between the highest
and lowest rate for the same origin        Halifax/Montreal              Below Market                   Market
and destination, but using different       Prince Rupert                 Below Market                 No Service
gateways might be comparable,              U.S. Northeast Ports          Below Market                   Market
when the total of ocean and                U.S. Southeast Ports          Below Market                   Market
rail/trucking costs are considered.
                                           U.S. Pacific Northwest           Market                   Below Market
The cost evaluations appearing in
Table 6-2 are intended to provide a        California Ports                 Market                   Below Market
general illustration of port gateway      * Cost refers to ocean plus inland costs. Each port gateway is categorized as At
costs. Actual rates are negotiated                                   Market or Below Market
with ocean carriers and railroad                                    Note: Based on interviews.
operators on a case-by-case basis,                                     Source: TranSystems
and will vary by shipper.


6.2.5 Trucking Transits and Market Coverage
As mentioned earlier, trucking costs make up the highest portion of transportation expenses; therefore,
supply chain managers develop strategies that balance truck transit time requirements and trucking costs.
Moving distribution centers as close as possible to end customers is a frequent goal. One method supply
chain analysts use to determine the suitability of a proposed logistics hub is to calculate the U.S. Population
that can be reached within a 10-hour truck drive-time extending outward from a proposed location. Ten
hours is generally used as the trucking drive-time threshold due to US Federal Motor Carrier Safety
Administration (FMCSA) safety regulations that limit the amount of time that drivers are allowed to spend
behind the wheel. “Team driver” arrangements are allowable to extend driver hours, but typical distribution
models use single drivers.

Figure 6-1 illustrates the 10-hour truck drive-time areas covered by distribution hubs in Detroit
(representing the Translinked region), Columbus, Chicago, and Harrisburg, PA. Harrisburg was included to
illustrate the market role of more easterly distribution hubs. Table 6-3 displays the U.S. and Canadian
populations falling within the 10-hour truck distribution areas of each city. The 10-hour truck drive-time
areas were calculated by assuming free-flow traffic conditions and so do not take into consideration traffic
congestion on particular routes, which can have a negative impact on truck service areas.


                                                 80 | TranSystems
Translinked Freight Study
                                                                           Comparative Location Analysis


Detroit, while covering the second
smallest population range (88.2 million           Table 6-3: U.S. and Canada Population within 10-Hour
people), reaches further north into                  Truck Drive-Time of Detroit and Selected Cities
Ontario and Quebec than do other cities            Population
included in Figure 6-1. The advantages of                             U.S.           Canada            Total
                                                   Millions
Columbus is that it include the highest            Detroit             74.9             13.4             88.2
population coverage of the four cities
listed, encompassing 118.4 million people.         Columbus           109.6              8.7            118.4
The coverage offered by Columbus                   Harrisburg         102.6             14.7            117.3
reaches from Midwest markets to the                Chicago             75.7              8.2             83.9
Central Atlantic States of Pennsylvania,
New Jersey, Delaware, Maryland, Virginia,                   Source: TranSystems derived from Census data
and extends south to points in Northern
Alabama, Georgia and South Carolina.
Harrisburg provides coverage of 117.3 million people and it has distribution advantages in Eastern Quebec,
New Brunswick, the U.S. Northeast US and the U.S. Eastern Seaboard States of Virginia North Carolina.
Western markets from South-central Minnesota, down to Eastern Nebraska, and across to the Northeast
corner of Arkansas are best serviced from a DC in Chicago, as compared to the other selected cities. A
total of 83.9 million people can be reached within a 10-hour truck drive of Chicago. Of the cities studied,
Harrisburg (14.7 million) and Detroit (13.4 million) have the highest Canadian population reach. Harrisburg
would be favored for target customers heavily concentrated in the East, Chicago for Midwestern markets,
Detroit for Midwestern plus Canadian markets, and Columbus for population in both Midwest and Eastern
markets. The challenge for the Translinked region, as a distribution hub, is its proximity to some of these
more favorably located cities – for example, a company with a DC in Columbus can access the largest
population of the four locations considered here and provide coverage of the Translinked regional market.


                                                81 | TranSystems
Translinked Freight Study
                                                              Comparative Location Analysis


Figure 6-1: 10-Hour Truck Drive-Time Area Comparison: Detroit, MI, Chicago, IL, Columbus,
                                 OH, and Harrisburg, PA


                                    Source: TranSystems


                                      82 | TranSystems
Translinked Freight Study
                                                                                     Comparative Location Analysis


Table 6-4 provides estimated truck transit
times from selected cities to major                    Table 6-4: Truck Transit Time from Detroit and
population centers. Transit times shown in             Selected U.S. Distribution Hubs to Major Cities
red denote corridors that are beyond the                                     Origin (Truck Transit Hours, > 10 Hours)
10-hour delivery radius of most DCs. For            Destination       Detroit       Columbus       Chicago       Harrisburg
example, none of the DCs would likely               Chicago             5.4             6.7            -             12.2
service Dallas. Chicago is within range of          Cincinnati           5              2.1           5.6            8.8
most of the largest Midwest Cities, and             Cleveland           3.2             2.7           6.2            6.4
Harrisburg is the only DC within 10-hour            Columbus            3.9              -            6.7             7
range of New York City.                             Dallas              22.4            19.1         17.8            25.4
                                                    Detroit              -              3.9           5.4            9.2
To illustrate how truck volume to                   Indianapolis        5.9             3.5           3.5            10.3
destination cities affects overall trucking         Kansas City         14.5            12.1          9.9             19
costs, Table 6-5 displays the populations by        Milwaukee           7.4             8.6           2.1             14
U.S. Census Bureau Metropolitan Statistical         Minneapolis         12.9            14.1          7.7            19.7
Area (MSA) for the largest Midwest                  Nashville           10.2            7.1           8.8            13.3
Markets, and the population of Toronto,             New York            11.8            10.3         14.8            3.6
ON and truckload rates to each of these             Pittsburgh          5.7             3.7           8.7            4.1
cities from Detroit, Chicago, Columbus and          Saint Louis         10.3            8.1           5.8            14.9
Harrisburg. Table 6-5 should be viewed as           Toronto             4.6*            8.2*          9.7*           7.3*
a basic example of a regional DC analysis of
                                                       * Subject to customs inspections, may extend transit beyond 10 hours
trucking costs, where large regional DCs                           Source: TranSystems and Truckloadrates.com
covering several states feed smaller DCs
that service a metropolitan area.

If truckload volumes to each destination are proportional to destination city populations, Detroit and
Chicago have the lowest average total trucking costs. Chicago is aided by having local trucking rates to the
third largest MSA in the cities listed, while other markets would have to pay long distance trucking rates to
serve those same Chicago area customers. A regional DC located in Detroit benefits from local truck rates
to 4.3 million people in Detroit, as well as the lowest long distance trucking cost to the large population
center of Toronto. If Toronto is removed from the analysis, Chicago becomes the lowest cost hub, while
Detroit falls to the third place position behind Columbus.

It should be noted that, per Table 6-4, Detroit cannot serve Kansas City, Minneapolis, Nashville or St. Louis
within a 10-hour truck drive, which may not meet service level requirements of some shippers. Service to
Toronto may be affected by inspection and other delays at the border, which could disqualify Toronto from
a Detroit DC service area. Interviews with logistics managers suggest that the existence of a border
crossing within the distribution area of a warehouse is workable, but not desirable. This emphasizes the
importance of addressing concerns regarding border delays, because access to the Toronto market is
important if the Translinked region is to be viewed as a leading Midwest distribution location.

A common observation of prospective regional hubs is that cargo often passes through their regions, only to
be transported back into the area later. Network optimization may cause truckloads to actually pass
through their eventual destination. Chicago’s lower DC distribution costs may cause containers to pass
through Detroit to Chicago, where cargo might be comingled with other freight, and trucked back to
Detroit. In this case, total U.S. network distribution cost savings outweigh rail cost or transit time savings to
Detroit, even if containers pass through the Translinked region initially.


                                                 83 | TranSystems
Translinked Freight Study
                                                                            Comparative Location Analysis


   Table 6-5: Estimated Truckload Costs from Detroit and Selected U.S.
                     Distribution Hubs to Major Cities

                       2010                         Origin (Estimated $ per Truckload)
                                  MSA                  Lowest Cost, 2nd Lowest Cost
Destination           MSA         Rank
                    Population             Detroit       Columbus      Chicago        Harrisburg

Chicago              9,461,105     3         $555           $474         $150            $645
Cincinnati           2,130,151     27       $462            $534         $584            $549
Cleveland            2,077,240     28        $456           $443         $670            $448
Columbus             1,836,536     32        $456           $150         $678            $446
Detroit              4,296,250     12       $150            $553         $606            $563
Indianapolis         1,756,241     34        $583           $555         $457            $560
Kansas City          2,035,334     29       $1,167         $1,007        $867            $989
Milwaukee            1,555,908     39        $618           $608         $541            $828
Minneapolis          3,279,833     16       $1,053         $1,085        $664           $1,094
Nashville            1,589,934     38        $842           $562         $761            $642
Pittsburgh           2,356,285     22        $680           $489        $1,005           $455
Saint Louis          2,812,896     18        $823           $577         $577            $783
Toronto              5,471,400      -       $577           $1,066       $1,150           $956
Weighted Average                            $612            $645         $615            $709

                   Source: TranSystems, TruckloadRates.com and Census Data


                                          84 | TranSystems
Translinked Freight Study
                                                                                        Comparative Location Analysis


6.3 Location Profiles – Columbus and Chicago
6.3.1 Columbus, OH
A DC located in Columbus is considered to have the largest population reach of any U.S. location, due to its
proximity to the largest U.S. population centers in the Midwest and Eastern states. Over 118 million people
live within a ten-hour drive of Columbus. Columbus has also benefitted from recent developments, such as
the Rickenbacker Logistics Park, Norfolk Sothern’s Heartland Corridor, with improved transit times from
Norfolk to Columbus, and intermodal terminal improvements as part of CSX’s National Gateway Initiative.
Table 6-6 summarizes several key logistical characteristics offered by Columbus.

                              Table 6-6: Columbus Regional Logistics Summary
                                                      Columbus, OH
             Railroads and Service Area               CSX – U.S. East, Midwest, main Western States Access
                                                      NS – East, Midwest access
                                                      Western States and Canadian cargo connects to railroads
                                                      serving those areas, i.e. UP, BNSF, CP, and CN.
              Highway Description                     I-70 and I 80 to the north provide east/west access, I 71
                                                      and I 75 to the west provide north/south access
             Distribution Facilities
                U.S. and Canada Population Reach      118.4 million within 10-hour truck driving radius
                   Total Warehouse Space (sq. ft.)    205.9 – 213.8 million
                                       Vacancy Rate   11.5% – 3.7%
                 Average Lease Rate ($/sq. ft./yr)*   $2.70 – $3.32
              Transportation and Materials Moving
                                                      $14.85
                      Occupation Wage (Hourly)
             Fastest Ocean Gateways                   Norfolk, New York
             Airport
                                       US Rank****    54th
                   Total Cargo (metric tons) ****     69,748
              Distribution Area Target                US Midwest, Northeast, Mid Atlantic
                      * Asking lease rate for Warehouse and Distribution Use Facilities > 10,000 sq. ft
                    Source: TranSystems, CB Richard Ellis, Grubb and Ellis, Colliers, US Bureau of Labor
                      Statistics, Airport Council International – North America, and Railroad websites

The Rickenbacker Inland Port is the best example of a multimodal/intermodal logistics park in the area. Key
features of the facility are on-site access to the NS intermodal rail terminal, the Rickenbacker International
Airport, and I-270. On-site rail access accommodates logistics strategies to reduce trucking costs, as cargo
can be delivered to DCs that are directly adjacent to rail and air facilities. Because of the multimodal
advantages, several Third Part Logistics Providers (3PLs), such as Exel, Kuehne & Nagel, Nippon Express,
Expeditors International have locations at Rickenbacker. Regular cargo airline service is offered by UPS and
FedEx, with less frequently scheduled cargo services offered by international carriers, such as Evergreen Air
and Kalita Air. Attracting dedicated international cargo airlines other than UPS or FedEx is significant
because the current trend of these carriers is to limit service to very large air hubs, such as Miami, FL,
Chicago, IL, or Los Angeles, CA. The lack of daily service from multiple international cargo airlines into


                                                      85 | TranSystems
Translinked Freight Study
                                                                                         Comparative Location Analysis


either Columbus or Rickenbacker international Airports indicates that the Columbus area is not considered
to be a major air cargo gateway into the Midwest; however, air cargo services are an advantage of the
Rickenbacker facility. Justification for air cargo services that do call Rickenbacker is based on the needs of
tenants, and the large population coverage offered by the location. TranSystems interviews suggest that the
Rickenbacker air facility does not break-even financially; however, air cargo services support logistics needs
of the airfield tenants, such as The Limited Companies and others, and jobs created by the facility are
viewed to compensate for losses.

6.3.2 Chicago, IL
Chicago has the third largest U.S. metropolitan population with over 9 million people, and is served by six of
the seven Class 1 Railroads that operate in North America. In addition to the local population, over 75
million people can be reached within a 10-hour truck drive from Chicago. Chicago is also North America’s
fifth largest cargo airport, with regularly scheduled service from over twenty cargo airlines from around the
world, in addition to passenger airlines, such as Air China, Air France, Singapore Airlines and others that
transport air cargo on passenger jets. The combination of population mass, ample rail intermodal service,
and nearby access to one of the key Midwest air cargo hubs provide compelling reasons to locate Midwest
regional DCs in the Chicago area. Rail congestion is noted as an impetus to establish rail facilities elsewhere
that allow trans-continental rail service to bypass Chicago. CSX’s North Baltimore project is an example of
such a rail facility. Table 6-7 summarizes several key logistical characteristics offered by Columbus.

                               Table 6-7: Chicago Regional Logistics Summary
                                                         Chicago, IL
               Railroads and Service Area                CSX US East, Midwest, main Western States Access
                                                         NS East, Midwest access
                                                         UP and BNSF, States west of the Mississippi
                                                         CN, Canada Rail Markets, US Central Plain States, Gulf
                                                         P, Canada Rail Markets, US Northeast, US Midwest
                                                         I-94 and I 57 provide north/south access, I 80
               Highway Description
                                                         east/west, and I 90 northwest access
               Distribution Facilities
                  U.S. and Canada Population Reach       83.9 Million within 10-hour truck driving radius
                     Total Warehouse Space (sq. ft.)     1.0 – 1.3 Billion
                                         Vacancy Rate    9.3% – 11.3%
                   Average Lease Rate ($/sq. ft./yr)*    $3.90 – $4.39
                Transportation and Materials Moving
                                                         $16.46
                        Occupation Wage (Hourly)
               Fastest Ocean Gateways                    West Coast (Asia origin cargoes)
               Airport
                                            U.S. Rank    5th
                          Total Cargo (metric tons)      1,376,552
               Distribution Area Target                  US Midwest
                      * Asking lease rate for Warehouse and Distribution Use Facilities > 10,000 sq. ft
                    Source: TranSystems, CB Richard Ellis, Grubb and Ellis, Colliers, US Bureau of Labor
                      Statistics, Airport Council International – North America, and Railroad websites


                                                        86 | TranSystems
Translinked Freight Study
                                                                             Comparative Location Analysis


An example of a logistics industrial park in the Chicago Area that combines key elements of a successful
supply chain cost reduction strategy is CenterPoint’s 2,500-acre industrial complex located in Joliet. The
main attraction to this facility is on-site service provided by the BNSF railway, which reduces trucking costs
to DCs located at CenterPoint to an estimated $92 per container. CenterPoint considers this to be such a
strong selling point that they included a “Drayage Calculator” on their website that estimates cost savings of
locating at CenterPoint versus five other site locations in the Chicago area. Companies like WalMart agree
with the cost saving potential of the development, and have located at CenterPoint. Separate TranSystems
interviews of logistics managers in the Chicago area revealed that the single downside of the development is
that BNSF is the only railroad to serve the site. If freight arrives at other railroad terminals, containers have
to be drayed back to the CenterPoint facility.

The Chicago logistics market is so large that smaller municipalities within the metropolitan area compete
with each other for customers. Local government supports development initiatives by providing tax
incentives, such as lower tax rates for “urban blight” areas, or they quickly re-zone roadways to
accommodate over-weight truck loads, or re-direct roadways to facilitate the flow of freight traffic between
key logistics hubs and highways. Cooperative government is a key consideration when selecting a logistics
hub, after transportation cost and service requirements are met.


                                                 87 | TranSystems
Translinked Freight Study
                                                                                                    Comparative Location Analysis


6.4 Regional Comparison Summary
The Translinked region faces steep competition as a Midwest regional logistics hub. Table 6-8 presents a
comparison of key transportation hub considerations for Detroit (representing the Translinked area),
Columbus and Chicago. Detroit has distribution advantages if Ontario, Canada is included as part of a DC
service area. Columbus offers the largest population coverage within a 10-hour truck drive, and the lowest
transportation cost, labor rates, and industrial real estate lease rates. Chicago has the edge for railroad, or
air cargo service availability. Chicago also has the highest Midwest market distribution reach.


                                  Table 6-8: Detroit, Chicago and Columbus Summary Table
                                                Detroit, MI                        Columbus, OH                          Chicago, IL
Rail Access
Railroads                                    CSX, NS, CN, CP                          CSX, NS                    CSX, NS, UP, BNSF, CP, CN
                                                                                                               CSX US East, Midwest, main
                                                                         CSX: US East, Midwest, main           Western States Access
                                      CSX US East, Midwest, main         Western States Access                 NS East, Midwest access
                                      Western States Access              NS: East, Midwest access              UP and BNSF, States west of the
Service Area                          NS East, Midwest access            Western States and Canadian           Mississippi
                                      CN, CP Canada Rail Markets, US     cargo connects to railroads           CN, Canada Rail Markets, US
                                      Central Plain States, Gulf         serving those areas, i.e. UP, BNSF,   Central Plain States, Gulf
                                                                         CP, and CN.                           CP, Canada Rail Markets, US
                                                                                                               Northeast, US Midwest
                                      US-69 to Blue Water Bridge to      I-70 and I 80 to the north provide
                                                                                                               I-94 and I 57 provide north/south
                                      CA-402,US 75, US 375CA-401 via     east/west access, I 71 and I 75 to
Highway Access                                                                                                 access, I 80 east/west, and I 90
                                      Ambassador Bridge, US-96, US-      the west provide north/south
                                                                                                               northwest access
                                      94, US-275 (to US-80),             access
Distribution Facilities
Population Reach (10 hour truck
                                                 88.2 million                       118.4 million                         83.9 million
radius, US and Canada)
Total Warehouse Space (sq. ft.)             366.8 – 524.0 million               205.9 – 213.8 million                   1.0 – 1.3 Billion
Vacancy Rate                                   13.5% - 14.9%                        11.5% - 13.7%                        9.3% – 11.3%
Average Lease Rate ($/sq. ft./yr) *             $3.87 – $3.91                       $2.70 – $3.32                        $3.90 - $4.39
Transportation and Materials
Moving Occupation Wage                             $17.24                              $14.85                               $16.46
(Hourly)
Fastest Ocean Gateways                      Halifax, Prince Rupert              Norfolk, New York              West Coast (Asia origin cargoes)
Airport
U.S. Rank                                           27th                                54th                                  5th
Total Cargo (metric tons)                          193,344                             69,748                              1,376,552
                                         Ontario, Canada, Michigan          US Midwest, Northeast, Mid
Distribution Area Target                                                                                                  US Midwest
                                         Peninsula, OH, IN, WI, IL                  Atlantic

                              * Asking lease rate for Warehouse and Distribution Use Facilities > 10,000 sq. ft
                            Source: TranSystems, CB Richard Ellis, Grubb and Ellis, Colliers, US Bureau of Labor
                              Statistics, Airport Council International – North America, and Railroad websites


                                                                88 | TranSystems

Translinked Regional Freight Study

  • 1.
    Translinked Freight Study December 2011 Prepared for: Detroit Regional Chamber
  • 2.
    Translinked Freight Study Tableof Contents 1 EXECUTIVE SUMMARY ................................................................................................................................... 1 1.1 TRANSLINKED ................................................................................................................................................... 1 1.2 RECOMMENDATIONS ......................................................................................................................................... 2 1.3 REGIONAL FREIGHT FLOWS ................................................................................................................................. 5 1.4 INDUSTRY TRENDS AND LOCATION COMPARISON .................................................................................................... 9 2 DETROIT BEA FREIGHT FLOWS ..................................................................................................................... 11 2.1 INTRODUCTION ............................................................................................................................................... 11 2.2 DETROIT BEA TOTAL CARGO............................................................................................................................. 12 2.3 DETROIT BEA TRUCK CARGO ............................................................................................................................ 16 2.3.1 Total ....................................................................................................................................................... 16 2.3.2 Domestic Inbound and Outbound .......................................................................................................... 18 2.3.3 Domestic Internal and Through Cargo ................................................................................................... 22 2.3.4 Imports and Exports ............................................................................................................................... 22 2.3.5 Canada ................................................................................................................................................... 23 2.3.6 Mexico ................................................................................................................................................... 24 2.4 DETROIT BEA RAIL CARGO ............................................................................................................................... 25 2.4.1 Total ....................................................................................................................................................... 25 2.4.2 Domestic Inbound and Outbound .......................................................................................................... 27 2.4.3 Domestic Internal and Through ............................................................................................................. 31 2.4.4 Imports and Exports (excl. NAFTA) ........................................................................................................ 31 2.4.5 Canada ................................................................................................................................................... 32 2.4.6 Mexico ................................................................................................................................................... 33 2.5 OTHER TRANSPORT MODES .............................................................................................................................. 33 2.6 CORRIDOR SPECIFIC FLOWS............................................................................................................................... 33 2.6.1 Halifax Freight Flows ............................................................................................................................. 33 2.6.2 Montreal Freight Flows .......................................................................................................................... 34 2.6.3 U.S. Intermodal Rail Corridors ............................................................................................................... 35 3 TOLEDO AND WINDSOR FREIGHT FLOWS .................................................................................................... 37 3.1 TOLEDO, OHIO ............................................................................................................................................... 37 3.2 WINDSOR, ONTARIO ....................................................................................................................................... 38 4 INDUSTRY TREND ANALYSIS ........................................................................................................................ 40 4.1 EXISTING TRANSPORTATION INFRASTRUCTURE AND LOCATION SELECTION FACTORS ..................................................... 40 4.1.1 Logistics and Transportation Infrastructure Summary .......................................................................... 40 4.1.2 Rail ......................................................................................................................................................... 41 4.1.3 Highways ............................................................................................................................................... 43 4.1.4 Ocean Gateways .................................................................................................................................... 44 4.1.5 Airports .................................................................................................................................................. 45 4.1.6 Toledo, OH ............................................................................................................................................. 46 4.1.7 Windsor, ON .......................................................................................................................................... 47 4.2 INLAND STRATEGIES AND NETWORK OPTIMIZATION............................................................................................... 48 4.3 REAL ESTATE INFRASTRUCTURE .......................................................................................................................... 51 4.4 LABOR AND DEMOGRAPHIC PROFILE ................................................................................................................... 52 4.5 BUSINESS AND TAX ENVIRONMENT..................................................................................................................... 53 4.6 FOREIGN TRADE ZONES .................................................................................................................................... 53 4.7 TRENDS IN TRANSPORTATION AND THE NEAR-TERM OUTLOOK ................................................................................ 54 i | TranSystems
  • 3.
    Translinked Freight Study 4.7.1 Trucking Industry ................................................................................................................................... 54 4.7.2 Trends in U.S. Containerized Trade ........................................................................................................ 57 4.7.3 Trends in Intermodal Rail ....................................................................................................................... 62 4.8 REPRESENTATIVE SERVICE PROVIDERS AND SHIPPERS ............................................................................................. 67 5 DETROIT BEA FREIGHT FORECAST ................................................................................................................ 70 5.1 INTRODUCTION ............................................................................................................................................... 70 5.2 METHODOLOGY .............................................................................................................................................. 70 5.3 ECONOMIC REVIEW AND OUTLOOK .................................................................................................................... 71 5.4 FREIGHT FLOW FORECAST................................................................................................................................. 73 6 COMPARATIVE LOCATION ANALYSIS ........................................................................................................... 77 6.1 INTRODUCTION ............................................................................................................................................... 77 6.2 REGIONAL TRUCK/RAIL LOGISTICS COMPARISON................................................................................................... 77 6.2.1 Transit Time Hurdle ............................................................................................................................... 78 6.2.2 Total Landed Cost Comparison .............................................................................................................. 78 6.2.3 Rail Transits ........................................................................................................................................... 79 6.2.4 Transportation Cost Indication by Gateway .......................................................................................... 79 6.2.5 Trucking Transits and Market Coverage ................................................................................................ 80 6.3 LOCATION PROFILES – COLUMBUS AND CHICAGO.................................................................................................. 85 6.3.1 Columbus, OH ........................................................................................................................................ 85 6.3.2 Chicago, IL.............................................................................................................................................. 86 6.4 REGIONAL COMPARISON SUMMARY ................................................................................................................... 88 List of Tables Table 1-1: Selected Regional Freight Flows in 2009 .................................................................................................................................................5 Table 1-2: Inbound and Outbound Freight Forecast for 2020 – Base, Low and High ....................................................................................8 Table 2-1: Warehouse-able Commodities ............................................................................................................................................................... 14 Table 4-1: Detroit Logistics Summary....................................................................................................................................................................... 40 Table 4-2: West Coast Transit Time Comparison (Transit Days): Shanghai to Detroit .......................................................................... 45 Table 4-3: East Coast Transit Time Comparison (Transit Days): Hong Kong and Rotterdam to Detroit .......................................... 45 Table 4-4: Detroit MSA Warehouse Vacancy and Lease Rates, Third Quarter 2011 ................................................................................ 51 Table 4-5: Detroit-Warren-Livonia, MI Employment by Industry Percent Changes between 2001 and 2011 .................................... 52 Table 4-6: Tax Foundation Business Tax Climate Rank for Selected States ................................................................................................. 53 Table 4-7: Sample of Logistics Providers in the Study Region – Located in Michigan ................................................................................. 67 Table 4-8: Sample of Logistics Providers in the Study Region – Located in Ohio and Ontario ............................................................... 68 Table 4-9: Sample of Major Shippers in the Study Region ................................................................................................................................... 69 Table 5-1: Real Gross Domestic Product by MSA within the Detroit BEA ................................................................................................... 71 Table 5-2: Economic and Industry Factors Related to Goods Movement in the East North Central Region and the Detroit BEA: Ten-Year Annual Growth Rates, 2010-2020 .......................................................................................................................................................... 72 Table 5-3: Forecast of Inbound and Outbound Freight Flows ........................................................................................................................... 74 Table 5-4: Macro Forecast Growth Rates by Transport Mode ......................................................................................................................... 75 Table 5-5: Inbound and Outbound Freight Forecast for 2020 – Base, Low and High ................................................................................. 76 Table 6-1: Estimated Rail Transits in Hours from Key Port Gateways to Selected Midwest Points ...................................................... 79 Table 6-2: Translinked Study Area Cost* Evaluation by North American Port Gateway ......................................................................... 80 Table 6-3: U.S. and Canada Population within 10-Hour Truck Drive-Time of Detroit and Selected Cities ........................................ 81 Table 6-4: Truck Transit Time from Detroit and Selected U.S. Distribution Hubs to Major Cities ...................................................... 83 Table 6-5: Estimated Truckload Costs from Detroit and Selected U.S. Distribution Hubs to Major Cities ........................................ 84 Table 6-6: Columbus Regional Logistics Summary ............................................................................................................................................... 85 Table 6-7: Chicago Regional Logistics Summary ................................................................................................................................................... 86 Table 6-8: Detroit, Chicago and Columbus Summary Table............................................................................................................................. 88 List of Figures Figure 1-1: Map of Translinked Region ........................................................................................................................................................................1 ii | TranSystems
  • 4.
    Translinked Freight Study Figure1-2: Detroit BEA Cargo in 2009 by Transport Mode.................................................................................................................................6 Figure 1-3: Detroit BEA Cargo in 2009 by Trade Flow ..........................................................................................................................................7 Figure 1-4: Detroit BEA Cargo Tons in 2009, Total and Warehouse-able .......................................................................................................7 Figure 1-5: 10-Hour Truck Drive-Time Area Comparison: Detroit, MI, Chicago, IL, Columbus, OH, and Harrisburg, PA ........... 10 Figure 2-1: Map of Detroit BEA .................................................................................................................................................................................. 11 Figure 2-2: Detroit BEA Cargo in 2009 by Transport Mode.............................................................................................................................. 12 Figure 2-3: Detroit BEA Cargo in 2009 by Trade Flow ....................................................................................................................................... 13 Figure 2-4: Value per Cargo Tons .............................................................................................................................................................................. 14 Figure 2-5: Detroit BEA Cargo Tons in 2009, Total and Warehouse-able .................................................................................................... 15 Figure 2-6: Detroit BEA Truck Cargo by Trade Flow in 2009........................................................................................................................... 16 Figure 2-7: Detroit BEA Truck Cargo in 2009 – Top Ten Commodity Groups .......................................................................................... 17 Figure 2-8: Detroit BEA Inbound and Outbound Truck Cargo in 2009 – Top 20 Commodity Groups ............................................... 18 Figure 2-9: Detroit BEA Inbound and Outbound Truck Cargo in 2009 – Top 20 Freight Lanes ............................................................ 19 Figure 2-10: Domestic Inbound Truck Freight ....................................................................................................................................................... 20 Figure 2-11: Domestic Outbound Truck Freight ................................................................................................................................................... 21 Figure 2-12: Detroit BEA Import Truck Cargo in 2009....................................................................................................................................... 22 Figure 2-13: Detroit BEA Export Truck Cargo in 2009....................................................................................................................................... 23 Figure 2-14: Detroit BEA - Canada Truck Cargo in 2009 ................................................................................................................................... 23 Figure 2-15: Detroit BEA - Mexico Truck Cargo in 2009 ................................................................................................................................... 24 Figure 2-16: Detroit BEA Rail Cargo by Trade Flow in 2009............................................................................................................................. 25 Figure 2-17: Detroit BEA Rail Cargo in 2009 – Top Ten Commodity Groups ............................................................................................ 26 Figure 2-18: Detroit BEA Inbound and Outbound Rail Cargo in 2009 – Top 15 Commodity Groups ................................................. 27 Figure 2-19: Detroit BEA Inbound and Outbound Rail Cargo in 2009 – Top Freight Lanes .................................................................... 28 Figure 2-20: Domestic Inbound Rail Freight ............................................................................................................................................................ 29 Figure 2-21: Domestic Outbound Rail Freight........................................................................................................................................................ 30 Figure 2-22: Detroit BEA Import Rail Cargo in 2009 ........................................................................................................................................... 31 Figure 2-23: Detroit BEA Export Rail Cargo in 2009 ........................................................................................................................................... 31 Figure 2-24: Detroit BEA - Canada Rail Cargo in 2009 ....................................................................................................................................... 32 Figure 2-25: Detroit BEA - Mexico Rail Cargo in 2009 ....................................................................................................................................... 33 Figure 2-26: Detroit BEA – Cargo Flows from the Halifax Area in 2009 ....................................................................................................... 34 Figure 2-27: Detroit BEA – Cargo Flows with the Montreal CMA in 2009................................................................................................... 35 Figure 2-28: Detroit BEA - Top-10 U.S. Intermodal Rail Lanes by Cargo Tons in 2009 ............................................................................ 36 Figure 3-1: Port of Toledo Cargo ............................................................................................................................................................................... 37 Figure 3-2: Port of Toledo Commodity Mix ........................................................................................................................................................... 37 Figure 3-3: Detroit BEA Domestic Freight Flows with Toledo BEA, 2009 .................................................................................................... 38 Figure 3-4: Windsor, Ontario CMA Freight Flows in 2009 ................................................................................................................................ 39 Figure 3-5: London, Ontario CMA Freight Flows in 2009 .................................................................................................................................. 39 Figure 4-1: Class I Railroad Map with Container Ports........................................................................................................................................ 42 Figure 4-2: Regional Highway Map ............................................................................................................................................................................. 43 Figure 4-3: Detroit Truck Border Crossings .......................................................................................................................................................... 44 Figure 4-4: Current Rail System in Windsor ........................................................................................................................................................... 47 Figure 4-5: Comparison of Container Sizes............................................................................................................................................................. 48 Figure 4-6: Example of Distribution Center Network ......................................................................................................................................... 49 Figure 4-7: Example of Distribution Center and Cross-Dock Network......................................................................................................... 50 Figure 4-8: Detroit-Warren-Livonia, MI Number of Employees by Industry, August Year over Year, 2001 – 2011 (000) ............ 52 Figure 4-9: Indexes of Trucking Volume (TL and LTL), U.S. Industrial Production and Real GDP: 1995-2010 (1995=100) ........... 54 Figure 4-10: Indexes of Real Revenue per Load for Truckload Freight versus Real Diesel Fuel Prices: 1995-2010 (1995=100) ... 55 Figure 4-11: Indexes of Truckload Loads by Length-of-Haul Segment: 1996-2010 (1996=100) .............................................................. 56 Figure 4-12: Growth of U.S. Containerized Import and Export Loads, 1995-2010 ..................................................................................... 58 Figure 4-13: Far East as a Share of U.S. Containerized Imports and Exports, 1995-2010 ......................................................................... 59 Figure 4-14: Trends in the Composition of U.S. Containerized Imports and Exports, 1995-2010 ......................................................... 60 Figure 4-15: Annual North America Intermodal Rail Volume, 2000 to 2010 ................................................................................................ 62 Figure 4-16: Growth of North America Intermodal Service by Equipment Type, 2000 to 2010 ............................................................ 63 Figure 4-17: Quarterly Average Intermodal Train Speeds for North American Class I Railroads, 2000-2010 ................................... 63 Figure 4-18: Midwest Inbound Intermodal Volume from West Coast and Share, 2000 to 2010 ............................................................ 65 Figure 4-19: Detroit BEA - Top-10 U.S. Intermodal Rail Lanes by Cargo Tons in 2009 ............................................................................ 66 Figure 5-1: Forecast of Detroit BEA Inbound and Outbound Freight Flows – Warehouse-able Commodities ................................. 73 Figure 6-1: 10-Hour Truck Drive-Time Area Comparison: Detroit, MI, Chicago, IL, Columbus, OH, and Harrisburg, PA ........... 82 iii | TranSystems
  • 5.
    Translinked Freight Study Executive Summary 1 EXECUTIVE SUMMARY 1.1 Translinked The Detroit Regional Chamber is one of the largest chambers of commerce in the country. The Chamber seeks to power the economy of southeast Michigan through economic development programs, advocacy, strategic partnerships and valuable member benefits. One key initiative of the Detroit Regional Chamber’s Economic Development activities is Translinked. The goal of Translinked is to create an industry cluster of excellence around transportation, distribution and logistics in the region comprising southeast Michigan, northwest Ohio and southwest Ontario. The Translinked strategy envisions the mobilization of public, private and academic resources around a consensus on the physical, financial and institutional infrastructure necessary to create this cluster. This initiative seeks to attract more freight, perform value-added service and become a key intermodal supply hub. The overall goal of Translinked is to create an efficient and cost-effective first-tier multimodal transportation and logistics hub in southeast Michigan, northwest Ohio and southwest Ontario. Translinked is supported by the Michigan Economic Development Corporation (MEDC), the New Economy Initiative (NEI), and the Detroit Regional Chamber. The Translinked region (Figure 1-1) includes major freight centers, including Detroit, Ann Arbor, Lansing, Flint and Port Huron in Michigan, Toledo in Ohio and Windsor and Sarnia in Ontario, Canada. The region encompasses major manufacturing activity (e.g. the automotive industry) and is situated on the principal border Figure 1-1: Map of Translinked Region crossings for overland trade between the United States and Canada. A comprehensive set of freight infrastructure supports regional economic activity, including rail and road border crossings, airports, marine ports, rail yards, and interstate highways and rail corridors. The region is also connected by rail and highway to major U.S. and Canadian international sea ports, including New York/New Jersey, Halifax, Montreal and Norfolk on the East Coast. The Translinked Freight Study provides, subject to the availability of data on regional freight movements, a data- driven analysis of existing regional freight movements, an assessment of key freight industry trends, and makes recommendations on how to further develop the Translinked region. Source: Detroit Regional Chamber 1 | TranSystems
  • 6.
    Translinked Freight Study Executive Summary 1.2 Recommendations The evaluation of freight flows and industry trends drive the following recommendations for future development of the Translinked initiative: Establish a Translinked Commercial Marketing Initiative Involve the Private Sector, Remove Barriers that Slow Down Decision Making Remove Variability from the Border Crossing Process Include Rail Facilities and Third Party Logistics Providers (3PLs) that Reduce Transportation Costs, and Increase Flexibility Marketing Initiative and Freight Corridors The recommendations and next steps are discussed below. Establish a Translinked Commercial Marketing Initiative Translinked opportunities are with companies that have specific distribution needs, such as a high concentration of customers in Northern Michigan, over to Toronto, and including the US Midwest. Companies that require fastest ocean transits from China or Europe, especially for high value goods, or manufacturers that receive materials used in production from nearby sources are potential candidates. Next Steps: Develop Translinked Marketing Plan TranSystems recommends a detailed, company by company analysis to identify opportunities based on the specific advantages of the Translinked region. Develop a list of potential Translinked customers. Identifying and selling value will require detailed knowledge of the customer’s business, particularly its supply chain; and facts about the customer’s inventory and supply chain strategy. Carefully identify (segment) beneficial cargo owners (BCO) with high costs, complicated supply chains, or poor inventory performance. Conduct private sector outreach to gather input. Develop supply chain straw-men using various distribution strategies and present them to shippers to assess the viability of Translinked as a supply chain hub. Demonstrate how a Translinked location reduces lowest landed costs. Present regional advantages, such as the CSX intermodal facility in North Baltimore, OH to private sector logistics managers. Once strategies are validated, market regional advantages in industry publications, such as DC Velocity, Inbound Logistics, Journal of Commerce, and American Shipper. The KC (Kansas City) Smartport initiative is an excellent model for marketing strategies that may be applicable to the Translinked initiative. Involve the Private Sector, Remove Barriers that Slow Down Decision Making Time is of the essence. Comments made during interviews as part of this study suggest there is a perception that the overall direction and ownership of Translinked is unclear, and the initiative lacks sufficient involvement from commercial interests. Commercial participation will be necessary to lend support and 2 | TranSystems
  • 7.
    Translinked Freight Study Executive Summary credibility to the project. It should be noted that recent improvements in Ohio, such as CSX’s Northwest Ohio Intermodal Terminal at North Baltimore, Norfolk Sothern’s Heartland Corridor Initiative serving Columbus, and BNSF’s Chicago rail terminal adjacent to the CenterPoint Intermodal Park have been noticed in the industry. Successes in the Translinked region itself, such as improvements at the Port of Toledo, have been attributed to public/private cooperation and agreed priorities. Barriers impeding Translinked progress should be identified, and addressed. Slow-moving initiatives will lose out to locations that are established, and proven, and that have active engagement with the private sector. Next Steps: Identify and Remove Barriers to Progress Focus and prioritize opportunities based on strengths identified in the Marketing Plan, and gather private sector support as quickly as possible. Solicit active and ongoing participation on the Translinked committee from companies such as railroads and third party logistics companies to provide a sense of what is commercially viable. The CN Railroad for example actively participated in the design, and invested $25 million in the new West Coast ocean terminal at Prince Rupert, BC - private investment will signal commercial viability. The Detroit Intermodal Freight Terminal (DIFT) may be another example of a successful transportation related public/private development. Public sector involvement and coordination is crucial, but all parties should adhere to commercially based priorities. A failure to agree on priorities may signal an inability to move the project forward, and a review of Translinked overall goals and makeup is advised. Remove Variability from the Border Crossing Process Supply chain managers work to eliminate events that introduce variability into supply chains. The Translinked region opportunities will be aided by addressing perceptions about the unpredictability of border crossings. The inclusion of the Toronto area population of 5 million within a distribution range served by the Translinked region will elevate the effectiveness of the region as a transportation hub. Therefore, addressing perceptions about unpredictable crossing delays is critical. Next Steps: Assess and Manage Border Crossing Perception As part of the development of the Translinked Sales/Marketing plan, gather border crossing information, including an assessment of perceived vs. real barriers, expected delays, and suggestions for improvement. Based on this input, develop strategies to correct misconceptions about crossing delays, or work with US and Canadian customs agencies to develop programs that reduce variability in border wait times. An evaluation of the effectiveness of the Fast Past program, which allows truckers to us the “FAST” lane, and reduces the amount of paperwork, should be included in the analysis. 3 | TranSystems
  • 8.
    Translinked Freight Study Executive Summary Include Rail Facilities and Third Party Logistics Providers (3PLs) that Reduce Transportation Costs, and Increase Flexibility Distribution centers (DC) on-site at rail terminals, including multiple rail carriers, will reduce truck drayage costs. Include railroads and shippers in terminal location and design discussions. The presence of 3PL services, such as warehouse and distribution services, will enable shippers to introduce flexibility to their supply chains and will provide distribution options in the Translinked region without requiring shippers to commit capital to an owned facility. Next Steps: Confirm importance of the Detroit Intermodal Freight Terminal (DIFT) during the development of the Translinked Marketing and Sales Plan. Revitalize and develop a sense of urgency around the DIFT rail project if potential users are attracted to this kind of facility. Explore willingness of large DCs, trucking companies; 3PL’s to locate near new DIFT facility, and zone appropriately if needed to support logistics facilities. Marketing Initiative and Freight Corridors The Translinked region is strategically located on several major trade corridors, notably cross-border with Canada. In addition, the region’s consumers and industry are served by several important port gateways in the U.S. (e.g. ports of New York/New Jersey, Norfolk and Los Angeles/Long Beach) and Canada (the ports of Halifax, Montreal and Prince Rupert). In developing the Translinked marketing initiative discussed above, focus should be placed on companies that could benefit from the following freight corridors: International trade via: − Canadian ports of Halifax, Montreal and Prince Rupert. − U.S. Northeast ports, notably New York/New Jersey, Norfolk, and Baltimore. Investments in rail infrastructure by CSX and NS are making these gateways even more accessible for the Translinked region. − U.S. West Coast ports, which are the principal gateways for U.S. trade with the Far East. Highway and rail corridors serving major consumption markets in the U.S. Cross-border highway and rail corridors with major consumption markets in Canada, notably markets in Ontario. The marketing initiative should also incorporate testing the perceived value of the different North American Gateways, such as the Prince Rupert Gateway, with the fastest transit from China, or the Halifax Gateway, and evaluate shipper preferences of North American gateways into the study area. The market strategy initiative should include shippers who transport the fastest growing commodities. For example, Machinery and Parts Manufacturing, and Electronics Manufacturing have projected ten-year annual growth rates of 4.4 percent and 5.0 percent respectively. Keep in mind that these growth rates may reflect a recovery from steep declines experienced during the economic downturn; however, logistics service opportunities may emerge as the recovery continues. 4 | TranSystems
  • 9.
    Translinked Freight Study Executive Summary 1.3 Regional Freight Flows Regional economic activity generates inbound, outbound and internal freight flows. The Translinked region also sees freight moving through the region between Canada and the rest of the U.S. An overview of selected regional freight flows in 2009, the latest year for Transearch Freight Data1, is presented in Table 1-1. The main characteristics of freight flows are discussed below. Table 1-1: Selected Regional Freight Flows in 2009 Tons by Tons by Tons by Tons by Other Total Total Tons Truck Rail Water Modes Value Detroit BEA Freight Flows in 2009 (Million Tons and Billion $) Total 286.60 206.07 52.81 26.60 1.12 $413.5 1 Domestic 212.00 160.42 30.85 20.69 0.04 $248.8 Inbound 107.54 66.10 22.44 18.99 0.02 $107.1 Outbound 51.30 42.00 8.20 1.07 0.02 $101.7 Internal 47.07 46.22 0.21 0.63 0.00 $26.1 Through 6.09 6.09 0.00 0.00 0.00 $13.9 Canada 54.02 34.09 18.85 0.00 1.08 $129.7 Inbound 5.97 3.37 1.95 0.00 0.65 $18.3 Outbound 3.16 2.40 0.39 0.00 0.37 $10.7 Through 44.89 28.32 16.51 0.00 0.06 $100.7 Mexico 2.64 1.12 1.52 0.00 0.00 $14.0 Inbound 1.63 0.56 1.07 0.00 0.00 $10.1 Outbound 0.94 0.49 0.45 0.00 0.00 $3.6 Through 0.08 0.07 0.01 0.00 0.00 $0.2 Import & Export 2 17.93 10.44 1.59 5.91 0.00 $21.1 Detroit BEA – Toledo BEA Freight Flows in 2009 (Million Tons and Billion $) Total 3 15.81 14.57 0.35 0.89 0.00 $6.95 Inbound 10.84 9.82 0.14 0.88 0.00 $4.47 Outbound 4.97 4.74 0.21 0.01 0.00 $2.47 Detroit BEA – Windsor CMA Freight Flows in 2009 (Million Tons and Billion $) 4 Total 1.42 1.16 0.19 0.00 0.07 $4.75 Inbound 0.25 0.19 0.06 0.00 0.00 $1.28 Outbound 0.18 0.13 0.00 0.00 0.05 $0.39 Through 0.99 0.83 0.13 0.00 0.02 $3.08 (1) Domestic flows include some international cargo that moves as “domestic” freight – e.g. overseas imports moving in domestic 53-foot containers from the U.S. discharge port to the Detroit BEA. (2) Overseas import and export cargo that moves intact between U.S. ports and the Detroit BEA. (3) Freight moving between the Detroit BEA and the Toledo BEA. (4) Freight moving between the Detroit BEA and the Windsor CMA, and freight moving through the Detroit BEA between the Windsor CMA and the rest of the U.S. Source: IHS Global Insight Transearch Data 1 This Study includes content supplied by IHS Global Insight (USA), Inc; Copyright 2011 IHS Global Insight (USA), Inc. 5 | TranSystems
  • 10.
    Translinked Freight Study Executive Summary Detroit BEA Freight Flows The Detroit-Warren-Flint Business Economic Area Figure 1-2: Detroit BEA Cargo in 2009 by (Detroit BEA) covers the cities of Detroit, Flint and Transport Mode Warren, and surrounding areas. The Detroit BEA had total estimated cargo flows amounting to 287 million tons in 2009 with an estimated value of $414 billion. Total cargo comprises several different transport modes – truck, rail, water (via the Great Lakes), air and other – and includes all trade flows, domestic and international, inbound, outbound, internal (movements within the Detroit BEA) and through (not stopping in the Detroit BEA). Truck is the dominant mode with 72 percent of cargo volume and 81 percent of cargo value, the larger share of value reflecting the higher-value commodities that move via truck. Rail handles both lower-value and higher-value commodities, and it accounts for 18 percent of both volume and value. The water mode accounts for 9 percent of tons but less than one percent of value due to the low-value Note: Includes domestic and international, and all directions bulk commodities shipped by water. The highest – inbound, outbound, internal and through value freight is shipped by air. Source: Derived from IHS Global Insight Transearch Data Total cargo is spread across different directions and trades (Figure 1-3). Domestic cargo accounts for 74 percent of total tons and 60 percent of value. Domestic cargo includes some international cargo that moves as domestic freight to or from U.S. ports (e.g. New York/New Jersey). International trade related to Canada accounted for 19 percent of tons and 31 percent of value, while international trade with Mexico was one percent of tons and 3 percent of value. Import and Export trade that moves intact to and from U.S. ports accounted for 6 percent of tons and 5 percent of value. Inbound and outbound cargo amounted to 183 million tons in 2009 with an estimated value of $270 billion. These flows are driven by industry and consumption, and generate the principal demand for warehousing and logistics facilities. The largest directional flow is inbound to the Detroit BEA. The region also has a large volume of internal cargo movement (18 percent of total tons and 7 percent of value), a significant share of which is truck shipments to and from warehouses within the region and drayage of containers to and from intermodal rail yards. A large amount of cargo also moves through the Detroit BEA, notably between Canada and other regions of the U.S., and is handled by the border crossing points in the Detroit BEA. 6 | TranSystems
  • 11.
    Translinked Freight Study Executive Summary Figure 1-3: Detroit BEA Cargo in 2009 by Trade Flow Source: Derived from IHS Global Insight Transearch Data When evaluating the region’s cargo, it is helpful to focus on commodities that are more suited to Figure 1-4: Detroit BEA Cargo Tons in 2009, added-value logistics services or undergo some form Total and Warehouse-able of manufacturing process. Such commodities will be of primary interest to the development of industry and logistics services. The broadly defined “warehouse-able” commodities are those with a relatively high value per metric ton and/or commodities that are processed (e.g. food products) as opposed to raw materials (e.g. grain). These commodities are more likely to require added-value logistics services. Warehouse-able cargo was an estimated 141 million tons in 2009, 49 percent of total Detroit BEA cargo. Warehouse-able cargo accounted for an estimated 90 percent of total cargo value, which reflects the higher value nature of warehouse-able commodities (e.g. consumer products). These commodities accounted for 42 percent of inbound tons, and their Source: Derived from IHS Global Insight Transearch Data share was highest in the cross-border inbound trade – 64 percent of tons from Canada and 99 percent of tons from Mexico – and compared to 41 percent of domestic inbound tons. Warehouse-able commodities accounted for 66 percent of total outbound tons. Penetration by trade was – domestic outbound 68 percent of domestic tons, shipments to Canada 48 percent and shipments to Mexico 87 percent. 7 | TranSystems
  • 12.
    Translinked Freight Study Executive Summary Detroit BEA Freight Flow Forecast The forecast of inbound and outbound freight (warehouse-able) commodities is presented in Table 1-2. The Base projections of cargo flows driven by assumptions related to regional, national and international economic activity, and relationships between industry inputs and outputs. Total inbound and outbound freight is projected to have increased from 89.9 million tons in 2009 to 97.8 million tons in 2010, driven by recovery from the recession and growth of industries in the region. Total inbound and outbound freight is projected to increase to 126.0 million tons in 2020, based on domestic economic growth and the expansion of cross-border trade with Mexico and Canada, and growth of trade with overseas markets. The projected 10-year (2010 to 2020) compound annual growth rate (CAGR) is 2.6 percent. Table 1-2: Inbound and Outbound Freight Forecast for 2020 – Base, Low and High Inbound Freight (Warehouse-able Commodities) 2020 Tons CAGR 2010 to 2020 Trade 2009 Tons 2010 Tons Base Low High Base Low High Domestic 44,334,660 47,678,414 59,970,374 57,318,605 63,775,639 2.3% 1.9% 3.0% Canada 3,835,424 4,232,502 5,513,774 5,127,613 5,798,233 2.7% 1.9% 3.2% Mexico 1,613,233 1,761,005 2,981,832 2,708,501 3,145,764 5.4% 4.4% 6.0% Import 1,205,197 1,343,248 2,028,841 1,859,298 2,273,105 4.2% 3.3% 5.4% Grand Total 50,988,514 55,015,169 70,494,821 67,014,016 74,992,742 2.5% 2.0% 3.1% Outbound Freight (Warehouse-able Commodities) 2020 Tons CAGR 2010 to 2020 Trade 2009 Tons 2010 Tons Base Low High Base Low High Domestic 34,989,373 38,422,157 49,083,371 44,989,601 51,752,543 2.5% 1.6% 3.0% Canada 1,512,627 1,665,247 2,218,630 2,059,365 2,308,990 2.9% 2.1% 3.3% Mexico 812,665 927,945 1,451,046 1,369,738 1,658,503 4.6% 4.0% 6.0% Export 1,581,080 1,796,395 2,756,368 2,495,304 3,036,918 4.4% 3.3% 5.4% Grand Total 38,895,745 42,811,744 55,509,415 50,914,008 58,756,955 2.6% 1.7% 3.2% Inbound & Outbound Freight (Warehouse-able Commodities) 2020 Tons CAGR 2010 to 2020 Trade 2009 Tons 2010 Tons Base Low High Base Low High Domestic 79,324,033 86,100,571 109,053,745 102,308,206 115,528,183 2.4% 1.7% 3.0% Canada 5,348,051 5,897,749 7,732,404 7,186,977 8,107,223 2.7% 2.0% 3.2% Mexico 2,425,898 2,688,950 4,432,877 4,078,239 4,804,267 5.1% 4.3% 6.0% Import & Export 2,786,277 3,139,643 4,785,209 4,354,602 5,310,023 4.3% 3.3% 5.4% Grand Total 89,884,258 97,826,912 126,004,235 117,928,024 133,749,697 2.6% 1.9% 3.2% Source: TranSystems Forecasts and IHS Global Insight 2009 data. Low and high case projections are also presented in Table 1-2. The basis for these alternative projections is that the principal driver of freight flows is economic activity, represented by indicators such as disposable income and industrial production. In addition, housing-sensitive commodities are subject to more uncertainties going forward due to uncertainty as to the timing of recovery in regional housing markets. In general, the sensitivities for non-housing related commodities (e.g. transportation equipment) are -0.5to +0.5 percent per year. Secondary traffic is assumed to be 25 percent housing-related and the sensitivities are 8 | TranSystems
  • 13.
    Translinked Freight Study Executive Summary -0.2 to +1.5 percent per year. The growth sensitivities for international flows are -1.5 to +1.5 percent per year. A stronger recovery in regional, national and international economic activity would be expected to drive a healthy growth of international trade. Total inbound and outbound shipments of warehouse-able commodities are projected to have 10-year compound annual growth rates of 1.9 percent under the Low Case and 3.2 percent under the High Case. The projections indicate that truck shipments will grow at a slightly faster rate than shipments by rail. This result is driven by several factors – (1) the macro nature of the forecast models, with their underlying assumptions on industry input and output relationships, and fixed modal shares for individual commodities, (2) the large amount of freight moving between the region and truck friendly origins and destinations in the East North Central region, and (3) the current transportation mode distribution. However, the macro forecast models do not take into account significant transportation industry factors that are expected to accelerate the growth of rail usage. The trucking industry is faced with several challenges that are encouraging shippers to expand the use of rail in their supply chains. These factors include fuel price increases, favoring rail over highway transport, the cost of recruiting and maintaining truck drivers, investments by railroads in intermodal rail hubs tied to logistics parks, and increased marketing and attractive pricing by railroads of shorter haul intermodal rail services. For these reasons, it is likely that the use of rail in the supply chain strategies of shippers will expand in the future. Detroit BEA – Toledo BEA In 2009, 15.0 million tons of domestic freight moved between the Detroit BEA and the Toledo BEA, 10.4 million tons inbound from the Detroit BEA and 4.6 million tons outbound from the Detroit BEA. Truck is the dominant mode accounting for 92 percent of inbound freight and 96 percent of outbound freight. Detroit BEA – Windsor CMA The Windsor area has a diversified economy with a strong presence in the automotive sector, agriculture, and food products, and emerging sectors that include high tech manufacturing. A total of 1.4 million tons of freight moves to and from the Detroit BEA, and to and from other regions of the U.S through the Detroit BEA. Truck is the dominant mode of transport, accounting for 88 percent of freight shipped to the Windsor CMA and 72 percent of the tons shipped from the Windsor CMA. The respective shares for rail were 5 percent and 28 percent. 1.4 Industry Trends and Location Comparison Logistics managers are continuously evaluating their logistics networks to squeeze excess transportation expenses and other costs out of their supply chains. The availability of all transportation modes is essential in order to enable logistics managers to have the flexibility to choose the mode that best suits shipment needs. Lowest-cost transportation options, such as rail, are selected provided that service is available, and transit time and reliability meet service level requirements. Trucking costs are the largest portion of the supply chain expense. Locating DCs in high-density customer/supplier areas reduces trucking expenses enough to more than compensate for lower ocean and rail costs to competing regions. Because of this, supply chain strategies that reduce trucking as much as possible have been a major goal of supply chain managers. Warehouse locations are chosen based on the cost of the facility, and their proximity to customers and suppliers, thereby reducing trucking costs. Labor, green initiatives, government incentives, etc. are considered after transportation service and rate level requirements are met, and these considerations typically influence a specific site location among competing sites that meet transportation requirements. 9 | TranSystems
  • 14.
    Translinked Freight Study Executive Summary The Translinked region performs well under a variety of criteria used by shippers and manufacturers to select locations, including transportation infrastructure (rail and highway and airports), access to ocean gateways for international trade, and the availability of warehousing and distribution facilities. The Translinked region must compete against two regional hubs – Columbus, OH, and Chicago, IL – that are well established and in a strong position to compete for DC operations in the Midwest. Columbus has a higher U.S. and Canadian population reach, and Chicago has superior rail and air cargo services, as well as a large Midwest distribution reach. Both of these locations have competitive labor and industrial real estate costs as well. Translinked region opportunities are with companies with specific distribution needs, such as a high concentration of customers in Northern Michigan, over to Toronto, and including parts of the U.S. Midwest. Companies that require fastest ocean transits from China or Europe, or manufacturers that receive materials used in production from nearby sources are other potential candidates. Figure 1-5: 10-Hour Truck Drive-Time Area Comparison: Detroit, MI, Chicago, IL, Columbus, OH, and Harrisburg, PA Source: TranSystems 10 | TranSystems
  • 15.
    Translinked Freight Study Existing Freight Flows 2 DETROIT BEA FREIGHT FLOWS 2.1 Introduction The first step in the evaluation of freight flows is to address the Detroit BEA2, which encompasses the main Translinked centers of Detroit, Flint, Ann Arbor, Lansing and Port Huron. As shown in Figure 2-1, the Detroit BEA covers the eastern portion Michigan and the major freight corridors through Southeast Michigan. Figure 2-1: Map of Detroit BEA Source: TranSystems The primary source for freight flows related to the Detroit BEA is the Transearch Database from IHS Global Insight3. This database provides statistics on domestic freight flows, and cross-border freight flows with Canada and Mexico. The latest year available for this study was 2009, which was a depressed year for 2 BEAs are designated by the Department of Commerce and each Economic Area represents a major economic center 3 This Study includes content supplied by IHS Global Insight (USA), Inc; Copyright 2011 IHS Global Insight (USA), Inc. 11 | TranSystems
  • 16.
    Translinked Freight Study Existing Freight Flows economic activity and freight activity. However, the database is still appropriate for providing a profile of freight flows related to the Detroit BEA. This database is supplemented by statistics on U.S. containerized trade from JOC Piers and data on cross-border flows from the Bureau of Transportation Statistics. 2.2 Detroit BEA Total Cargo The Detroit-Warren-Flint Business Economic Area (Detroit BEA) covers the cities of Detroit, Flint and Warren, and surrounding areas. It had a population of 6.9 million in 2009, with Total Personal Income (TPI) of $247 billion, and per capita income of $35,713.4 The Detroit BEA ranked 10th by population, 12th by TPI and 75th by per capita income out of the country’s 179 BEAs tracked by the Bureau of Economic Analysis. The Detroit BEA borders five other BEAs5 that had a combined population of 4.2 million in 2009, generating TPI of $134 billion, and per capita income of $31,738. The Detroit BEA had total estimated cargo flows Figure 2-2: Detroit BEA Cargo in 2009 by amounting to 287 million tons in 2009 with an Transport Mode estimated value of $414 billion. Total cargo comprises several different transport modes (Figure 2-2) – truck, rail, water (via the Great Lakes), air and other – and includes all trade flows, domestic and international, inbound, outbound, internal (movements within the Detroit BEA) and through (not stopping in the Detroit BEA). Truck is the dominant mode with 72 percent of cargo volume and 81 percent of cargo value, the larger share of value reflecting the higher-value commodities that move via truck. Rail handles both lower-value and higher-value commodities, and it accounts for 18 percent of both volume and value. The water mode accounts for 9 percent of tons but less than one percent of value due to the low-value bulk commodities (e.g. iron ore) shipped by water. The highest value freight is shipped by air, but air only handles 0.03 percent of total tons and 0.35 Note: Includes domestic and international, and all directions percent of total value. In 2009, the values per cargo – inbound, outbound, internal and through ton by transport mode were $1,616 for truck, Source: Derived from IHS Global Insight Transearch Data $1,456 for rail, $63 for water, and $17,445 for air. As shown in Figure 2-3, total cargo is spread across different directions and trades. Domestic cargo accounts for 74 percent of total tons and 60 percent of value. Domestic cargo includes some international cargo that moves as domestic freight to or from U.S. ports (e.g. New York/New Jersey). For example, an import will be “converted” to domestic freight when it, for example, enters an import distribution center (IDC) and then departs the IDC in domestic equipment for the Detroit BEA. International trade related to Canada accounted for 19 percent of tons and 31 percent of value, while international trade with Mexico was 1 percent of tons and 3 percent of value. Import and Export trade that 4 Data is for 2009 from the Bureau of Economic Analysis 5 Alpena, Traverses City, Grand Rapids-Muskegon-Holland, Fort Wayne-Huntington-Auburn, and Toledo-Fremont 12 | TranSystems
  • 17.
    Translinked Freight Study Existing Freight Flows moves intact to and from U.S. ports accounted for 6 percent of tons and 5 percent of value. For example, this trade flow includes imports and exports moving in international marine containers by intermodal rail service between the Detroit BEA and U.S. ports. The main cargo flows of interest in this Study are inbound and outbound, which together amounted to 183 million tons in 2009 with an estimated value of $270 billion, 64 percent of total tons and 65 percent of total cargo value. These flows are driven by industry and consumption, and generate the principal demand for warehousing and logistics facilities, within the Detroit BEA. The largest directional flow is inbound to the Detroit BEA, 43 percent of tons and 36 percent of value. Outbound flows account for 21 percent of tons and 29 percent of value, the higher share of value driven by the presence of higher value manufactured goods in the outbound trade from the Detroit BEA. The region also has a large volume of internal cargo movement, 18 percent of total tons and 7 percent of value. Nearly 70 percent of internal traffic is truck shipments to and from warehouses within the region (for example, deliveries from warehouses to stores), drayage of containers to and from intermodal rail yards, and movements of petroleum refining products. The internal cargo category includes an element of double counting of the inbound and outbound flows. For example, an inbound shipment enters a warehouse in the Detroit BEA and then departs the warehouse as a local delivery to a store or manufacturing plant. There is also a large amount of cargo moving through the Detroit BEA, notably between Canada and other regions of the U.S., and handled by the border crossing points in the Detroit BEA. Through freight is generated by economic activity unrelated to the Detroit BEA. Figure 2-3: Detroit BEA Cargo in 2009 by Trade Flow Source: Derived from IHS Global Insight Transearch Data The cargo flows identified above have considerable variation in terms of value per cargo ton. While domestic inbound is the largest cargo flow it has one of the lowest values per cargo ton due to the presence of a large volume of lower-value commodities. By contrast, higher-value commodities dominate the international cargo flows. As shown in Figure 2-4, the highest values per cargo ton are present in the cross- 13 | TranSystems
  • 18.
    Translinked Freight Study Existing Freight Flows border trade with Mexico and Canada, due to the large presence movement of manufactured goods in Figure 2-4: Value per Cargo Tons these lanes. When evaluating the region’s cargo, it is helpful to focus on commodities that are more suited to added-value logistics services or undergo some form of manufacturing process. Such commodities will be of primary interest to the development of industry and logistics services in the Detroit BEA. The broadly defined “warehouse-able” commodities are those with a relatively high value per metric ton and/or commodities that are processed (e.g. food products) as opposed to raw materials (e.g. grain). These commodities are more likely to require added-value logistics services including warehousing and distribution services. Commodity groups are identified as warehouse- able (Table 2-1) based on value per ton data, Source: Derived from IHS Global Insight Transearch Data commodity characteristics and judgment using experience from prior projects. Given the broad commodity groups in the source data, a commodity group may contain a mixture of higher value and lower value components. Table 2-1: Warehouse-able Commodities Warehouse-able Commodity Groups Other Commodity Groups (Higher Value / Distribution Potential) (Lower Value / Distribution Potential) Alcoholic Beverages Pharmaceutical Products Agricultural Products Petroleum Products All Other Machinery Plastics And Rubber Base Metal Rocks Stone And Sand Base Metal Articles Printed Materials Cereals Wood Products Food Products Textiles And Articles Chemical Products Waste And Scrap Electronics Tobacco Products Coal Furniture Transportation Equipment Fertilizer Live Animals And Fish Vehicles And Parts Logs And Rough Lumber Misc Manufactured Prod Mineral Products Source: TranSystems Warehouse-able cargo was an estimated 141 million tons in 2009, 49 percent of total Detroit BEA cargo. Warehouse-able cargo accounted for an estimated 90 percent of total cargo value, which reflects the higher value nature of warehouse-able commodities (e.g. consumer products). 14 | TranSystems
  • 19.
    Translinked Freight Study Existing Freight Flows The distribution of warehouse-able commodities by Figure 2-5: Detroit BEA Cargo Tons in 2009, direction is shown in Figure 2-5. Looking at the Total and Warehouse-able inbound flow, these commodities accounted for 42 percent of inbound tons. Their share was highest in the cross-border inbound trade – 64 percent of tons from Canada and 99 percent of tons from Mexico – and compared to 41 percent of domestic inbound tons. Warehouse-able commodities accounted for 66 percent of total outbound tons. Penetration by trade was – domestic outbound 68 percent of domestic tons, shipments to Canada 48 percent and shipments to Mexico 87 percent. Warehouse-able commodities are also a prominent part of through cargo, with a 71 percent share. Through cargo is mostly freight moving between Canada and other parts of the U.S. More detailed discussion of cargo flows, with an emphasis on Source: Derived from IHS Global Insight Transearch Data inbound and outbound flows, is provided in Section 2.3 (truck cargo), Section 2.4 (rail cargo), and Section 2.5 (other modes). 15 | TranSystems
  • 20.
    Translinked Freight Study Existing Freight Flows 2.3 Detroit BEA Truck Cargo 2.3.1 Total Truck is the dominant transportation mode for freight moving in, out, within and through the Detroit BEA, accounting for 72 percent of tons and 81 percent of cargo value in 2009. This truck freight is generated by local consumption and industrial production, local and regional distribution, and freight movements through the Detroit BEA between other regions (e.g. Canada to other parts of the U.S.). Total truck freight amounted to 206 million tons with a total value of $333 billion. Truck cargo comprises a variety of flows and truck modes as shown in Figure 2-6. The largest segment by tonnage is domestic inbound freight, which accounted for 32 percent of tons in 2009 and 29 percent of total value. This segment is followed by domestic internal6 (22 percent and 8 percent), and domestic outbound (22 percent and 8 percent). Truck freight related to Canada (inbound, outbound and through) is also significant with 17 percent of tons and 30 percent of value; Canada’s larger share of value is due to the shipment of manufactured goods, notably finished motor vehicles and motor vehicle parts and accessories. Figure 2-6: Detroit BEA Truck Cargo by Trade Flow in 2009 Note: Canada and Mexico is classified as Truck, which captures both truckload and LTL service. Source: Derived from IHS Global Insight Transearch Data Truck cargo moves by several different truck modes – truckload, less-than-truckload (LTL), private fleet, and truck (freight moving to and from Mexico and Canada). Private fleet involves freight handled by private in- house truck fleets, such as those operated by retailers, as opposed to commercial common carrier truckload services. LTL is a relatively specialist sector involving the transport of higher value and/or time sensitive and/or small volume freight. Trade with Canada and Mexico is classified under a general “Truck” category and this cargo is largely moved by commercial truckload service. Truckload freight is the principal 6 Freight with its origin and destination within the Detroit BEA 16 | TranSystems
  • 21.
    Translinked Freight Study Existing Freight Flows truck mode with 44 percent of both cargo tons and value. Private Fleet truck shipments are the second largest truck mode measured by tons (38 percent) and the third largest by value (23 percent), which reflects the lower value basic materials (e.g. gravel and sand) that are a significant amount of this truck mode. A profile of regional truck cargo (domestic and international, all directions) by commodity group is provided in Figure 2-7. The largest commodity group is Nonmetallic Minerals, which amounted to 31 million tons in 2009 and 15 percent of the region’s truck cargo, and involves shipments of low value materials including sand and gravel. The second largest commodity group is Secondary Traffic (28 million tons and 14 percent), which is largely made up of Warehouse and Distribution Center traffic (for example, deliveries of consumer products from warehouses to stores) but also includes some freight drayage related to intermodal rail yards and airports. Farm Products (28 million tons and 14 percent) includes grains, livestock, fruits and vegetables, and other agricultural products. Food or Kindred Products (11 percent) includes a blend of intermediary products for further processing and final products, and examples are animal by-products, pet food, fresh/chilled/frozen meat, soft drinks and mineral water, and canned fruits and vegetables. The top four commodity groups are then followed by a mixture of industrial inputs and outputs – chemicals, petroleum and coal, primary metal products, etc. Transportation Equipment (ranked eighth with 4 percent of truck tons) captures the shipment of Motor Vehicles and Motor Vehicle Parts or Accessories by truck. The commodity ranking shifts when a filter is applied to identify the warehouse-able commodities, those suited to warehousing and logistics services (see background discussion in Section 2.XX). Secondary Traffic becomes the top commodity group and bulk-focused commodities fall down the rankings (e.g. Farm Products and Nonmetallic Minerals). The second and third ranked commodity groups are Food or Kindred Products and Chemicals or Allied Products. Further analysis of commodities, with a focus on the warehouse-able commodities, is provided in the discussion of domestic and international truck flows by direction (inbound, outbound, etc.) presented below. Figure 2-7: Detroit BEA Truck Cargo in 2009 – Top Ten Commodity Groups Source: Derived from IHS Global Insight Transearch Data 17 | TranSystems
  • 22.
    Translinked Freight Study Existing Freight Flows 2.3.2 Domestic Inbound and Outbound Domestic inbound and outbound flows together account for 52 percent of truck cargo tons related to the Detroit BEA. This cargo is generated by industry and consumption within the Detroit BEA, and demand in the rest of the country. In 2009, the Detroit BEA had inbound truck cargo of 66 million tons with an estimated value of $95 billion. Approximately 41 million tons (62 percent) with a value of $87 billion (92 percent) is classified as warehouse-able cargo. As shown in Figure 2-8, nearly all the top commodity groups shipped inbound to the Detroit BEA fall into the warehouse-able category. Some of the more significant individual warehouse-able commodities are Warehouse and Distribution Center freight, a variety of dry food products (e.g. soft drinks and canned goods), Motor Vehicle Parts and Accessories, and Forest Products. The lower-value and defined as non-warehouse-able commodities include Grains, Broken Stone and Riprap and Petroleum Refining Products. The Detroit BEA generated 42 million tons of outbound cargo with a value of $76 billion in 2009. An estimated 31 million tons (74 percent) with a value of $73 billion (95 percent) was defined as warehouse- able cargo. The top outbound commodity group (Figure 2-8) was Secondary Traffic, nearly all falling into the Warehouse and Distribution Center category. Other individual outbound warehouse-able commodities include Grain Mill Products, Motor Vehicles, and Motor Vehicle Parts and Accessories. Figure 2-8: Detroit BEA Inbound and Outbound Truck Cargo in 2009 – Top 20 Commodity Groups Source: Derived from IHS Global Insight Transearch Data 18 | TranSystems
  • 23.
    Translinked Freight Study Existing Freight Flows Domestic inbound and outbound truck freight is heavily concentrated in short-haul lanes with regions surrounding the Detroit BEA. Figure 2-9 shows the top partner BEAs measured by tons. Based on 2009 data, the top-ten partner BEAs accounted for 70 percent of inbound and outbound truck tonnage, and all these BEAs were in the states of Michigan, Ohio, Illinois and Indiana. The next ten BEAs accounted for 12 percent of inbound and outbound freight, and four of these BEAs were in Ohio and Wisconsin. More distant BEAs ranked in the top-twenty were New York, Buffalo, Pittsburg, Los Angeles, Rochester and Minneapolis. The distribution by lane is little changed when focusing on the warehouse-able commodity segment. As also shown in Figure 2-9, the top ten part BEAs are all in Michigan, Ohio, Indiana and Illinois, and they accounted for 68 percent of warehouse-able cargo tons. Prominent among the partner BEAs are important logistics hubs, including Chicago, IL. Figure 2-9: Detroit BEA Inbound and Outbound Truck Cargo in 2009 – Top 20 Freight Lanes Source: Derived from IHS Global Insight Transearch Data 19 | TranSystems
  • 24.
    Translinked Freight Study Existing Freight Flows Figure 2-10: Domestic Inbound Truck Freight 20 | TranSystems
  • 25.
    Translinked Freight Study Existing Freight Flows Figure 2-11: Domestic Outbound Truck Freight 21 | TranSystems
  • 26.
    Translinked Freight Study Existing Freight Flows 2.3.3 Domestic Internal and Through Cargo The Detroit BEA had internal7 truck cargo of 46 million tons with an estimated value of $26 billion. Much of this traffic is of lower value commodities and the largest commodity is Nonmetallic Minerals (17.1 million tons). Other main commodity groups are Secondary Traffic (7.1 million tons), Farm Products (6.5 million tons), Petroleum or Coal Products (6.4 million tons), Clay, Concrete, Glass or Stone (4.1 million tons), Chemicals or Allied Products (1.5 million tons), Lumber or Wood Products (1.3 million tons), and Waste or Scrap Materials (1.0 million tons). Higher-value warehouse-able cargo was an estimated 13 million tons (28 percent) and accounted for 75 percent of the value of internal cargo. The largest component of the warehouse-able cargo is Secondary Traffic, which is made up of Warehouse and Distribution Center traffic (5.6 million tons), drayage of rail intermodal cargo to and from ramps (1.5 million tons), and a small amount of air freight drayage. A large volume of domestic cargo flows through the Detroit BEA without stopping. In 2009, this domestic through cargo amounted to 6.1 million tons with an estimated value of $14 billion. A majority of this cargo, 4.7 million tons or 76 percent, originates in and is destined for the Grand Rapids BEA, west of the Detroit BEA. Approximately, 5.4 million tons or 89 percent with a value of $13.7 billion is classified as warehouse- able. The two main warehouse-able commodities were Secondary Traffic and Food or Kindred Products, which together accounted for 51 percent of warehouse-able commodity tons. 2.3.4 Imports and Exports The IHS Global Insight database provides estimates of import and export shipments that move intact between the international ocean port (e.g. Port of New York/New Jersey) and the Detroit BEA. These estimates do not capture all international freight moving in these corridors, much of which moves in domestic equipment as domestic freight. For example, a containerized import will be “converted” to domestic freight when it, for example, enters an import distribution center (IDC) near the Port of Los Angeles and then departs the IDC in domestic equipment for the Detroit BEA. Similarly, export cargo can be shipped in domestic equipment to the international gateway port and then transloaded for shipment overseas. These types of moves are captured as domestic shipments and thus are included in the domestic inbound and outbound data presented earlier. Figure 2-12: Detroit BEA Import Truck Additionally, the import and export data do not include Cargo in 2009 trade with Canada and Mexico, which are reviewed separately in Sections 2.3.5 and 2.3.6 respectively. The Detroit BEA had import cargo, excluding cross- border trade with Canada and Mexico, of 5.0 million tons in 2009 with a value of $12 billion. As shown in Figure 2-12, this cargo is broken down into several flows. The inbound flow of 1.4 million tons represents imports, mainly of warehouse-able commodities, via international cargo gateways to the Detroit BEA. The top two gateways are New York (19 percent of tons) and Los Angeles (16 percent of tons). Source: Derived from IHS Global Insight Transearch Data 7 Internal refers to freight with its origin and destination within the Detroit BEA. 22 | TranSystems
  • 27.
    Translinked Freight Study Existing Freight Flows The outbound flow of 1.0 million tons is import cargo arriving in the Detroit area from overseas and then shipped to a final destination outside the Detroit BEA. The largest two commodities are Primary Metal Products (53 percent of tons) and Clay, Concrete, Glass or Stone (29 percent). Final destinations are primarily the regions surrounding the Detroit BEA. The internal flow, at 2.5 million tons, is cargo identified as imports arriving in the Detroit BEA (for example, via the Great Lakes) that remain in the Detroit BEA. The largest commodity in this segment is Nonmetallic Minerals (1.8 million tons). Figure 2-13 shows the breakdown of export cargo by Figure 2-13: Detroit BEA Export Truck direction. The Detroit BEA had total export cargo of Cargo in 2009 5.4 million tons in 2009. The outbound flow of 2.2 million tons represents exports via international gateways outside the Detroit BEA. The largest gateway was Los Angeles (37 percent of tons) followed by Toledo, OH (11 percent) and Houston, TX (8 percent). The top three commodity groups were Chemicals or Allied Products, Waste or Scrap Materials, and Farm Products. The inbound flow of 0.5 million tons captures exports shipped from other parts of the country to the Detroit BEA, and then exported overseas. Origins are principally the areas around Detroit. Finally, the internal Source: Derived from IHS Global Insight Transearch Data flow captures exports originating within the Detroit BEA and shipped overseas via the Detroit BEA. This flow amounted to 2.5 million tons. 2.3.5 Canada As a major border crossing point, the Detroit BEA has a significant volume of truck freight generated by local and U.S. trade with Canada. In 2009, total volume was 34 million tons with a value of $98 billion. As shown in Figure 2-14, the largest part this freight, 28 Figure 2-14: Detroit BEA - Canada Truck million tons or 83 percent, moved through the Detroit Cargo in 2009 BEA to and from other parts of the U.S. This through freight is dominated by warehouse-able cargo, including shipments of Food or Kindred Products, Chemicals or Allied Products, Transportation Equipment, Pulp, Paper or Allied Products, Farm Products and Rubber or Misc Plastics. The inbound truck trade from Canada to the Detroit BEA amounted to 3.4 million tons with a value of $9.4 billion. Locations in Ontario are the source for 89 percent of the inbound truck freight from Canada. The top three commodity groups are Transportation Equipment (32 percent of tons), Primary Metal Products Source: Derived from IHS Global Insight Transearch Data (19 percent), and Food or Kindred Products (7 percent). 23 | TranSystems
  • 28.
    Translinked Freight Study Existing Freight Flows The outbound truck trade to Canada from the Detroit BEA was 2.4 million tons with a value of $7.9 billion. Ontario dominates the outbound trade and was the destination for 95 percent of outbound tons. Major commodity groups were Primary Metal Products (25 percent of tons), Transportation Equipment (25 percent), Farm Products (11 percent), and Chemicals or Allied Products (9 percent). Finally, the source database provides estimates of freight flows by truck (and rail) between the Detroit BEA and Canadian port hinterlands, including Halifax. These data are reviewed in Section 2.6 in a discussion of freight flows along specific corridors. 2.3.6 Mexico Truck trade with Mexico amounted to only 1.1 million tons with a value of $5.4 billion. This small amount of truck freight, 42 percent of total trade volume with Mexico, reflects the preference for rail in the long- distance corridor between the Detroit BEA and Mexico and the likelihood that some Mexican trade flows through import distribution centers in other parts of the Figure 2-15: Detroit BEA - Mexico Truck U.S. prior to arrival in the Detroit area, thus arriving in Cargo in 2009 Detroit as a domestic shipment. As shown in Figure 2-15, inbound truck freight from Mexico amounted to 0.56 million tons. This freight is primarily higher-value commodities and the largest commodity groups were Transportation Equipment (38 percent), Machinery (13 percent), and Electrical Equipment (12 percent). The outbound trade to Mexico was 0.49 million tons and is dominated by Chemicals or Allied Products (50 percent), which includes plastics and synthetic fibers. Source: Derived from IHS Global Insight Transearch Data 24 | TranSystems
  • 29.
    Translinked Freight Study Existing Freight Flows 2.4 Detroit BEA Rail Cargo 2.4.1 Total Rail is predominant over longer distances and it was the transport mode for 18 percent of tons and 19 percent of cargo value moving in, out, within and through the Detroit BEA in 2009. This rail freight is generated by local consumption and industrial production, and freight movements through the Detroit BEA between other regions (e.g. Canada to other parts of the U.S.). Total rail freight amounted to 53 million tons with a total value of $77 billion. Rail involves a variety of trade flows and modes as shown in Figure 2-16. The largest segment by tonnage is domestic inbound freight, which accounted for 42 percent of tons in 2009 but only 14 percent of total value, due to the presence of low-value coal shipments, which account for 67 percent of the domestic inbound tonnage. Canada rail shipments (by carload and intermodal) account for 17 percent of tons and 30 percent of value, due to the presence of higher-value manufactured goods in this trade. Rail shipments through the Detroit BEA between Canada and other U.S. regions dominate the Canada rail flows, accounting for 88 percent of tonnage. The third largest trade flow is domestic outbound shipments from the Detroit BEA, accounting for 16 percent of tons and 33 percent of value, the larger share of value due to outbound shipments of higher value commodities (e.g. Transportation Equipment). Rail shipments with Mexico are another high value commodity trade, accounting for 3 percent of rail tons and 11 percent of rail cargo value. Rail cargo involves different types of rail modes – carload, intermodal (that is, container or trailer on flatcar), and rail (freight moving to and from Canada and Mexico). Lower value commodities dominate movements by carload, which accounted for 57 percent of tons and 36 percent of value. Intermodal rail, with 4 percent of tons and 14 percent of value, handles higher value commodities. Trade with Canada and Mexico is classified under a generic rail mode. Intermodal rail has a presence in these trades due to the many higher value commodities shipped. Figure 2-16: Detroit BEA Rail Cargo by Trade Flow in 2009 Source: Derived from IHS Global Insight Transearch Data 25 | TranSystems
  • 30.
    Translinked Freight Study Existing Freight Flows A profile of regional rail cargo (domestic and international, all directions) by commodity group is provided in Figure 2-17. The largest commodity group is inbound shipments of Coal, which amounted to 15 million tons in 2009 and 28 percent of the region’s rail cargo. The other top commodities are Chemicals and Allied Products (13 percent of tons), Transportation Equipment (12 percent), Petroleum and Coal Products (8 percent), and Primary Metal Products (8 percent). Transportation Equipment is primarily Motor Vehicles and Motor Vehicle Parts or Accessories. Agricultural and consumer related commodities, Food Products (5 percent) and Food or Kindred Products (4 percent) also appear in the top ten commodity groups. The commodity ranking shifts when a filter is applied to identify the warehouse-able commodities, those suited to warehousing and logistics services (see background discussion in Section 2.2). The total amount of warehouse-able rail cargo is estimated at 21 million tons, dominated by Chemicals and Allied Products (32 percent of warehouse-able tons) and Transportation Equipment (30 percent). Examples of commodities in the Chemicals and Allied Products group are Plastic Materials and Synthetic Fibers, Soap or Other Detergents, and Dyes. Further analysis of commodities, with a focus on the warehouse-able segment, is provided in the discussion of domestic and international rail flows by direction (inbound, outbound, etc.) presented below. A review of intermodal rail corridors is provided in Section 2.6.3. Figure 2-17: Detroit BEA Rail Cargo in 2009 – Top Ten Commodity Groups Source: Derived from IHS Global Insight Transearch Data 26 | TranSystems
  • 31.
    Translinked Freight Study Existing Freight Flows 2.4.2 Domestic Inbound and Outbound Domestic inbound and outbound flows together account for 58 percent of rail cargo tons related to the Detroit BEA. This cargo is generated by industry and consumption within the Detroit BEA, and demand in the rest of the country. In 2009, the Detroit BEA had inbound rail cargo of 22 million tons with an estimated value of $11 billion. Approximately 15 million tons (65 percent) with a value of $486 million (5 percent) was inbound shipments of coal. Warehouse-able rail cargo amounted to 3.2 million tons with a value of $8 billion (77 percent). As shown in Figure 2-18, the top-15 rail commodities shipped inbound to the Detroit BEA are a mixture of warehouse-able and other commodities. Four of the five top commodities are lower value and bulk-focused commodities, and these are nearly all shipped by carload service. Carload service moved 78 percent of the warehouse-able commodities, including shipments of transportation equipment (e.g., Motor Vehicles in specialized auto railcars). The remaining 22 percent of the warehouse-able commodities (e.g. Motor Vehicle Parts or Accessories) move by intermodal service (that is, container or trailer on flatcar). The Detroit BEA generated 8 million tons of outbound cargo with a value of $25 billion in 2009. An estimated 3.8 million tons (46 percent) with a value of $23.7 billion (94 percent) was defined as warehouse- able cargo. The top outbound commodity group was Transportation Equipment (58 percent of outbound tons), which moved by carload service and intermodal rail service. The two other main warehouse-able commodities were Miscellaneous Mixed Shipments by intermodal rail and Food or Kindred Products, nearly all shipped by carload service. Figure 2-18: Detroit BEA Inbound and Outbound Rail Cargo in 2009 – Top 15 Commodity Groups * The chart excludes coal shipments, which amount to 14.6 million tons. Source: Derived from IHS Global Insight Transearch Data 27 | TranSystems
  • 32.
    Translinked Freight Study Existing Freight Flows Apart from coal and iron ore related shipments, rail freight is widely dispersed across origin and destination regions (Figure 2-19). The top four lanes involve inbound coal shipments from Wyoming, West Virginia and Kentucky and mainly inbound iron ore shipments from the Cincinnati, OH BEA. Outside of these top four lanes, rail freight is widely dispersed by origin and destination. Some of the larger lanes include BEAs centered on ports and distribution hubs – for example, Chicago, New York, and Kansas City. The distribution by lane shifts when focusing on the warehouse-able commodity segment, with port and logistics hub related BEAs, as well as large population centers, more prominent. The mix of origins reflects inbound shipments related to local industry, notably the automotive sector, and for local consumption. Similarly, the outbound destinations are partly driven by shipments by the automotive sector, both of finished vehicles and components. Figure 2-19: Detroit BEA Inbound and Outbound Rail Cargo in 2009 – Top Freight Lanes Source: Derived from IHS Global Insight Transearch Data 28 | TranSystems
  • 33.
    Translinked Freight Study Existing Freight Flows Figure 2-20: Domestic Inbound Rail Freight 29 | TranSystems
  • 34.
    Translinked Freight Study Existing Freight Flows Figure 2-21: Domestic Outbound Rail Freight 30 | TranSystems
  • 35.
    Translinked Freight Study Existing Freight Flows 2.4.3 Domestic Internal and Through Only a small volume of rail cargo is reported as moving internally within the Detroit BEA. The total volume was 215,000 tons, including Petroleum or Coal Products (45 percent of tons), Transportation Equipment (13 percent), Chemicals or Allied Products (13 percent), and Clay, Concrete, Glass or Stone (11 percent). There was no domestic through rail cargo reported in the database. 2.4.4 Imports and Exports (excl. NAFTA) Rail import cargo (excluding cross-border from Canada and Mexico) amounted to 0.7 million tons in 2009 with a value of $1.3 billion. As presented in Figure 2-22, the Figure 2-22: Detroit BEA Import Rail Cargo in 2009 cargo is reasonably balanced between inbound and outbound flows. The principal difference is in the commodity mix, with the inbound direction largely made up of warehouse-able cargo. The top inbound origins for this warehouse-able freight are coastal BEAs, including Los Angeles (22 percent), New York (15 percent), Norfolk (13 percent), Seattle (11 percent), and Houston (8 percent). The outbound flow represents import cargo arriving in the Detroit BEA from overseas (e.g. via the Great Lakes) and then railed to other markets in the U.S. The three main commodity groups are Nonmetallic Minerals, Clay, Concrete, Glass or Stone, and Primary Source: Derived from IHS Global Insight Transearch Data Metal Products. Destination BEAs are mainly in neighboring states, including Chicago (35 percent), Columbus (14 percent) and Dayton (7 percent). Overseas rail export cargo (excluding cross-border with Figure 2-23: Detroit BEA Export Rail Canada and Mexico) amounted to 0.9 million tons with Cargo in 2009 a value of $1.3 billion. As shown in Figure 2-23, the majority of export rail cargo involves other than warehouse-able commodities. The outbound flow, exports from the Detroit BEA, mainly moves to port- related BEAs, including Norfolk (18 percent), New Orleans (17 percent), New York (14 percent), Los Angeles (11 percent) and Jacksonville (8 percent). The main commodity groups are Farm Products, Waste or Scrap Materials, Misc Mixed Shipments, and Transportation Equipment. The inbound direction is export cargo from other BEAs transported by rail to the Detroit BEA and then shipped overseas. The main commodity groups are Coal, Source: Derived from IHS Global Insight Transearch Data Petroleum or Coal Products, and Chemicals or Allied Products. The main origin BEAs are Pittsburgh, Wheeling, and Columbus. 31 | TranSystems
  • 36.
    Translinked Freight Study Existing Freight Flows 2.4.5 Canada Canada rail cargo amounted to 19 million tons with a value of $30 billion, Similar to Canada truck freight, the principal rail flow is freight moving through the Detroit BEA between Canada and other regions of the U.S. Through rail cargo was 17 million tons (Figure 2-24) and 61 percent of this volume was moving southbound from Figure 2-24: Detroit BEA - Canada Rail Canada and 39 percent northbound to Canada. Nearly Cargo in 2009 90 percent of cargo originated in or was destination for Ontario and Quebec. Major U.S. origin BEAs for northbound through cargo were Houston, Chicago, Des Moines, St. Louis, and Macon; while top U.S. destination BEAs for southbound through cargo were Chicago, Los Angeles, Houston, Grand Rapids, and Memphis. Major commodities moving northbound are Chemicals or Allied Products, Food or Kindred Products, Petroleum or Coal Products, Farm Products, Clay, Concrete, Glass or Stone, and Transportation Equipment. In the southbound direction from Canada, the main commodities are Chemicals or Allied Products, Primary Metal Products, Pulp, Paper or Allied Products, Petroleum or Coal Products, and Transportation Source: Derived from IHS Global Insight Transearch Data Equipment. The inbound rail trade from Canada to the Detroit BEA was 2 million tons with a value of $8.1 billion. The three main Canadian origins were Ontario (63 percent), Quebec (13 percent) and British Columbia (8 percent). Nova Scotia, which includes the Port of Halifax, was the origin for one percent of the inbound rail cargo. Leading commodity groups were Transportation Equipment (50 percent), Primary Metal Products (15 percent), Lumber or Wood Products (12 percent) and Chemicals or Allied Products (10 percent). Outbound rail freight to Canada from the Detroit BEA was 0.4 million tons with a value of $1.6 billion. Nearly 84 percent of the tons were shipped to Ontario and Quebec, and the main commodities were Transportation Equipment (45 percent), Farm Products (15 percent), Chemicals or Allied Products (14 percent), and Petroleum or Coal Products (10 percent). 32 | TranSystems
  • 37.
    Translinked Freight Study Existing Freight Flows 2.4.6 Mexico Rail freight with Mexico amounted to 1.5 million tons with a value of $8.5 billion. The inbound direction from Figure 2-25: Detroit BEA - Mexico Rail Mexico is the largest flow (Figure 2-25), with 1.07 Cargo in 2009 million tons, and nearly all this cargo is classified as warehouse-able. The inbound trade is driven by the automotive industry and the major commodity groups are Transportation Equipment (91 percent), Machinery (2 percent) and Fabricated Metal Products (2 percent). Outbound freight shipments by rail amounted to 0.45 million tons and, similar to the inbound, has a significant component driven by the automotive industry. The main commodity groups are Chemicals or Allied Products (55 percent), Transportation Equipment (23 percent), and Farm Products (7 percent). Source: Derived from IHS Global Insight Transearch Data 2.5 Other Transport Modes The Detroit BEA also handles freight by air and water. Total air freight was 83,000 tons in 2009 and valued at $1.45 billion. The largest flow was outbound, accounting for 74 percent of cargo tons. Freight moving by water amounted to 26.6 million tons with a total value of $1.68 billion tons. Its value per ton was only $63 compared to $17,445 for air freight, $1,616 for truck and $1,456 for rail, due to the much lower value bulk commodities shipped by water. The largest flow was inbound with 24.5 million tons and the three main inbound commodities were Iron Ore (44 percent), Coal (34 percent) and Broken Stones or Riprap (19 percent). The outbound flow was 1.1 million tons and involves a variety of mainly bulk commodities. Finally, there was an additional 0.9 million tons of internal waterborne cargo. 2.6 Corridor Specific Flows The discussion of Detroit BEA cargo flows presented above primarily focused on the composition of freight by trade, direction, commodity type and mode of transport. The freight flow data also allows a review of specific freight corridors to understand characteristics specific to those lanes. Section 2.6 addresses several corridors of interest to the evaluation of logistics opportunities in the Detroit region. 2.6.1 Halifax Freight Flows The Port of Halifax is the first deep-water container port on the Eastern seaboard of North America for ships arriving from Europe and the Mediterranean, and from Asia via the Suez Canal. With a small population in its hinterland, the port specifically targets containerized cargo moving to and from inland regions of Canada and the U.S. Midwest, including the Detroit area. The Port is connected by CN rail service to these markets. The Port had total throughput of 425,461 TEU in 2010 compared to the recession impacted 344,811 TEU of 2009, but still below the high of 550,462 TEU seen in 2005. The following discussion provides a profile of freight flows moving between the Halifax area and the Detroit BEA that were identified in the IHS Global insight database. 33 | TranSystems
  • 38.
    Translinked Freight Study Existing Freight Flows A total of 386,000 tons were identified as originating in Figure 2-26: Detroit BEA – Cargo Flows the Halifax area (defined as the Halifax CMA8 and non- from the Halifax Area in 2009 CMA Nova Scotia), of which 356,000 tons passed through the Detroit BEA to other regions and only 32,000 tons was inbound to the Detroit BEA (Figure 2-26. This broad regional view is assumed to capture Nova Scotia origin freight shipped to the Detroit area and other parts of the U.S., and imports through the Port of Halifax. Close to 100 percent of the cargo is defined as warehouse-able, while 60 percent of the freight moved by rail and 40 percent by truck. The largest commodity groups are Pulp, Paper or Allied Products (55 percent of total tons), Rubber or Misc Plastics (24 percent), Lumber or Wood Products (7 percent), and Chemicals or Allied Products (5 percent). Source: Derived from IHS Global Insight Transearch Data Forest products are most likely sourced from Nova Scotia. The most likely containerized import commodities are: Rubber or Misc Plastics, Chemicals or Allied Products; Food or Kindred Products; Transportation Equipment, Machinery, Furniture or Fixtures, Textile Mill Products, Apparel and Related Products, and Electrical Equipment. The total volume of these commodities in 2009 was 125,000 tons or 32 percent of the total. Assuming 10 tons per TEU, these commodities generated the equivalent of 12,500 TEU of containerized import cargo bound for or through the Detroit BEA from Halifax. Of this total, an estimated 15,800 tons or 1,580 TEU was inbound freight into the Detroit BEA, and the balance through freight to other parts of the U.S. Ten U.S. states were the destinations for 80 percent of freight from the Halifax area flowing through the Detroit BEA: Wisconsin, Illinois, Kentucky, South Carolina, Tennessee, Ohio, Indiana, Texas, Mississippi, and Missouri. The above analysis is based on 2009 data and volumes will have grown in 2010 based on the 26 percent growth of total container throughput at Halifax in 2010. Only 20,000 tons of cargo was identified as flowing through or from the Detroit BEA to the Halifax area, and 99 percent of this freight was through cargo. Rail was the dominant mode with an 88 percent share and 76 percent of the freight was classified as warehouse-able. The three largest commodity groups were Chemicals or Allied Products (47 percent), Food or Kindred Products (18 percent), and Primary Metal Products (12 percent). The four largest origins in the U.S. were Chicago, Huntsville, AL, Cleveland, and Minneapolis, which together accounted for 46 percent of the cargo tons. 2.6.2 Montreal Freight Flows The Port of Montreal is an important gateway for containerized trade, notably with North Europe and the Mediterranean, and the Port is connected by CN and CP rail service to U.S. markets. Montreal had total throughput of 1.33 million TEU in 2010 compared to 1.25 million TEU in 2009, and 1.47 million TEU in 2008. The following discussion provides a profile of freight flows moving between the Montreal CMA and the Detroit BEA that were identified in the IHS Global insight database. 8 CMA – Census Metropolitan Area 34 | TranSystems
  • 39.
    Translinked Freight Study Existing Freight Flows A total of 1.67 million tons of cargo flowed to and from Figure 2-27: Detroit BEA – Cargo Flows the Montreal CMA in 2009, the principal flows with the Montreal CMA in 2009 southbound and northbound through the Detroit BEA (Figure 2-27). Rail is the principal transport mode with a 61 percent share of the total volume. A portion of the freight is believed to be international containerized import and export trade handled by the Port of Montreal. A total 1.2 million tons were identified as originating from the Montreal CMA, of which 1.1 million tons passed through the Detroit BEA and only 87,000 tons was destined for the Detroit BEA. Warehouse-able cargo accounted for 63 percent of the through cargo and 72 percent of the inbound cargo. The commodity mix in the trade from Montreal through the Detroit BEA is focused on Primary Metal Products, Pulp, Paper Source: Derived from IHS Global Insight Transearch Data or Allied Products (23 percent), Chemicals or Allied Products (21 percent), Waste or Scrap Materials (17 percent), and Food or Kindred Products (8 percent). Trade inbound to the Detroit BEA is dominated by Primary Metal Products (28 percent), Pulp, Paper or Allied Products (24 percent), and Food or Kindred Products (11 percent). The northbound flows were smaller than the southbound, amounting to 0.5 million tons. Total cargo flowing through the Detroit BEA to the Montreal CMA was 0.47 million tons, while only 26,000 tons originated in the Detroit BEA. Warehouse-able cargo made up 57 percent of the through cargo and only 17 percent of the outbound cargo. The major commodities in northbound trade through the Detroit BEA to the Montreal area were Food or Kindred Products (24 percent), Farm Products (16 percent), Clay, Concrete, Glass or Stone (10 percent), Petroleum or Coal Products (9 percent), and Chemicals or Allied Products (9 percent). Commodities flowing outbound from the Detroit BEA to the Montreal CMA were Farm Products (67 percent), Waste or Scrap Materials (11 percent), and Chemicals or Allied Products (11 percent). 2.6.3 U.S. Intermodal Rail Corridors Nearly 2.0 million tons of cargo was identified as moving in intermodal rail corridors to and from the Detroit BEA. The top-10 intermodal lanes by origin and destination are shown in Figure 2-28. The data is broken into domestic freight and international freight, which moves intact between coastal ports and Detroit. However, the domestic freight also includes some international cargo, which has been transloaded at the import or export port, into or from domestic equipment. In particular, a substantial portion of the intermodal freight labeled as domestic from Los Angeles and other port BEAs (e.g. New York, VA) is containerized imports that are transloaded from marine containers at import distribution centers (IDCs) into domestic 48- and 53-foot containers. Turning to the inbound flows, the top three origins are the port BEAs of Los Angeles, New York and Seattle. The largest commodity group flowing in these lanes is Miscellaneous Mixed Shipments, which captures import merchandise moving in domestic equipment. This commodity group accounted for 98 percent of the intermodal freight from Los Angeles, 74 percent from New York and 99 percent from Seattle. Other port BEAs are Norfolk and Jacksonville, and Miscellaneous Mixed Shipments accounted for 94 percent and 84 percent of cargo tons respectively. Transportation Equipment is the principal commodity 35 | TranSystems
  • 40.
    Translinked Freight Study Existing Freight Flows flowing in other inbound intermodal lanes – 90 percent from Kansas City, 91 percent from San Antonio, 64 percent from Dallas, 45 percent from Atlanta, and 52 percent from St. Louis. The top outbound lanes are also dominated by coastal BEAs – New York, Los Angeles, Norfolk and Jacksonville. Miscellaneous Mixed Shipments is the dominant commodity flowing in these lanes – 84 percent New York, 77 percent Los Angeles, 83 percent Norfolk, and Jacksonville 95 percent. The outbound domestic lane to Kansas City is nearly all Transportation Equipment (94 percent). Other lanes have a mixture of Transportation Equipment and Miscellaneous Mixed Shipments. Figure 2-28: Detroit BEA - Top-10 U.S. Intermodal Rail Lanes by Cargo Tons in 2009 Source: Derived from IHS Global Insight Transearch Data 36 | TranSystems
  • 41.
    Translinked Freight Study Existing Freight Flows 3 TOLEDO AND WINDSOR FREIGHT FLOWS 3.1 Toledo, Ohio Toledo is located in northwest Ohio on the Maumee Figure 3-1: Port of Toledo Cargo River, at the southern end of Maumee Bay. The primary freight flows are related to activity at the Port of Toledo, which handles domestic and international freight moving by vessel, and is linked to overseas markets by the Great Lakes and St. Lawrence Seaway System. The Port’s total throughput was 10.0 million tons in 2009 and 10.9 million tons in 2010 (Figure 3-1), both years lower than the 12.3 million tons achieved in 2007. The largest flows are shipments with other U.S. ports (36 percent of tons in 2010) and shipments with Canada (58 percent of tons). International cargo accounted for 6 percent of total tons in 2010. The commodity mix is focused on lower value dry bulk Source: Port of Toledo commodities – coal, iron ore, grain and other dry bulk commodities – which accounted for 99 percent of total tons in 2010. The principal outbound commodities are Figure 3-2: Port of Toledo Commodity Mix coal and grain (mainly corn and soybeans), and the main inbound commodities are iron ore, crude materials (e.g. limestone) and grain (mainly wheat and oats).9 General cargo accounted for 0.3 percent of total tons in 2010. The Port handles project cargo for the surrounding region. For example, in mid-2010, the Port handled five new wide-span cranes on route to the new CSX Northwest Ohio Intermodal Terminal at North Baltimore, Ohio, 40 miles south of Toledo. As a primarily bulk cargo port, transportation activity has a significant rail component. For example, inbound iron ore is railed from the port to steel mills, while coal for export is railed into the port. The Port of Toledo handles freight for the Detroit BEA Source: Port of Toledo reviewed in Section 3. In 2009, based on the IHS Global Insight data, 4.9 million tons of cargo was shipped from the Detroit BEA to the Toledo BEA, and this total included 0.25 million tons of identified export cargo, which would have been shipped via the Port of Toledo. In the same year, 10.8 million tons were shipped 9 Major commodities by direction based on Waterborne Commerce Statistics from the U.S. Army Corps of Engineers. 37 | TranSystems
  • 42.
    Translinked Freight Study Existing Freight Flows from the Toledo BEA to the Detroit BEA, including 0.17 million tons of identified import cargo. Both export and import cargo comprised lower value bulk commodities. The Port has looked to the container market for possible future growth, as a load and discharge point for future feeder services connecting to Canada’s East Coast container ports. However, there are many challenges related to providing container feeder service to and from the Great Lakes, lock navigation and total transit time, a constrained shipping season, and competition from intermodal rail service. In early 2010, the Port took delivery of two new mobile harbor cranes capable of handling a variety of cargo types, including containers if a short sea service develops in the future. Funding for the purchase of the cranes came from American Recovery and Reinvestment Act resources, administered by the Ohio Department of Transportation. In 2009, 15.0 million tons of domestic freight moved Figure 3-3: Detroit BEA Domestic Freight between the Detroit BEA and the Toledo BEA, 10.4 Flows with Toledo BEA, 2009 million tons inbound from the Detroit BEA and 4.6 million tons outbound from the Detroit BEA. Truck is the dominant mode accounting for 92 percent of inbound freight and 96 percent of outbound freight. The top five inbound commodities from the Toledo BEA are Nonmetallic Minerals (40 percent), Petroleum or Coal Products (14 percent), Farm Products (12 percent), Clay, Concrete, Glass or Stone (10 percent), and Food or Kindred Products (6 percent). The top five outbound commodities shipped to the Toledo BEA are Nonmetallic Minerals Farm Products (44 percent), Petroleum or Coal Products (17 percent), Chemicals or Allied Products (6 percent), and Food or Kindred Products (6 Source: Derived from IHS Global Insight Transearch Data percent). 3.2 Windsor, Ontario The Windsor area has a diversified economy with a strong presence in the automotive sector, agriculture, and food products, and emerging sectors that include high tech manufacturing. Evaluation of Windsor freight flows focuses on the Windsor Census Metropolitan Area (CMA), identified in the IHS Global Insight database. The Windsor CMA is made up of the Canadian census subdivisions of Windsor, LaSalle, Tecumseh, Amherstburg, and Lakeshore, and it had a total estimated population of 331,000 in 2010.10 A total of 1.4 million tons of freight was identified as related to the Windsor CMA (Figure 3-4). This total covers freight to and from the Detroit BEA, and between the Windsor CMA and other regions of the U.S. It excludes freight to and from other regions of Canada, and cross-border freight passing through the Windsor CMA. Truck is the dominant mode of transport, accounting for 88 percent of freight shipped to the Windsor CMA and 72 percent of the tons shipped from the Windsor CMA. The respective shares for rail were 5 percent and 28 percent. 10 Annual Demographic Estimates: Subprovincial Areas 2005 to 2010, Statistics Canada 38 | TranSystems
  • 43.
    Translinked Freight Study Existing Freight Flows The freight flows from the Windsor BEA to the Detroit BEA and other parts of the U.S. are primarily Figure 3-4: Windsor, Ontario CMA Freight warehouse-able commodities related to the Flows in 2009 automotive sector. Transportation Equipment accounted for 91 percent of freight shipped to the Detroit BEA and 72 percent of freight shipped to the rest of the U.S. Warehouse-able commodities accounted for a smaller share of freight flowing to the Windsor BEA, 26 percent of tons from the Detroit BEA and 59 percent of tons from the rest of the U.S. Some additional perspective on freight activity in the southwest region of Ontario is provided by data for the London CMA, which is located approximately 116 miles northeast of Windsor and 67 miles east of the Port Huron/Sarnia border crossing. The London Source: Derived from IHS Global Insight Transearch Data CMA had an estimated population of 492,000 in 2010, nearly 50 percent more than the Windsor CMA, and has a similar industry profile with a strong presence in the automotive industry and agriculture related food and food processing. A total of 0.4 million tons of freight was identified as Figure 3-5: London, Ontario CMA Freight related to the London CMA (Figure 3-5). This total Flows in 2009 covers freight to and from the Detroit BEA, and to and from other regions of the U.S. It excludes freight to and from other regions of Canada, and cross- border freight passing through the London CMA. Truck is the dominant mode of transport, accounting for 87 percent of freight shipped to the London CMA and 70 percent of the tons shipped from the London CMA. The respective shares for rail are 13 percent and 30 percent. The freight flows are primarily warehouse-able commodities. Transportation equipment accounts for 49 percent of tons shipped to the Detroit BEA and 17 percent of freight shipped to the rest of the U.S. Food or Kindred Products is the largest Source: Derived from IHS Global Insight Transearch Data commodity shipped to the rest of the U.S., accounting for 29 percent of freight. Other major commodities in freight flows between London CMA and the U.S. are Primary Metal Products, Chemicals or Allied Products, and Farm Products. 39 | TranSystems
  • 44.
    Translinked Freight Study Industry Trend Analysis 4 INDUSTRY TREND ANALYSIS 4.1 Existing Transportation Infrastructure and Location Selection Factors Logistics managers are continuously evaluating their logistics networks to squeeze excess transportation expenses and other costs out of their supply chains. The availability of all transportation modes is essential in order to enable logistics managers to have the flexibility to choose the mode that best suits shipment needs. Lowest-cost transportation options, such as rail, are selected provided that service is available, and transit time and reliability meet service level requirements. Trucking costs are the largest portion of the supply chain expense. Because of this, supply chain strategies that reduce trucking as much as possible have been a major goal of supply chain managers. Warehouse locations are chosen based on the cost of the facility, and their proximity to customers and suppliers, thereby reducing trucking costs. Labor, green initiatives, government incentives, etc. are considered after transportation service and rate level requirements are met, and these considerations typically influence a specific site location among competing sites that meet transportation requirements. The following sections evaluate how the Translinked region (represented by Detroit) meets these selection factors. 4.1.1 Logistics and Transportation Infrastructure Summary Transportation infrastructure serving the region features advantageous access to the Michigan Peninsula, the Canadian border, and access to U.S. Midwest markets. Air, rail, truck, and warehousing services and access, which are key factors for flexible and responsive supply chains, are well established as a result of their support of the automotive industry. Table 4-1 summarizes logistics features, which will be discussed further in this section. Table 4-1: Detroit Logistics Summary Infrastructure Description CSX – U.S. East, Midwest, main Western States Access Rail NS – U.S. East, Midwest access CN and CP - Canada Rail Markets, US Central Plain States, Gulf US-69 to Blue Water Bridge to CA-402, US 75, Highways US 375/CA-401 via Ambassador Bridge US-96, US-94, US-275 (to US-80) Key Ocean Gateways Halifax, Montreal, Other Canadian and U.S. ports U.S. Rank 27th Airport Total Cargo 193,344 metric tons Total Space (sq. ft.) 366.8 - 524.0 million Vacancy Rate 13.5% - 14.9% Distribution Facilities Average Lease Rate ($/sq. ft./yr) $3.87 – $3.93 Detroit Transportation and Materials Moving Occupation (Hourly) $17.24 US Transportation and Materials Moving Occupation (Hourly) $15.70 Distribution Area Advantage Ontario, Canada, Michigan Peninsula, OH, IN, WI, IL Source: TranSystems, CB Richard Ellis, Grubb and Ellis, Colliers, Bureau of Labor Statistics 40 | TranSystems
  • 45.
    Translinked Freight Study Industry Trend Analysis 4.1.2 Rail North America Class 1 railroads have been investing in programs to improve the speed and reliability of the railroads, including rail infrastructure, and rail personnel staffing issues since the mid-1990s. The result has been improved rail service. Rail rates are on the rise, but remain the lower cost option as compared to trucking. Improved rail reliability and speed, mixed with uncertainty about truck rates and truck capacity availability, have caused North American logistics managers to develop strategies to divert as much truck volume as possible to rail. There are currently seven Class I railroads operating in the U.S. U.S. railroads are generally divided into Western and Eastern rail service areas, that connect to provide trans-continental service at key locations, such as North Baltimore, OH, Columbus, OH, Chicago, IL, Kansas City, MO, St. Louis, MO, Memphis, TN, and New Orleans, LA. The two Western railroads, The Union Pacific (UP) and Burlington Northern Santa Fe (BNSF) serve states west of the Mississippi River. The CSX and Norfolk Southern (NS) railroads operate in the eastern half of the U.S. The two Canadian railroads, the Canadian National (CN) and the Canadian Pacific (CP), have rail networks extending across Canada, and down through the U.S. Midwest, as far south as New Orleans. The Kansas City Southern Railroad (KCS) operates primarily in the U.S. Central Plains States and Mexico. Interchanges between the railroads add a degree of complexity in terms of adding transit time or negotiating rates; however, railroads do make efforts to streamline connections, especially in high volume corridors, such as Los Angeles/Long Beach to New York. No single railroad has the ability to rail freight from one US coast to the other without handing-off to another railroad. Both NS and CSX have recently improved rail service to and from the Midwest, and Western Markets. CSX’s National Gateway Project includes a new terminal in North Baltimore, OH, and is aimed at improving their connection to West Coast markets. NS’s Crescent Corridor improves rail service from the South to the Northeast. Another NS network enhancement, the Heartland Corridor, improves service from the port of Norfolk, VA to Columbus, OH. Figure 4-1 maps the Class 1 Railroad network in North America. 41 | TranSystems
  • 46.
    Translinked Freight Study Industry Trend Analysis Figure 4-1: Class I Railroad Map with Container Ports 42 | TranSystems
  • 47.
    Translinked Freight Study Industry Trend Analysis Four Class 1 Railroads, CSX, NS, CP and CN, provide container-on-rail service, called intermodal serve the Translinked region. Intermodal service availability in Detroit (the main intermodal hub in the region) is essential if international freight opportunities are to be considered, as virtually all international retail trade is transported in cargo containers. Detroit cargo does not have to interchange railroads to Canadian, or U.S. Eastern or Southern locations. Freight from the East Coast to Detroit would switch to northbound tracks in terminals in Ohio, but does not require a transfer to another railroad. Rail freight between Detroit and Western states does require a transfer to a connecting railroad. Cargo originating in Detroit and destined for Los Angeles for example might load at Detroit on the CSX railroad, transfer at North Baltimore, OH to the UP Railroad for the journey to Los Angeles. Rail access in Detroit is desirable, because it supports logistics mangers’ strategies to use the rail mode whenever possible. 4.1.3 Highways Regional highway access is similar to major US areas of similar size, with additional advantages of border access to Canada via CA-401 and CA-403. North/South access is provided by US-75, with East/West transcontinental truck traffic accommodated by US-69, and US-80 to the south. A key feature of the region’s highway network is the Canadian border crossing, where Michigan ranked first as the leading US truck border crossing in 2010. Figure 4-2 maps major highways serving the Translinked region. Figure 4-2: Regional Highway Map Source: TranSystems 43 | TranSystems
  • 48.
    Translinked Freight Study Industry Trend Analysis Figure 4-3 displays annual truck traffic (inbound and outbound) for the three Detroit border crossings from Figure 4-3: Detroit Truck Border 2006 through 2010. After a sharp rise in truck traffic Crossings starting in 2006, truck crossings peaked in 2008, at 4.5 million truck crossings. Truck traffic fell in 2009, to under 3.5 million transits, but climbed to nearly 4.0 million trips in 2010. The Ambassador Bridge handled nearly half of all truck traffic crossing the U.S. Border at Detroit. Additional U.S. security measures put in place over the past decade have created extra steps for trucking providers and shippers, resulting in delays in border crossing times. Recent improvements in border wait times have been attributed to the economic downturn, but are expected to lengthen as the economy improves. As of October, 2011, adding capacity to the existing Ambassador Bridge is planned to address future traffic concerns. 4.1.4 Ocean Gateways For purposes of this report, an ocean gateway is defined Source: Public Border Operators Association as a major port area handling containerized cargo volume. The top three ocean gateways in North America are Los Angeles/Long Beach, CA, New York, NY, and Savannah, GA. The gateway used is important, because it affects the overall transit time or cost of a shipment. Ideally, the gateway that balances transit time requirement and lowest overall transportation costs, called “total landed costs”11 is preferred. Another gateway consideration is port diversification. In response to disruptions that began on the U.S. West Coast starting in the late 1990’s, such as West Coast port congestion, labor lock outs and inland rail congestion, logistics managers allocated shipments over several gateways, including East Coast gateways, using Panama Canal “all water” services. This practice reduced the dependence on a single port. Prior to 2000, shipments from Asia to the region typically entered the U.S. via Los Angeles/Long Beach, and were then transported inland. Today, this shipment might just as likely enter the U.S. via another gateway (e.g. New York) and either railed or trucked to the region. The trade-off between lowest total landed cost and transit time is most influenced by the value of the cargo being carried. Sophisticated supply chain managers consider the inventory carrying cost component of total landed costs of gateways that add days to the overall transit. High value cargo’s inventory carrying costs are more sensitive to additional transit days, and therefore require the fastest transits, while lower value goods are able to tolerate slower transits at generally lower rates. High value cargoes are goods such as electronics or auto parts, while lower value goods are items such as forest products. 11 Total Landed Cost is the total of all expenses associated with the shipment from the point of origin to its final destination. Expenses included in the total landed cost calculation include, but are not limited to the product purchasing price, ocean freight rates, rail and trucking costs, customs duties, and inventory carrying costs. 44 | TranSystems
  • 49.
    Translinked Freight Study Industry Trend Analysis The Translinked region has access to all of the North America gateways, but two are Table 4-2: West Coast Transit Time Comparison important as they provide a transit time (Transit Days): Shanghai to Detroit advantage over other key North American Port Gateway Ocean Inland Total Prince ports. The Canadian ports of Prince Rupert and Rail Transit* Rupert Halifax are situated in geographically Delta advantageous positions that shorten ocean and Prince Rupert 11.0 5.6 16.6 - inland transits. Table 4-2 and Table 4-3 Seattle 12.0 5.8 17.8 1.2 compare total transit times from key origins to Detroit (representing the Translinked region) Los Angeles 13.3 6.0 19.3 2.7 by selected North American West and East * Based on website schedules, actual transits may vary Coast gateways. Shipments over Prince Rupert Source: CN, BNSF and NS Railroad Websites from Shanghai beat competing West Coast ports by 1 to 2 days, and the Halifax gateway Table 4-3: East Coast Transit Time Comparison transit to Detroit is faster from Rotterdam by (Transit Days): Hong Kong and Rotterdam to an estimated 3.1 days over its regional Detroit competitor, Montreal. According to the Port of Prince Inland Total Halifax, more congested ports, such as New Port Gateway Ocean Rupert Rail Transit York and Montreal add time to the overall Delta transit due to additional container “dwell time”, From Hong Kong which is the time containers sit idle in port Halifax 25 5.2 30.2 - awaiting an interchange to truck or rail services. In addition to having the fastest transits, service New York 25 7.0 32.0 -1.8 from Prince Rupert is entirely on the CN Montreal* 28 4.3 32.3 -2.1 Railroad, while service to Detroit from other From Rotterdam U.S. West Coast ports requires a railroad interchange. A single service rail provider is Halifax 7 5.2 12.2 - considered to be less cumbersome to use, but New York 11 7.0 18.0 -5.8 does raise concerns from some shippers who Montreal 11 4.3 15.3 -3.1 require redundancy in their supply chains. From * Montreal transits based on Halifax transit plus 3 days the lowest total landed cost perspective, high Source: Halifax Port Authority value commodities that are suited to rail in particular may favor the Canadian gateways. 4.1.5 Airports A leading regional intermodal cargo hub must have air cargo services to accommodate time sensitive shipments as part of an overall supply chain strategy. Detroit Metro Airport, handling 193,344 metric tons of cargo in 2010, ranked 27th in a list of North America’s busiest cargo airports12. UPS and FedEx are the only two regularly scheduled cargo airlines servicing the Detroit airport. International cargo services are also provided by “belly cargo” carriers, which are combination cargo and passenger airlines, such as Air Canada, Air France, American Airlines, Continental, Delta, Lufthansa, KLM and others. These airlines serve as direct links to the International air freight network. The Willow Run Airport, in Ypsilanti, MI handled 92,484 metric tons in 2010, making it the 42nd busiest cargo airport in North America. Cargo airlines serving the airport are Kalitta Air, Active Aero, and National Airlines. 12 Airports Council International 45 | TranSystems
  • 50.
    Translinked Freight Study Industry Trend Analysis 4.1.6 Toledo, OH The region around Toledo, OH is making significant improvements in transportation Key projects in the Toledo area are terminal improvements at the Port of Toledo, and the CSX National Gateway North Baltimore intermodal terminal. Port of Toledo The port of Toledo is the largest Great Lakes Port in terms of area, and second largest in terms of cargo volume. Development focuses mainly on the port’s main commodities, which are coal, iron, grain, project cargo (wind towers, construction projects), petroleum products, and cement. The port also has two refineries that generate petroleum based cargo. Notable progress is evident both in terms of terminal facilities and capabilities, as well as - and perhaps more importantly - the cooperation and coordination between public and private entities that drive development in the area. The Toledo-Lucas County Port Authority is partnering with Metropolitan Planning Organizations (MPO), such as the Toledo Metropolitan Area Council of Governments (TMACOG) and the Southeast Michigan Council of Governments (SEMCOG), and importantly, private industry, such as Midwest Terminals, CSX and Norfolk Southern Railways, to develop and fund transportation planning throughout the region. Recent U.S. Stimulus Funding was applied to local transportation projects because regional agencies were able to quickly identify projects based on mutually agreed upon priorities. This regional, public/private partnership approach to transportation planning considers port, rail and roadway requirements to accommodate and complement multimodal needs. Intermodal rail access that takes trucks off the highway, or port infrastructure that promotes Saint Lawrence Seaway traffic over other more costly truck to rail routes are examples of regional coordination. Other developments are: • Toledo Port Authority o Purchased and developed defunct Chevron and JEEP plants o Port crane purchases provide additional cargo handling capabilities • Norfolk Southern o Norfolk Southern extend rail siding in Toledo yard to accommodate length of container unit trains • CSX Railroad o North Baltimore Intermodal Terminal (discussed below) • ODOT o Widening of I-75 between Toledo and North Baltimore o State Route 18 access improvement to North Baltimore • MiDOT o Approved routes for overweight trucks The Port of Toledo has experienced additional business as a direct result of improvements to port facilities and equipment; however, key reasons are shippers understand the advantages of shipping over the Port of Toledo, and a Port Authority and MPOs that agree, and act on regional priorities. CSX National Gateway Initiative: North Baltimore Intermodal Terminal The CSX National Gateway Initiative is a key railroad improvement project that will positively impact the Northwest Ohio region. This public private partnership will create a more efficient CSX rail route linking key U.S. Mid Atlantic ports with Midwestern and Western markets for double stack containers. The terminal in North Baltimore, OH opened in February of this year, and is considered the cornerstone of the 46 | TranSystems
  • 51.
    Translinked Freight Study Industry Trend Analysis entire project. It comprises 500 acres total, with 280 acres being used by CSX initially. High speed cranes installed at North Baltimore enable containers to be off-loaded from incoming trains, and re-loaded on re- directed outbound trains so quickly, that the resulting overall transit reductions of containers from origin, through North Baltimore, to final destination has opened new markets. Service from New York, through North Baltimore to Detroit, for example, was cited by CSX as becoming more attractive due to overall network improvements, and improved switching capabilities. To capitalize on on-site and near-site DC opportunities, two thousand acres adjacent to the North Baltimore site have been re-zoned for industrial use, in anticipation of a future need for logistical services in the area, given improved intermodal rail and air access. 4.1.7 Windsor, ON Windsor is strategically located at the border between Canada and Michigan, and on the rail networks of the CN and CP, with several other railroads having user rights on CN and CP tracks through Windsor. The rail network provides links to the two major container ports in Eastern Canada – Montreal and Halifax – and other Canadian ports, and to the major Canadian population and production centers. The rail network provides transportation options for the major industries in and around Windsor, notably the automotive industry. In addition, Windsor is connected by highway to major population and industrial centers in Ontario and Michigan. Short-haul rail service is provided in the Windsor area by the Essex Terminal Railway, with track running from Windsor to Amherstburg, ON that connects with all the major railroads in the region. ETR services a variety of industries – automotive, forest products, agricultural, and food products, chemicals and others. Figure 4-4: Current Rail System in Windsor 47 | TranSystems
  • 52.
    Translinked Freight Study Industry Trend Analysis Source: City of Windsor “Community Based Strategic Rail Study, Final Report” For international trade moving by rail, the key piece of infrastructure in Windsor is the rail tunnel under the Detroit River. This tunnel was enlarged in 1994 but cannot accommodate double-stack high-cube containers13 and auto-max railcars14. The number of high-cube containers has increased over time as shippers take advantage of their larger capacity, and this traffic cannot move via the tunnel. Similarly, use of larger auto railcars by the automotive industry has increased but this equipment cannot be routed through the Windsor rail crossing. Construction of a new larger tunnel alongside the existing one has been proposed and this would improve the freight capacity of the Windsor-Detroit border crossing. 4.2 Inland Strategies and Network Optimization In addition to gateway and modal choices, shippers also consider inland transportation strategies to deliver goods effectively. In general, rail deliveries are considered to be the lowest cost transpiration mode, but other factors are considered. Cost, transit time, and inventory stock requirements drive the decision over the strategy used. The following import inland strategies are well suited to the Translinked region: • Direct Rail to Inland DC Due to rising fuel prices, and potential future driver shortages, shippers have developed strategies to utilize the lower cost rail mode versus truck over the last few years. Containers are diverted to rail from truck, directly from the port to the inland DCs that are near to inland intermodal rail terminals. This strategy requires longer transit lead times due to slower rail transits as compared to trucking. • Transload Operations Truck costs can be lowered by consolidating Figure 4-5: Comparison of Container Sizes cargo at the port before it moves inland. Useable Capacity Container Size This is achieved by transloading three (cubic feet) international 40-foot containers into two domestic 53-foot containers or trailers at a transload facility. Two, instead of three Standard: 1,169 container loads move to inland DCs, where the cargo is then re-distributed to its final destination, or is trucked directly to retail Standard: 2,395 stores. In most cases, only very large High-Cube: 2,714 retailers, such as big box stores take delivery directly from the transload facility. High-Cube: 3,830 • Inventory Hold/Cross-Dock This strategy is designed for shippers who import goods, and warehouse them in DCs Source: TranSystems derived from The Hub Group on the coasts. Their customers, usually footwear or garment retailers, place Just-In- Time (JIT) orders as needed, where they take delivery of the goods at the coastal DC. Retailers benefit from this arrangement because they avoid inventory carrying costs. Trucking is the preferred mode for this strategy due to the need for fast and flexible transit. 13 The high-cube container had a height of 9 feet 6 inches compared to 8 feet 6 inches for a standard container. 14 The auto-max railcar has a height of up to 20 feet 2 inches. 48 | TranSystems
  • 53.
    Translinked Freight Study Industry Trend Analysis These strategies are used to deliver shipments to strategically placed DCs. As mentioned, the highest cost portion of an international supply chain is the trucking to the final destination, or so-called “last-mile” transportation. To illustrate this, consider a typical grocery store model. A single truckload delivers items to the DC, but many trucks deliver goods from the DC to grocery stores in a given area, resulting in higher “last mile” trucking expenses. To keep these expenses low, logistics managers consider the location of customers and clients, and select DC’s that produce the lowest last mile trucking costs. Figure 4-6 shows an example of a DC network optimization that calculates transportation costs, and identifies lowest cost locations for DCs. This analysis estimates locations based on customer density areas, using nine DCs. In this example, a distribution center in Detroit is responsible for cargo distribution to much of the U.S. Midwest, while a distribution center in Toronto is responsible for deliveries to Windsor, ON, which is just across the border from Detroit. Figure 4-6: Example of Distribution Center Network Source: TranSystems An alternative approach for the incorporation of the Translinked region into a distribution strategy is illustrated in Figure 4-7. In this case, the shipper reduces overall network costs by establishing cross-dock operations in markets previously served directly by the regional distribution centers. The cross-dock strategy facilitates more efficient local distribution. 49 | TranSystems
  • 54.
    Translinked Freight Study Industry Trend Analysis Figure 4-7: Example of Distribution Center and Cross-Dock Network Existing DC Network Is Looking for Ways to Reduce Transportation Costs New Network Incorporates DCs and Cross-Docks; Translinked Region Served via Cross-Dock Source: TranSystems 50 | TranSystems
  • 55.
    Translinked Freight Study Industry Trend Analysis 4.3 Real Estate Infrastructure Logistics managers choose warehouses and distribution center (DC) locations based on how they fit into the overall supply chain operating cost and product lead time standards. DCs that are located close to rail hubs, or that are located near to customers or suppliers, are desirable because they reduce trucking costs. Competing sites that satisfy transportation cost and service level considerations are evaluated based on the cost of the warehouse itself, labor costs, and increasingly, “green” considerations such as a having a small energy footprint, to select the final site location. Table 4-4 displays summary statistics on Table 4-4: Detroit MSA Warehouse Vacancy and industrial real estate, and the average hourly Lease Rates, Third Quarter 2011 wage for Transportation and Materials Moving Occupation workers for the Detroit Detroit MSA Metropolitan Statistical Area (MSA) 15. Over Total Space (million sq. ft.) 524.0 five hundred million square feet of Vacancy Rate (percent) 13.6% - 14.6% warehouse space reside within the Detroit MSA, and up to 14.6% of warehouse space Average Lease Rate $/sq. ft./yr) * $3.87 - $3.93 was available as of the end of September Transportation and Materials Moving Occupation 2011. The average wage for Transportation Mean Hourly Wage and Materials workers is higher than the U.S. Detroit-Warren-Livonia MI MSA $17.24 average, by $1.54 per hour, which may be of concern to supply chain managers evaluating U.S. Total $15.70 competing DC location options at the * Asking lease rate for Warehouse and Distribution Use Facilities > national level. 10,000 sq. ft Source: TranSystems, US Bureau of Labor Statistics, CBRE, Grubb and Ellis, and Colliers 15 The Detroit MSA includes Lapeer, Livingston, Macomb, Oakland and St. Clair counties. 51 | TranSystems
  • 56.
    Translinked Freight Study Industry Trend Analysis 4.4 Labor and Demographic Profile Figure 4-8 shows the number of employees by industry for the Detroit-Warren-Livonia District by Industry, Table 4-5: Detroit-Warren-Livonia, MI and the unemployment rate for the District between Employment by Industry Percent Changes between 2001 and 2011 2001 and August 2011. The Detroit-Warren-Livonia region unemployment rate rose sharply, particularly 10 Year Ten Year Sector CAGR Change between the years of 2008 and 2010, where unemployment reached 15.8 percent, and then fell back Trade and Transportation -2.2% -20.0% to 12.9 by August, 2011. The National Unemployment Professional Services -1.9% -17.3% Rate stood at 9.1 percent in August of 2011. Industries Manufacturing -5.6% -43.9% hit particularly hard by the downturn were the three Health and Education 1.7% 18.8% largest sectors in 2001. During the next 10 years, Trade and Transportation, Professional Services, and Government -1.1% -10.1% Manufacturing jobs fell by 20.0 percent, 17.3 percent, Hospitality Services -0.4% -3.9% and 43.9 percent respectively. Only Healthcare and Financial Services -1.8% -17.0% Education shows a positive trend over this time period, growing by 1.7 percent per year, and 18.8 percent over Mining and Construction -4.4% -36.4% ten years. While most segments improved, or halted Information Services -2.7% -23.6% their declines in 2010, only the Government and Source: TranSystems and US Bureau of Labor Statistics Hospitality sectors continue downward; although neither of these sectors experienced sharp declines similar to the Transportation, Professional Services or certainly the Manufacturing sectors. Table 4-5 displays changes in growth for industries shown in Figure 4-8. Figure 4-8: Detroit-Warren-Livonia, MI Number of Employees by Industry, August Year over Year, 2001 – 2011 (000) Source: US Bureau of Labor Statistics 52 | TranSystems
  • 57.
    Translinked Freight Study Industry Trend Analysis 4.5 Business and Tax Environment In 2007, the State of Michigan changed its business tax code, replacing a modified Value Added Tax (VAT) with the Michigan Business Tax (MBT). The MBT was considered to be difficult to administer, especially for smaller firms that did not typically have dedicated tax accounting personnel. The MBT will itself be replaced in the 2012 tax year with a Corporate Income Tax (CIT), which will assess business tax at a simple rate of 6 percent. CIT compliance requirements are far less cumbersome than the MBT, and the new taxation approach is viewed as a positive development, especially for medium to small sized business. A component of the MBT that remains as a stand-alone tax in 2012 is a Personal Property Tax (PPT). Under the MBT, Table 4-6: Tax Foundation Business credits for machinery and equipment are allowed. The PPT Tax Climate Rank for Selected States effective in 2012 eliminates credits for machinery and U.S. Rank equipment. This tax disproportionately affects manufacturing companies with large equipment inventories; 2006 2011 however, there is an effort underway to repeal the PPT in Indiana 12 10 its entirety. Michigan 28 17 Under the new CIT, almost all tax incentives have been Illinois 26 23 eliminated, and the focus is to grow existing Michigan Wisconsin 37 40 business, while de-emphasizing attempts to attract business Ohio 47 46 from outside of Michigan. Source: Tax Foundation The effects of the Michigan tax changes are unknown at this time; however, The Tax Foundation, which is an organization that ranks States by their “Business Tax Climate”, moved Michigan up 11 places, to 17th place in 2011 from 28th place in 2006. Table 4-6 provides ranking for Michigan and its top interstate trading partners. Of the East North Central States, only Indiana provides a better tax climate than Michigan, according to the Tax Foundation. 4.6 Foreign Trade Zones One trend for companies involved in international trade that has been growing globally, is the use of foreign trade zones (FTZ) for certain types of activities where these zones can provide economic benefits to clients. Customs duties are deferred, or even reduced for items that are stored or handled in a FTZ. For imported cargo simply stored in a FTZ, payment of customs duties are deferred for the length of time the cargo remains within the FTZ. This can be especially useful for warehoused goods that are awaiting sale, where sellers do not have to carry the import duty costs until after the sale of merchandise is actually transacted. Manufacturers or product assemblers also benefit from the use of a FTZ because in many cases, individual imported components of an item carry higher import duties than does the assembled item itself. A feature of a FTZ is that all components used in the manufacturing or assembly of an item are assessed at the rate of the assembled item, at a lower duty rate. Domestic items can also be used in FTZ product assembly. Products exported from a FTZ are free of duty and tax. Import cargo from Asia and Europe may benefit from FTZ tax and import duty reduction programs. Canadian goods, which are not assessed import duties under NAFTA, gain no particular advantage of FTZ processing, unless they are co-mingled with cargoes that are subject to import duties. 53 | TranSystems
  • 58.
    Translinked Freight Study Industry Trend Analysis When considering the overall suitability of the Translinked region as a logistics hub, FTZs are a required feature, but do not necessarily provide a logistical advantage because they can be established almost anywhere in the country. The region has gained much experience in the set-up and operation of FTZs, mainly due to the automotive industry’s participation in the 1980’s and 1990’s, and assistance to companies interested in setting up FTZ status in the Translinked area is readily available. Finally, having a FTZ is not an advantage, but not having one is a distinct disadvantage for firms that require FTZ services. 4.7 Trends in Transportation and the Near-Term Outlook 4.7.1 Trucking Industry The near-term outlook for the U.S. trucking industry is for rising costs due to rising diesel fuel prices and steadily increasing constraints on labor supply. There is likely to be a continued modal shift away from over- the-road to rail intermodal for highway truckload shipments, and a corresponding need for shippers to be more aligned with intermodal as their distribution networks evolve. Shippers are expected to face increases of 9 to 18 percent in trucking rates by 2012, due to rising truck fuel and labor costs, and will step up efforts to explore opportunities for network changes to substitute intermodal for truck. Trends in the Trucking Industry: 1995 to 2010 • The volume of trucking activity in the United States, both for-hire and private, is about 8.5 billion tons of freight, accounting for about 70 percent of U.S. freight tons and 40 percent of ton-miles (U.S. Bureau of Transportation Statistics, Commodity Flow Survey). • Truck shipments, measured by number of Truckloads Figure 4-9: Indexes of Trucking Volume (TL and LTL), U.S. (TL), Less-Than-Truckload Industrial Production and Real GDP: 1995-2010 (1995=100) (LTL) tons, etc., have tended to move in tandem with the growth of the U.S. economy and U.S. industrial production, represented by Real GDP and the Industrial Production Index (IP), respectively. Figure 4-9shows these relationships on an annual basis from 1995 to 2010, highlighting the most recent years of recession and recovery, 2008-2010. As shown in Figure 4-9, TL volume tended to grow at a somewhat faster rate relative Source: American Trucking Associations; TranSystems’ estimates to the economy (GDP and IP) from 1995 to 2002, and then at a slower rate from 2002 to 2010. The slower growth relative to GDP reflects the growing importance of services relative to goods in the U.S. economy. However, there is even a clear decline in truck volume relative to Industrial Production, which indicates both modal substitution (e.g., rail for truck) and changing logistics networks. 54 | TranSystems
  • 59.
    Translinked Freight Study Industry Trend Analysis • The falloff in truckload volume relative to the economy was particularly severe in the recession year of 2009. By contrast, the growth of LTL tonnage tended to lag the overall economy for the entire period. Also, as shown in the highlighted section of Figure 4-9, both TL and LTL volume significantly lagged the recovery in 2010. Finally, Figure 4-9 shows that the growth of both TL and LTL volume was far more variable over time than the overall economy. • Trucking pricing and revenue have tended to lag the overall economy as well. Exhibit II shows annual indexes of TL revenue per load and LTL revenue per ton, adjusted for inflation, from 1995 through 2010. As shown in Figure 4-10, the TL index fell significantly from 1995 to 2003, recovered strongly from 2003 to 2006, then fell again from 2006 to 2009, particularly in the recession year of 2009, and recovered slightly during 2010. By contrast, the LTL index increased through 2006, and then flattened in 2007-2008 before declining sharply in 2009. Even in the recovery period of 2010, real LTL revenue per ton continued to decline. • Figure 4-10 also shows that Figure 4-10: Indexes of Real Revenue per Load for Truckload this overall fall in real revenue Freight versus Real Diesel Fuel Prices: 1995-2010 (1995=100) per load occurred during a period of rapidly rising real fuel prices. For example, by 2008, inflation-adjusted prices of diesel fuel were, on average, 2.5 times the level in 1995. Although fuel prices fell sharply after mid-2008, by 2010, they were still more than double the level of 1995 and continued to rise into 2011. The inability of truckers to raise rates in the face of rising fuel prices is largely due to competitive forces. In the case of TL freight, rail Source: American Trucking Associations; U.S. Dept. of Energy, EIA; intermodal shipments have TranSystems’ estimates increased their share of longer-haul segments, and LTL shipments have been displaced by competition from small package operators. This severe cost-price squeeze has led to sharp deterioration in finances for many trucking companies and owner-operators. • In addition to rapidly rising fuel prices, many trucking companies and owner-operators have faced increased difficulty in obtaining financing and in recruiting drivers. This has particularly affected the relatively long-haul segment of the industry (length of haul over 1,000 miles), as shown in Figure 4-11, which presents annual TL volume for 1996-2010 in three broad categories of length-of-haul. TL volume in the long-haul segment fell 25 percent from the peak in 1999 to 2010. The long-haul segment is where the difficulties of recruiting drivers have been most acute. 55 | TranSystems
  • 60.
    Translinked Freight Study Industry Trend Analysis • Meanwhile, Figure 4-11 also shows that both the medium-haul (500-1,000 miles) and short-haul (less than 500 miles) segments grew significantly over the period. The medium-haul segment grew the fastest, especially through 2007, but has since declined sharply. Indeed, the medium-haul segment showed the most rapid decline in the recent recession and also the slowest recovery. In the case of both the medium-haul and long-haul segments, there has been major competition from rail intermodal service. Intermodal has long been making inroads on the long- haul traffic lanes, driven by Figure 4-11: Indexes of Truckload Loads by Length-of-Haul rapid growth in international Segment: 1996-2010 (1996=100) container volumes, particularly for those very long length-of-haul lanes (1,500-3,000 miles) between the West Coast and the Midwest, Gulf and Eastern Seaboard. However, more recently, with heavy investment in rail infrastructure, and as rail service performance and operating cost have steadily improved relative to highway shipments, rail intermodal has gained share in the medium- haul traffic lanes as well, Source: American Trucking Associations and TranSystems’ estimates particularly in rail-eligible lanes east of the Mississippi River. Trucking Industry Outlook for 2011-2012 • Looking forward, as the U.S. economy continues to gradually recover from the recession; the trucking industry will be faced with continued and even more intense constraints on growth and upward cost pressure. The supply of truck drivers has been the major constraint over the last several years, and this constraint will be exacerbated by three major developments on the regulatory front: o Compliance, Safety and Accountability (CSA) initiative – The U.S. Department of Transportation (DOT) has placed increased emphasis on tracking of large over-the-road vehicles—buses and trucks—to identify and address safety issues. Truck drivers with less-than-perfect safety performance will be more rapidly removed from the pool of eligible drivers. o Hours-of-Service Regulations – Further limits on driving hours per week or per day and stricter enforcement of those limits will increase the number of drivers required for a given amount of freight movement. DOT will implement further restrictions beginning in late 2011 or early 2012. o Increased scrutiny on illegal aliens – as truck drivers’ licenses come up for renewal, those unable to provide documentation of U.S. citizenship will be denied a license. Ultimately, this might affect up to 10 percent of drivers. 56 | TranSystems
  • 61.
    Translinked Freight Study Industry Trend Analysis • An offsetting effect on the supply of driver labor is the potential for allowing Mexican truck drivers to enter the U.S. However, this is not a certainty, and, in any case, only applies to cross-border shipments, as Mexican drivers would still not be permitted to move freight on traffic lanes within the U.S. o A constraint on Mexican truck transportation is being caused by increasing violence in the northern Mexican states, which is prompting shippers to consider the more secure rail option when possible. • In addition to driver constraints, the industry will encounter equipment shortages due to increasingly stringent financial requirements placed on borrowers, which are particularly constraining for poorly- financed firms and owner-operators in the long-haul segments of the market. At the same time, there is a strong possibility (although it is far from certain) that diesel fuel prices will continue to climb toward previous peak levels in 2008. • The effects of these regulatory and economic factors will generally be to reduce supply and raise prices in over-the-road trucking. The effect on shippers will vary by traffic lane and will depend on the lengths- of-haul and presence of viable competition from rail in a particular lane. In cases where rail intermodal competition exists, over-the-road service will continue to rapidly lose share to rail, especially as railroads continue to invest heavily in the infrastructure for intermodal—both terminals and right-of- way. As fuel prices increase, the prices of both rail and truck will increase, but overall, truck prices will rise relative to rail. In addition, shortages of drivers and over-the-road equipment will put highway trucking at an increased disadvantage, particularly for longer length-of-haul traffic lanes and during periods of peak seasonal demand. Rail competition will limit price increases in these lanes. For traffic lanes not well-served by rail, however, truckers will have significant pricing power and rates will rise sharply. On average, supply constraints due to labor and equipment will increase truckload rates by 5 to 10 percent by 2012 over 2010 levels, with larger increases occurring in lanes that face no intermodal competition. In addition, increases in diesel fuel prices could add up to 10 percent in additional truckload rate increases by 2012. • In view of these factors, the outlook for the next two years, 2011-2012, is for a continued steady decline of the highway share of Medium-to-Long-Haul shipments. In fact, with the increased constraints on the supply of drivers, there may even be a decline in the amount of longer-haul over-the-road TL shipments, even with a continued recovery of the U.S. economy. • Therefore, shippers are advised to be alert to impending truck shortages and rate hikes, particularly during periods of peak seasonal freight movement. Longer term, shippers should consider orienting their distribution networks, to the extent possible to take maximum advantage of rail intermodal, where there are no comparable constraints on supply. 4.7.2 Trends in U.S. Containerized Trade The international container trade, particularly imports, is by far the fastest-growing driver of freight transportation activity in the U.S. In terms of tonnage, the international container trade (there is a moderate-size domestic container trade, mainly between the mainland U.S. and Alaska, Hawaii and U.S. territories) accounts for approximately 3 percent of the U.S. freight market. However, when measured in ton-miles, it is nearly 12 percent. Moreover, a substantial portion of the freight traffic moving in the U.S. classified as “domestic” is actually imports moving from import distribution centers in the vicinity of the inbound ocean ports to second-tier warehouses or to final destinations. Similarly, a significant portion of 57 | TranSystems
  • 62.
    Translinked Freight Study Industry Trend Analysis export freight moves as “domestic” from interior U.S. origins to ports for loading into containers to be shipped to overseas destinations. The growth of the international container trades to and from the U.S. averaged 5.3 percent per year over the past 15 years, with imports growing at a faster annual rate, 6.4 percent, and exports growing at 3.8 percent. The growth of the total international container trade was 6 to 7 times the annual growth rate of about 0.8 percent per year for domestic freight over the same period. Although growth of the container trade is likely to slow considerably over the next several decades, it will still be significantly faster than domestic, and developments in international trade will continue to play an increasing role in shaping the pattern of freight flows and logistics networks in the U.S. The following sections describe the container trade, its size, geographic distribution, commodity composition and growth; the major trends in the trade and their effects on transportation and distribution patterns in the U.S.; and the impact on the Midwest and the Translinked area. Growth of Containerized Imports and Exports In 2010, the most recent full year for which data are available, containerized imports into the U.S. from foreign overseas ports totaled 16.9 million twenty-foot equivalent units (TEU) and exports from the U.S. to foreign destinations totaled 11.0 million TEU. Domestic shipments between the U.S. Mainland and Alaska, Hawaii and U.S. territories totaled an estimated 2.9 million TEU. Figure 4-12 shows the fifteen-year Figure 4-12: Growth of U.S. Containerized Import and Export trend in containerized imports Loads, 1995-2010 and exports, 1995 to 2010. As shown, the growth of imports over this period, 6.4 percent annually, far outpaced the growth of exports, 3.8 percent. Due to the disparity in growth, the ratio of import to export TEU increased sharply, from 1.07 in 1995 to a high of 2.14 in 2006 and 1.54 in 2010. This import/export imbalance has had major implications for the routing of both domestic and international loads in the U.S., as explained below. Source: JOC Piers and TranSystems’ estimates The relatively rapid growth of imports over this period is mainly due to an unprecedented growth in goods consumption in the U.S. and an acceleration of the trend toward off-shoring of production of both consumer goods and related capital goods. After falling almost continuously from the end of World War II, the share of goods in total U.S. consumption began to rise in the early 1990s and continued a gradual increase up to 2007. The rapid growth in goods consumption was further boosted by the housing market boom of 2002-2007, which increased the demand for such goods as Building Materials and Furniture, which were being increasingly sourced from overseas, and produced a “wealth effect” on consumption from rising 58 | TranSystems
  • 63.
    Translinked Freight Study Industry Trend Analysis home values. However, when the housing boom turned to bust, containerized imports reversed course. In 2007, imports declined slightly, and then in 2008, by 7.9 percent, the first significant yearly decline ever. This was followed by a further 14.9 percent in 2009. Even with a 13.1 percent increase in 2010, imports were still 11.3 percent below the peak annual volume reached in 2006. Exports grew at a rate substantially less than imports over the past 15 years, but overall have had a more robust performance than imports since 2006, as shown in Exhibit I. The key reasons for the recent surge in exports are a sharp decline in the U.S. Dollar relative to most major overseas currencies and continued strong growth of production and incomes in overseas economies. The sourcing of U.S. imported merchandise has been increasingly Figure 4-13: Far East as a Share of U.S. Containerized Imports dominated by Far East countries, and Exports, 1995-2010 particularly China. Figure 4-13 shows that for imports, the share of the Far East increased from 59.9 percent in 1995 to 69.7 percent in 2010. By contrast, the Far East share of U.S. exports was essentially the same, 50.1 percent, in both 1995 and 2010. But with imports still the “heavy leg” in U.S. container trades, the steady shift to sourcing from the Far East tended to increase the role of West Coast port gateways. Impact of Container Trade on Source: JOC Piers and TranSystems’ estimates the U.S. Supply Chain The effect of the container trade on transportation and logistics in the continental U.S. depends on the particular commodities moved. Imports are mainly relatively high-value, light-density consumer goods and related capital or semi-finished goods, which are mainly sensitive to trends in U.S. real disposable income, industrial production and wealth. By contrast, exports tend to be lower-value raw or semi-finished products, sensitive to the value of the U.S. Dollar relative to other currencies and growth of overseas economies. Trends in commodity composition are shown for containerized imports and exports in Figure 4-14. For imports, those commodities most closely related to housing led the surge over the period 1995 to 2006, increasing their share of total imports from 14.8 percent to 24.1 percent over this period. However, these same commodities fell most rapidly in the 2007-2009 downturn, and stayed well below their peak share during the 2010 recovery. The share of the highest-value imports—Electronics, Apparel, Industrial Machinery, etc.—remained remarkably constant over the entire 1995-2010 period, falling only slightly from 37.8 percent in 1995 to 36.9 percent in 2010. Trends in exports show an increasing share of the lowest-value commodities—Forest Products, Recycled Material, etc.—although certain higher-value commodities such as Vehicles & Parts showed significant growth. The lowest-value export commodities increased their share from 33.5 percent in 1995 to 41.0 percent in 2010, and this was largely due to increased demand from China. 59 | TranSystems
  • 64.
    Translinked Freight Study Industry Trend Analysis Since containerized imports are oriented toward consumer goods, the geographic distribution of these goods by their ultimate destination in the U.S. tends to resemble the distribution of the population. By contrast, exports tend to originate in the coastal areas near container ports. The mismatch between the origin of exports and the destination of imports leads shippers to use domestic freight to reposition back to the port of entry those containers carrying imported merchandise to inland destinations. Figure 4-14: Trends in the Composition of U.S. Containerized Imports and Exports, 1995-2010 Source: JOC PIERS and TranSystems estimates Interior destinations such as in the Midwest are primarily served by intermodal rail service from the port of discharge. Destinations near the coasts are served either by truck from a nearby ocean port, or, in the case of many imports from the Far East, by intermodal service from West Coast ports. However, increasingly for long-distance inland movements—by rail or truck— international containers, 20-foot and 40-foot, are being unloaded at locations close to the discharge ports and their merchandise is reloaded into higher-cube domestic containers, normally 53-foot units. This transfer is done either at special-purpose transloading facilities or, more often, at Import Distribution Centers (IDCs) near the discharge ports. The capacity of two 53-foot domestic containers can typically absorb the contents of three 40-foot international containers, and this produces significant savings on inland linehaul costs. In addition, the “round-trip” economics of the inland shipment are improved with the 53-footer, which can be more easily repositioned back to the port area loaded with domestic freight. By 2010, the major California ports handling containerized imports—Los Angeles, Long Beach and Oakland—were shipping an estimated 55 percent of imported merchandise to inland destinations via high-cube domestic containers. The trend to transferring imported merchandise from 60 | TranSystems
  • 65.
    Translinked Freight Study Industry Trend Analysis 20- and 40-footers into 53-foot units also increases the importance of IDCs in areas near major containership ports. It is also important to note that the transfer of the imported merchandise from an international container to a domestic unit, whether in a straight transload or via an IDC, changes the designation of the shipment from “international” to ‘domestic,” even though, in most cases, the merchandise hasn’t changed in any significant way. This is seen in a high percentage of so-called domestic freight coming in from a coastal origin to an inland metro area such as Detroit that is labeled “Warehouse and Distribution” freight. Most of this is essentially imported merchandise. All-Water versus Intermodal Service for Far East Imports Despite the proximity of West Coast ports to Far East markets and the widespread availability of intermodal rail service from West Coast ports to destinations in the interior as well as the East Coast and Gulf Coast, the West Coast has lost share of the Far East trade over the past 10-15 years. The West Coast share of Far East containerized imports went from a high of 85.1 percent in 1997 down to 71.4 percent in 2009. Geographically, the main destination areas affected by this shift were points along the U.S. Eastern Seaboard. Starting around 1997, rapid growth of Far East imports produced a series of intermodal service failures on the West Coast, particularly at the largest port complex, L.A./Long Beach. These failures accelerated the shift, already underway, of major retailers such as Walmart, Target and Home Depot to diversify their import distribution away from too much reliance on West Coast port gateways. Ocean carriers accommodated these shifts by expanding capacity and improving service to East Coast and Gulf Coast ports. The share of Far East imports moving in “all-water” service (AWS) through the Panama Canal and Suez Canal to East Coast ports (and, beginning in 2004, Gulf Coast ports) was the mirror image of the fall in the West Coast share. Most of the AWS traffic is “eastbound” from the Far East via the Panama Canal, but more recently, since 2007, vessel deployments from the Far East are moving “westbound” via the Suez Canal, particularly where vessels are too large to fit through the Panama Canal. Such westbound deployments also include not only U.S. East Coast ports, but also ports in Eastern Canada such as Halifax, and several U.S. and Canadian ports can provide reverse intermodal rail service for Far East imports to inland destinations such as Detroit. The trend toward increased share of AWS was halted in 2010, however, as the West Coast share of the Far East increased slightly to 72.1 percent versus a low of 71.4 percent in 2009. Moreover, there is a significant likelihood that AWS share of the Far East may stop increasing and even decline going forward. There are several reasons for this, and international distribution to the Midwest and other interior locations is a key determinant. • In the first place, the major gains in AWS share of Far East imports have already been achieved. For example, in 2000, about 60 percent of Far East imports to destinations in the Northeastern U.S. were shipped via intermodal service over the West Coast, but by 2010, that share had fallen to less than 6 percent, meaning that over 94 percent of these shipments were entering the U.S. via East Coast ports. Similar conditions prevail in the Southeast. • Secondly, the Eastern Seaboard region, which has the highest potential for AWS, is growing relatively slowly as U.S. population and industry gradually move in a southwesterly direction. • Finally, the railroads have sharply improved the performance of their intermodal services off the West Coast, and, at the same time, AWS ocean carriers have shifted to so-called “slow steaming” in order to reduce fuel costs and mitigate air pollution. These developments have led to an 61 | TranSystems
  • 66.
    Translinked Freight Study Industry Trend Analysis improvement in the overall service performance of West Coast intermodal over East Coast services, especially for high-value, time-sensitive cargo. • Even if AWS maintains its very high share of the Eastern Seaboard destinations, it is unlikely that AWS could be substituted for intermodal service from the Far East to the interior of the U.S., particularly the Midwest. The routings via the Panama Canal to the interior are too circuitous to make sense and for either Canal, the transit time differential between AWS and intermodal service off the West Coast would be even greater than for shipments to the Eastern Seaboard. The only significant potential for shipments from the Far East to Midwest destinations via East Coast ports is for westbound traffic using the Suez Canal. However, the potential for these routings appears to be minimal. 4.7.3 Trends in Intermodal Rail Intermodal rail volumes in the U.S. and Canada have grown at an annual rate of 2.6 percent over the last decade, as Figure 4-15: Annual North America Intermodal Rail Volume, 2000 to 2010 shown in Figure 4-15. Like most segments of the U.S. freight market, intermodal rail volume in the most recent full year, 2010, is still well below its peak. In the case of intermodal, 2010 volume, at 13.4 million loads, is still 5.9 percent below the peak volume of 14.2 million loads in 2006. Exhibit I also shows that growth of intermodal has been volatile over this period, particularly from 2007 to 2010, a period of deep recession followed by partial recovery. Intermodal growth has also varied by Source: IANA type of equipment. As shown in Figure 4-16, use of standard truck trailers in intermodal service declined sharply over the period 2000-2010, at an annual rate of -5.0 percent, while the share of container loads, both international and domestic, increased at a rate of 5.0 percent per year. Exhibit II also shows that among the containers, the fastest-growing are the 48- and 53-foot high-cube units, growing at a rate of 7.4 percent annually. With the percentage of high-cube domestic containers growing rapidly (and 53-footers rapidly replacing 48-footers), the merchandise moving in containers is growing at an even faster rate. When adjusted for container size, it is estimated that the growth of merchandise moving via intermodal service in containers is growing at a rate of 5.6 percent per year from 2000-2010, which is about twice the rate of growth of the U.S. and Canadian economies (Real GDP) over this period. The fastest-growing intermodal markets are long length-of-haul (1500+ miles) east-west traffic lanes, particularly those associated with containerized imports moving through ports on the West Coast to points east of the Rockies. Container volumes on these lanes have been growing at a rate two to three times as fast as the real growth of the U.S./Canadian economies, particularly with a growing dominant share of the Far East as a source of merchandise imports. In addition, since 2008, domestic intermodal volumes have gained an increased share of medium-haul (500-1,500 mile) traffic lanes at the expense of over-the-road truck service. 62 | TranSystems
  • 67.
    Translinked Freight Study Industry Trend Analysis The growth of international container volume is the principal driver of rail Figure 4-16: Growth of North America Intermodal Service intermodal growth, and loads arising by Equipment Type, 2000 to 2010 from international imports or exports (mostly imports) account for about 60 percent of total intermodal loads. The share of international in total intermodal volume is even greater when expressed in terms of container- miles or ton-miles, because, as noted above, international loads are typically moving in the long length-of-haul traffic lanes. In terms of container (or trailer)- miles, international accounts for about 75 percent of total intermodal volume. However, as noted above, more recently intermodal has made significant gains in the domestic freight Source: IANA market, as • Operating costs of over-the-road truck service have risen rapidly relative to rail and are expected to increase further, due to substantial increases in the price of diesel fuel and intensifying shortages of truck driver labor. The threat of a labor shortage is particularly prevalent in medium- and long-haul traffic lanes, and could create spot shortages of truck service, particularly in peak months. • Rail service (e.g., transit speed and reliability, terminal dwell Figure 4-17: Quarterly Average Intermodal Train Speeds times, service frequency and for North American Class I Railroads, 2000-2010 coverage of origin-destination pairs) continues to improve due to major rail investments in infrastructure, such as expanded terminal facilities and improved right-of-way. As an example of improved rail service, Figure 4-17 presents quarterly data on the average intermodal linehaul speeds, in miles-per-hour (mph), for the two major U.S. western railroads, the BNSF and the UP, from the first quarter of 2000 to the fourth quarter of 2010. BNSF’s average intermodal train speed Source: IANA increased from a low of 30.5 mph in third quarter 2004 to a high of 39.3 mph in second quarter 2009. The latter quarter was near the trough of the recent recession and was positively affected by light traffic volume, but even by fourth quarter 2010 after a substantial recovery in traffic, BNSF average speed was 36.3 mph or 19 percent faster than the low point. Similarly, the UP’s 63 | TranSystems
  • 68.
    Translinked Freight Study Industry Trend Analysis average speed increased from a low of 24.3 mph in fourth quarter 2005 to a high of 33.6 mph in third quarter 2009 and most recently at 32.4 mph in fourth quarter 2010, or a 33 percent improvement over the worst quarter. Also, the improvements in transit speed for both BNSF and UP by fourth quarter 2010 were achieved with substantially greater traffic volumes than in their periods of slowest intermodal train speeds. Containers and Transloading As shown in Figure 4-16, the container is rapidly becoming the dominant unit for intermodal transport in the U.S. and Canada, and higher-capacity containers are increasing their share of both international and domestic intermodal shipments. In 2000, the first year for which data are available, intact highway trailers accounted for 27.2 percent of total intermodal moves, and detached containers, both international (20-, 40- and 45-foot) and domestic (48- and 53-foot), the other 72.8 percent. By 2010, the share of intact highway trailers had fallen by more than half to 12.6 percent of total intermodal moves. Since 2000, use of containers has grown dramatically with the relatively rapid growth of international and the increasing dominance of double-stack service (DSS). The use of higher-cube domestic containers, particularly the 53-foot units, has grown most rapidly. Use of domestic 53-foot containers has been spurred by their role in transloading of inbound international containers at locations close to the inbound container port for movement inland. This transloading is performed at special-purpose trans-load facilities or, more often, at Import Distribution Centers (IDCs) for inland movement. Typically, the contents of three 40-foot international containers can fit inside two 53-foot units, and this conversion • Saves on rail linehaul and destination drayage costs • Provides for more efficient repositioning of units with loads back to container port areas • Allows importers to re-allocate merchandise by destination at a point in time only 5 to 10 days before scheduled delivery, providing a better match between supply and consumer demand. By 2010, containers accounted for 87.4 percent of intermodal loads (and an even higher share of intermodal ton-miles). The share of 53-foot containers was about 31 percent in 2010, up from 8 percent in 2000. Moreover, as noted earlier, 53-foot containers have significantly larger cubic capacity and account for an estimated 38 percent of the merchandise moved in intermodal transit. West Coast Intermodal versus All-Water and East Coast Intermodal As noted in an earlier section on the international container trade, the growth of the international component of intermodal volume has been affected by the change in share of West Coast discharge versus East Coast or Gulf Coast discharge of containerized import cargo. • The West Coast share of imports has tended to increase, due to the growing dominance of Asia, particularly China, as the source of containerized merchandise. Approximately 60 percent of Asia- origin cargo discharged at West Coast ports makes its way (either as intact international containers or trans-loaded domestic containers) to destinations east of the Rocky Mountains, and nearly all of this traffic moves via intermodal. • However, the extraordinarily rapid year-in/year-out growth of the Asia trade beginning in the late 1990s led to a deterioration of intermodal service off the West Coast, and a steady shift to alternative routes from Asia via the Panama and Suez Canals to East and Gulf Coast locations. The share of such all-water service (AWS) from Asia increased from a low of 14.8 percent in 1997 to a 64 | TranSystems
  • 69.
    Translinked Freight Study Industry Trend Analysis high of 26.7 percent in 2009. Destinations on the Eastern Seaboard within 200 miles from the East Coast shifted almost entirely to AWS. • At the same time, import cargo via East Coast ports from Europe or via the Suez Canal to destinations in the Midwest shifted from highway truck to intermodal. This service was enhanced due to major initiatives by Eastern railroads like CSX’s National Gateway and Norfolk Southern’s Heartland Corridor. • Beginning in mid-2009, the share of Asia-origin import cargo discharging on the West Coast began to rise again. For the full year 2010, the West Coast share increased to 73.1 percent, up from 71.8 percent in 2009. The main reasons for this shift appear to be (1) the exhaustion of opportunities for expansion of AWS to destinations on the Eastern Seaboard, and (2) the improvement in intermodal service relative to AWS—including the steady improvement in intermodal transit speeds referenced above, and the advent of “slow steaming” in AWS vessel deployments. • The re-emergence of the West Coast advantage appears to have significant staying power. The AWS share is not likely to exceed the peak in 2009 even after the expansion of the Panama Canal in 2014-15 increases the capacity and potentially lowers unit costs of AWS. Implications for the Midwest The Midwest share of total North America intermodal traffic has generally increased over the last decade, and the main driver of this increase in share has been inbound loads with imported merchandise. As shown in Figure 4-18, Midwest inbound volume increased from 2.55 million loads in 2000 to 3.53 million in 2010, a compound annual growth rate of 3.3 percent, well above the overall North America intermodal growth rate for Figure 4-18: Midwest Inbound Intermodal Volume from 2000-2010 of 2.6 percent. For West Coast and Share, 2000 to 2010 shipments originating on the West Coast, most of which are imported merchandise, Midwest destination volume increased at a still faster annual rate of 4.5 percent, and the Midwest share of intermodal shipments originating on the West Coast increased from 38.7 percent in 2000 to 45.8 percent in 2010. The composition of intermodal loads into the Midwest has been shifting more towards high-cube 53-foot domestic containers and a lower percentage of 20-, 40- and 45-foot international containers. For example, Source: IANA in the West Coast-to-Midwest intermodal market, the share of 48- and 53-foot container loads increased from a low of 18.6 percent in 2005 to 30.0 percent in 2010. The increased share of the high-cube domestic container suggests that import containers moving through West Coast ports with merchandise ultimately bound for the Midwest are increasingly being unloaded on the 65 | TranSystems
  • 70.
    Translinked Freight Study Industry Trend Analysis West Coast with their contents transferred to high-cube domestic containers. Therefore, an increasing percentage of this import merchandise has already been through one “tier” of import distribution by the time it reaches a Midwest destination. Accounting for the higher cube of the domestic container, approximately 40 percent of the import merchandise coming through the West Coast to the Midwest has already been through one tier of distribution. This tends to reduce the share of total import distribution activity in the Midwest. The remainder of inbound intermodal volume into the Midwest is domestic loads plus a relatively small amount of import loads via East Coast and Gulf Coast ports. These loads grew at an average annual rate of 1.9 percent from 2000 to 2010, well below the overall average North America intermodal growth of 2.6 percent. Among the import loads via East and Gulf ports, an increasing percentage of the first-tier import distribution is handled in the area of the ports. The flow of intermodal freight to and from the Detroit BEA is similar to that of the total Midwest area. Figure 4-19 presents estimates for 2009 of total intermodal tonnage inbound to and outbound from the Detroit BEA for 2009 (see analysis Section 2.6.3). As shown, most of the largest intermodal lanes are inbound from and outbound to port related BEAs – Los Angeles, New York, Seattle, Norfolk and Jacksonville. In the case of these port-related BEAs, the “import” designation represents only those imports that are moving “intact” in international containers destined for plants or first-tier distribution warehouses in the Detroit area. As noted previously in Section 2.6.3, a substantial portion of what is labeled “domestic” actually represents freight that is essentially still import merchandise that has moved through an IDC or a transload facility and will be part of second-tier distribution in the Detroit BEA. For exports, a portion of freight that is labeled as “domestic” moving from the Detroit BEA is actually export cargo, to be transferred to export containers at the port. Figure 4-19: Detroit BEA - Top-10 U.S. Intermodal Rail Lanes by Cargo Tons in 2009 Source: Derived from IHS Global Insight Transearch Data In summary, growth of Midwest and Translinked region distribution activity has been increasingly driven by the relatively rapid growth of import merchandise, but the Midwest role in the distribution of much of that 66 | TranSystems
  • 71.
    Translinked Freight Study Industry Trend Analysis merchandise is shifting to second-tier. This is not to say that the Midwest role in first-tier import distribution is disappearing—indeed, in 2010 an estimated 60 percent of import merchandise to the Midwest via the West Coast is either going to a manufacturing facility or first-tier distribution. However, the percentage appears to be declining. 4.8 Representative Service Providers and Shippers A sample of major logistics service providers within the study region is presented in Table 4-7 and Table 4-8. The value added services provided by such companies, such as trucking, warehousing and distribution, enable shippers to service population and industries within the Translinked region and in surrounding areas. The companies and services support the various supply chain strategies and freight flows discussed in this study. Table 4-7: Sample of Logistics Providers in the Study Region – Located in Michigan Provider Value Added Services Offered Location Michigan All American Warehouse and Cold Storage Refrigerated warehouse services Detroit APL Logistics Warehousing, 3PL transportation contractor Farmington Bay Logistics Inc. Warehousing, 3PL transportation contractor Various Detroit Machinery Center Inc. Warehousing, transportation services for Detroit machinery and parts Expeditors Intl. Air freight, ocean freight, customs Romulus brokerage, trucking, warehousing, logistics FedEx and FedEx SmartPost Small package, truckload and LTL trucking, Detroit logistics, ocean and air freight management, supply chain management Freezer Services of Michigan Refrigerated storage, import/export Detroit inspection, blast freezing, rail access Furniture Turn LLC Furniture manufacturing and distribution Detroit Hollingsworth Logistics Management, L.L.C. Hollingsworth Logistics Management, L.L.C. Dearborn JB Hunt Warehousing, 3PL transportation contractor Detroit Kuehne & Nagel Air freight, ocean freight, customs Romulus brokerage, trucking, warehousing, logistics Nippon Express Air freight, ocean freight, customs Romulus brokerage, trucking, warehousing, logistics NorthGate Warehousing and distribution of automotive Flint parts UPS Small package, truckload and LTL trucking, Livonia, Grand logistics, ocean and air freight management, Rapids, Taylor, supply chain management Madison Heights Source: Hoovers and TranSystems 67 | TranSystems
  • 72.
    Translinked Freight Study Industry Trend Analysis Table 4-8: Sample of Logistics Providers in the Study Region – Located in Ohio and Ontario Provider Value Added Services Offered Location Ohio Cauffiel Technologies Corp. General warehousing, manufacturing and Toledo distribution services for the steel industry CSX Intermodal Yard Intermodal rail terminal North Baltimore Midwest Terminals Port terminal, warehousing Toledo Toledo Harbor Warehousing Corp. Freight consolidation, trucking warehousing, Toledo cross-docking, trans-load services Ontario Cargill Grain Warehousing Sarnia Cole International Freight forwarding, 3PL warehousing and Windsor transportation, Con-Way Freight Trucking, and Less then Truckload (LTL) Windsor services' Harbour Warehousing All purpose warehousing complex with rail Sarnia access Laser Transport, Inc. Trucking warehousing, distribution Windsor VersaCold Canada Corp. Warehousing and processing of refrigerated Chatham-Kent and frozen food products Wolverine Freight Systems Trucking, warehousing and distribution Windsor Source: Hoovers and TranSystems 68 | TranSystems
  • 73.
    Translinked Freight Study Industry Trend Analysis A representative sample of major shippers within the Translinked region is shown in Table 4-9, based on the presence of large warehouse facilities in the area and major commodity groups. It should be noted Logistics providers listed above are also major shippers in their own right, in light of the large amount of freight that they control and manage on behalf of multiple shippers. Small to medium-sized shippers in particular favor the use of 3PLs to manage their supply chains. Table 4-9: Sample of Major Shippers in the Study Region 2010 Revenue Company Commodity Segment (Billions) Federal-Mogul Corporation $6.84 Transportation Equipment Ford Motor Company $134.12 Transportation Equipment General Motors LLC $149.17 Transportation Equipment The Chrysler Group LLC $41.90 Transportation Equipment TRW Automotive, Inc. $15.97 Transportation Equipment Alticore, Inc. (Amway) $92.00 Secondary Traffic CVS, Inc. $104.01 Secondary Traffic KMart Corporation $16.03 Secondary Traffic Steelcase $2.64 Secondary Traffic Target Corporation $69.24 Secondary Traffic Whirlpool $18.80 Secondary Traffic Domino's Inc $1.60 Food or Kindred Products Meijer Companies, Ltd $0.02 Food or Kindred Products Spartan Stores $2.58 Food or Kindred Products Dow Chemical Corporation $59.66 Chemicals or Allied Products Kelloggs $13.04 Farm Products Source: Hoovers and TranSystems 69 | TranSystems
  • 74.
    Translinked Freight Study Freight Forecast 5 DETROIT BEA FREIGHT FORECAST 5.1 Introduction Section 5 sets out a 10-year forecast of domestic and international, inbound and outbound, freight flows of warehouse-able commodities. The forecasts are used to identify growth sectors, and potential target sectors for development. The forecast methodology is described below followed by the forecast results and findings. 5.2 Methodology The approach to forecasting freight flows uses, for domestic flows, input-output data for the Detroit BEA and for combinations of U.S. regions external to the Detroit BEA. The international flows—overland from/to Mexico and Canada, and from/to overseas origins and destinations—are forecast based on commodity-specific econometric models, where freight flows are a function of macro-economic variables such as Disposable Income, Wealth, Exchange Rates and Industrial Production. Forecasts of industry-specific variables (growth of real output and employment) and macro-economic variables used in this analysis are provided by Moody’s Economic.com and The International Monetary Fund. Each of the forecasting techniques is described below. Input-Output Forecasting Inter-industry Input-Output tables are prepared periodically by the U.S. Department of Commerce. The tables specify, for each of 60 industries (mining, agriculture, manufacturing, services, transportation, education, health care, government) the estimated full input requirements for each unit of output of these 60 industries. The input requirements encompass primary, secondary, tertiary, etc. requirements for the output of various industries. For example, a unit of output from the Construction Industry may require direct input of a certain amount of output from the Building Materials industry, which may, in turn, require input from Mining, which may, in turn, require input from Construction and Building Materials, and so on. The input-output “coefficients” incorporate all of these effects. To forecast the inbound freight into the Detroit BEA, the growth rates for all goods-using industries are estimated (using industry data specific to Detroit from Economy.com), and the input-output table for Detroit is used to estimate the growth of goods-input requirements, which help estimate the forecast growth of inbound goods flow into Detroit. These industry-specific growth rates are then applied to the Base Year 2009 commodity- and origin-specific freight flows into the Detroit BEA (described in Section 2) to get annual forecasts of these Detroit inbound commodity-specific freight flows to 2020. To forecast outbound freight flows for the Detroit BEA, input- output tables and Economy.com industry-specific growth rates are applied to industry output for the East North Central Region (Indiana, Illinois, Wisconsin, Michigan, Ohio), which is the destination for most of Detroit’s outbound freight, and the remainder of the U.S. states. These forecasts of Detroit inbound and outbound domestic freight flows derived from input-output analysis are then adjusted as necessary to account for changes in the nature of the goods shipped (e.g., value per ton). Econometric Forecasting For foreign origins and destinations, where input-output data are not readily available, forecasts of inbound and outbound freight flows can be derived from econometric (statistical) models, relating time-series data on freight flows (quarterly or annual) to macro-economic variables related to Detroit, the U.S. or overseas countries. These econometric models are commodity-specific, and, like forecasts of domestic freight flows, forecast growth rates for each commodity by country origin or destination are applied to Base Year 2009 freight flows between Detroit and other countries (based on the data from IHS Global Insight) to forecast the commodity-specific freight flows. 70 | TranSystems
  • 75.
    Translinked Freight Study Freight Forecast 5.3 Economic Review and Outlook The Detroit BEA includes seven metropolitan statistical areas (MSA) that generate the vast majority of the region’s economic activity. They are Detroit-Warren-Livonia, Ann Arbor, Flint, Lansing-East Lansing, Saginaw-Saginaw Township North, Monroe, and Bay City. In turn, the Detroit-Warren-Livonia MSA is the largest economy in the region, accounting for 76 percent of the Gross Product generated by the seven MSAs. As shown in Table 5-1, the combined Gross Product of the seven MSAs expanded by 3.7 percent in 2010 after contracting in 2008 and 2009. In 2010, the combined MSAs expanded at a faster rate than the overall U.S. economy, which was partly driven by a recovery in manufacturing activity in the MSAs. Table 5-1: Real Gross Domestic Product by MSA within the Detroit BEA Real GDP (Billions of 2005 2010 Share of 2006 2007 2008 2009 2010 Dollars) Growth 2010 GDP Detroit-Warren-Livonia 194 195 186 174 179 2.8% 75.9% Ann Arbor 17 18 17 17 18 4.4% 7.4% Flint 17 17 17 16 17 2.6% 7.1% Lansing-East Lansing 12 12 11 10 11 1.7% 4.5% Saginaw-Saginaw Township North 7 6 6 6 6 3.8% 2.6% Monroe 4 4 3 3 3 3.1% 1.4% Bay City 3 3 3 3 3 2.0% 1.1% Total Above MSAs 254 255 243 229 236 2.9% 100.0% Michigan 368 368 352 335 345 2.9% - Toledo MSA 25 25 24 23 24 1.6% - Total USA 12,896 13,144 13,100 12,774 13,100 2.6% - Source: Bureau of Economic Analysis The “Gross Product” of the Detroit BEA16 is forecast to grow at an annual rate of 1.3 percent between 2010 and 2020, as shown in Table 5-2. This is significantly slower than the 2.4 percent growth rate forecast over the same period for the East North Central Region, which accounts for about 70 percent of the inbound and outbound flows of warehouse-able freight to/from the Detroit BEA. Projections for the components of Gross Product that pertain to goods movement and storage are also presented in Table 5-2. Among these components, the largest as a percentage of Gross Product are Machinery & Parts manufacturing at 5.7 percent and Transportation Equipment & Parts manufacturing, 5.4 percent. The fastest growth is expected from Electronics manufacturing with a forecast CAGR of 5.0 percent between 2010 and 2020, and Machinery & Parts with a CAGR of 4.4 percent. Food & Related Products manufacturing accounted for an estimated 2.4 percent of the Detroit BEA’s Gross Product in 2010, but is forecast to grow at only a 0.3 percent annual rate from 2010 to 2020. The data in Table 5-2 also indicate that the Detroit BEA’s industries related to goods movement— manufacturing, transportation and warehousing—are forecast to grow faster than overall Gross Product. The weighted-average annual growth rate for these industries in the Detroit BEA is 3.1 percent. However, 16 Projections for the Detroit BEA are based on a review of economic data from the Bureau of Economic Analysis for the MSAs within the Detroit BEA and forecast data from Moody’s Economy.com. 71 | TranSystems
  • 76.
    Translinked Freight Study Freight Forecast for Transportation & Warehousing, projected annual growth in the Detroit BEA, at 2.5 percent, is significantly less than the corresponding growth in the East North Central Region, at 3.7 percent. Table 5-2: Economic and Industry Factors Related to Goods Movement in the East North Central Region and the Detroit BEA: Ten-Year Annual Growth Rates, 2010-2020 Percent of Forecast Detroit BEA Economic Variable Growth Rate Gross Product in (%), 2010-2020 2010 East North Central Region Gross Product - 2.4 East North Central Transportation and Warehousing - 1.3 Detroit BEA Gross Product - 3.7 Detroit BEA Machinery & Parts Manufacturing 5.7 4.4 Detroit BEA Transport Equipment & Parts Manufacturing 5.4 3.0 Detroit BEA Electronics Manufacturing 2.8 5.0 Detroit BEA Food & Related Products Manufacturing 2.4 0.3 Detroit BEA Textile & Related Products Manufacturing 2.2 2.4 Detroit BEA Transportation and Warehousing 2.0 2.5 Detroit BEA Miscellaneous Products Manufacturing 1.8 1.6 Detroit BEA Chemical and Plastics Products Manufacturing 0.4 4.2 U.S. Gross Product - 2.7 U.S. Transportation and Warehousing - 4.7 Source: Based on MSA data from Bureau of Economic Analysis and Economy.com 72 | TranSystems
  • 77.
    Translinked Freight Study Freight Forecast 5.4 Freight Flow Forecast The results of the forecast of inbound and outbound freight flows of warehouse-able commodities are summarized in Table 5-3. Total freight is projected to have increased from 89.9 million tons in 2009 to 97.8 million tons in 2010, driven by recovery from the recession and growth of industries in the Detroit region. Total inbound and outbound freight is projected Figure 5-1: Forecast of Detroit BEA to increase to 112.4 million tons in 2015 and 126.0 Inbound and Outbound Freight Flows – million tons in 2020 (Figure 5-1), based on domestic Warehouse-able Commodities economic growth and the expansion of cross-border trade with Mexico and Canada, and growth of trade with overseas markets. The projected 10-year (2010 to 2020) compound annual growth rate (CAGR) is 2.6 percent. Domestic inbound and outbound trade is projected to grow at a 10-year CAGR of 2.4 percent, this relatively slow growth a reflection of the projected growth pattern of the Detroit BEA and U.S. economies, and the relative maturity of some of the larger commodities (e.g. Food Products) that comprise domestic freight flows. Domestic outbound freight is projected to grow at a faster rate than domestic inbound (10-year CAGR of 2.5 percent versus 2.3 percent) due to stronger economic growth in other regions of the U.S., which generates demand for commodities shipped from the Source: TranSystems Forecast for 2010, 2015 and 2020, and Detroit BEA, notably in the manufacturing sector. IHS Global Insight Transearch data for 2009 Cross-border inbound and outbound freight flows with Canada are projected to grow at a marginally faster rate (10-year CAGR of 2.7 percent) than domestic flows. However, the growth of trade with Canada is lower than that projected for cross-border trade with Mexico (10-year CAGR of 5.1 percent). This reflects the relative maturity of economic integration between Canada and the Detroit region, slower projected economic growth in Canada than in Mexico, and the presence of some relatively mature commodities (e.g. Food Products and Forest Products) in Canada trade. Cross-border inbound and outbound trade with Mexico is projected to be the fastest growing component of freight; with a 10-year CAGR of 5.1 percent, 5.4 percent for inbound from Mexico and 4.6 percent for outbound to Mexico. The stronger performance of Mexico trade relative to the other freight sectors is driven by the composition of Mexican trade and several trends that are expected to influence trade with Mexico in the future. Regional trade with Mexico is centered on higher-value and faster-growth commodity sectors – inbound and outbound shipments of Transportation Equipment and outbound shipments of Chemicals or Allied Products, which includes plastics and synthetic fibers. Economic integration between the U.S. and Mexico continues, including the expansion of manufacturing in Mexico for the U.S. market. Relatively stronger economic growth in Mexico will also support demand for U.S. exports. Overseas Import and Export freight, which is clearly identifiable international cargo moving between the Detroit BEA and U.S. port gateways (e.g. Port of New York/New Jersey), is projected to register a 10-year CAGR of 4.3 percent, with Exports (4.4 percent) growing at a slightly faster rate than Imports (4.2 percent). 73 | TranSystems
  • 78.
    Translinked Freight Study Freight Forecast The slightly stronger performance by Exports reflects the projected favorable market environment for U.S. exporters, international economic growth and a favorable U.S. dollar exchange rate. It is important to note that the identified Import and Export flows understate the actual volume of overseas freight flows due to the conversion of international cargo to a domestic cargo move. For example, a large amount of containerized imports arriving at Los Angeles/Long Beach is transloaded from 40-foot marine containers to 53-foot domestic containers, and then shipped inland. This is captured in freight flow databases as domestic freight. Table 5-3: Forecast of Inbound and Outbound Freight Flows Inbound Freight (Warehouse-able Commodities) CACR 2010 Trade 2009 Tons 2010 Tons 2015 Tons 2020 Tons to 2020 Domestic 44,334,660 47,678,414 54,438,636 59,970,374 2.3% Canada 3,835,424 4,232,502 4,778,201 5,513,774 2.7% Mexico 1,613,233 1,761,005 2,278,608 2,981,832 5.4% Import 1,205,197 1,343,248 1,638,317 2,028,841 4.2% Grand Total 50,988,514 55,015,169 63,133,762 70,494,821 2.5% Outbound Freight (Warehouse-able Commodities) CACR 2010 Trade 2009 Tons 2010 Tons 2015 Tons 2020 Tons to 2020 Domestic 34,989,373 38,422,157 43,783,939 49,083,371 2.5% Canada 1,512,627 1,665,247 1,962,443 2,218,630 2.9% Mexico 812,665 927,945 1,209,384 1,451,046 4.6% Export 1,581,080 1,796,395 2,316,588 2,756,368 4.4% Grand Total 38,895,745 42,811,744 49,272,353 55,509,415 2.6% Inbound & Outbound Freight (Warehouse-able Commodities) CACR 2010 Trade 2009 Tons 2010 Tons 2015 Tons 2020 Tons to 2020 Domestic 79,324,033 86,100,571 98,222,574 109,053,745 2.4% Canada 5,348,051 5,897,749 6,740,644 7,732,404 2.7% Mexico 2,425,898 2,688,950 3,487,992 4,432,877 5.1% Import & Export 2,786,277 3,139,643 3,954,905 4,785,209 4.3% Grand Total 89,884,258 97,826,912 112,406,115 126,004,235 2.6% Source: TranSystems Forecasts for 2010, 2015 and 2020, and IHS Global Insight 2009 data. The Baseline projections indicate that truck shipments will grow at a slightly faster rate than shipments by rail. This result is driven by several factors – (1) the macro nature of the forecast models, with their underlying assumptions on industry input and output relationships, and fixed modal shares for individual commodities, (2) the large amount of freight moving between Detroit and truck friendly origins and destinations in the East North Central region, and (3) the current transportation mode distribution. However, the macro forecast models do not take into account significant transportation industry factors that are expected to accelerate the growth of rail usage. As discussed in Section 3.8, the trucking industry is faced with several challenges that are encouraging shippers to expand the use of rail in their supply chains. These factors include fuel price increases, favoring rail over highway transport, the cost of recruiting and 74 | TranSystems
  • 79.
    Translinked Freight Study Freight Forecast maintaining truck drivers, investments by railroads in intermodal rail hubs tied to logistics parks, and increased marketing and attractive pricing by railroads of shorter haul intermodal rail services. For these reasons, it is likely that rail freight will grow at a faster rate than projected under the macro forecast growth rates summarized in Table 5-4. Table 5-4: Macro Forecast Growth Rates by Transport Mode Inbound & Outbound Freight (Warehouse-able Commodities) Rail Truck Rail Truck Trade Share Share 10-Year 10-Year Comment 2010 2010 CAGR CAGR Domestic 8.8% 91.0% 2.2% 2.4% Rail freight is likely to grow faster than projected here due to truck and rail industry Canada 34.3% 65.0% 2.8% 2.7% trends – driver recruitment, fuel costs, etc., Mexico 60.1% 39.8% 5.0% 5.3% shipper interest in using more rail, investments by railroads in intermodal hubs, and railroad Import & Export 16.0% 84.0% 4.2% 4.3% expansion into shorter distance corridors. Source: TranSystems Forecasts for 2010, 2015 and 2020 The Base projections of cargo flows shown in Table 5-3 are driven by assumptions related to regional, national and international economic activity, and relationships between industry inputs and outputs. Low and high case projections are presented in Table 5-5. The basis for these alternative projections is that the principal driver of freight flows is economic activity, represented by indicators such as disposable income and industrial production. In addition, housing-sensitive commodities are subject to more uncertainties going forward due to uncertainty as to the timing of recovery in regional housing markets. In general, the sensitivities for non-housing related commodities (e.g. transportation equipment) are -0.5to +0.5 percent per year. Secondary traffic is assumed to be 25 percent housing-related and the sensitivities are -0.2 to +1.5 percent per year. The growth sensitivities for international flows are -1.5 to +1.5 percent per year. A stronger recovery in regional, national and international economic activity would be expected to drive a healthy growth of international trade. As shown in Table 5-5, total inbound and outbound shipments of warehouse-able commodities are projected to have a 10-year compound annual growth rate of 2.6 percent under the Base Case, 1.9 percent under the Low Case, and 3.2 percent under the High Case. 75 | TranSystems
  • 80.
    Translinked Freight Study Freight Forecast Table 5-5: Inbound and Outbound Freight Forecast for 2020 – Base, Low and High Inbound Freight (Warehouse-able Commodities) 2020 Tons CAGR 2010 to 2020 Trade 2009 Tons 2010 Tons Base Low High Base Low High Domestic 44,334,660 47,678,414 59,970,374 57,318,605 63,775,639 2.3% 1.9% 3.0% Canada 3,835,424 4,232,502 5,513,774 5,127,613 5,798,233 2.7% 1.9% 3.2% Mexico 1,613,233 1,761,005 2,981,832 2,708,501 3,145,764 5.4% 4.4% 6.0% Import 1,205,197 1,343,248 2,028,841 1,859,298 2,273,105 4.2% 3.3% 5.4% Grand Total 50,988,514 55,015,169 70,494,821 67,014,016 74,992,742 2.5% 2.0% 3.1% Outbound Freight (Warehouse-able Commodities) 2020 Tons CAGR 2010 to 2020 Trade 2009 Tons 2010 Tons Base Low High Base Low High Domestic 34,989,373 38,422,157 49,083,371 44,989,601 51,752,543 2.5% 1.6% 3.0% Canada 1,512,627 1,665,247 2,218,630 2,059,365 2,308,990 2.9% 2.1% 3.3% Mexico 812,665 927,945 1,451,046 1,369,738 1,658,503 4.6% 4.0% 6.0% Export 1,581,080 1,796,395 2,756,368 2,495,304 3,036,918 4.4% 3.3% 5.4% Grand Total 38,895,745 42,811,744 55,509,415 50,914,008 58,756,955 2.6% 1.7% 3.2% Inbound & Outbound Freight (Warehouse-able Commodities) 2020 Tons CAGR 2010 to 2020 Trade 2009 Tons 2010 Tons Base Low High Base Low High Domestic 79,324,033 86,100,571 109,053,745 102,308,206 115,528,183 2.4% 1.7% 3.0% Canada 5,348,051 5,897,749 7,732,404 7,186,977 8,107,223 2.7% 2.0% 3.2% Mexico 2,425,898 2,688,950 4,432,877 4,078,239 4,804,267 5.1% 4.3% 6.0% Import & Export 2,786,277 3,139,643 4,785,209 4,354,602 5,310,023 4.3% 3.3% 5.4% Grand Total 89,884,258 97,826,912 126,004,235 117,928,024 133,749,697 2.6% 1.9% 3.2% Source: TranSystems Forecasts and IHS Global Insight 2009 data. 76 | TranSystems
  • 81.
    Translinked Freight Study Comparative Location Analysis 6 COMPARATIVE LOCATION ANALYSIS 6.1 Introduction With the exception of air cargo, “last mile” delivery trucking costs make up the highest portion of transportation expense in a typical supply chain. As such, the location of a regional hub is heavily influenced by the trucking cost to distribute goods “the last mile”, to local area DCs, retail stores, or to local manufacturers. Locating DCs in high concentration customer/supplier areas reduces trucking expenses enough to more than compensate for lower ocean and rail costs to competing regions. The Translinked region must overcome two regional hubs that are well established and in a strong position to compete for DC operations in the Midwest; Columbus, OH, and Chicago, IL. Columbus has the highest U.S. and Canadian population reach of Detroit (representing the Translinked region) or Chicago, and Chicago has superior rail and air cargo services, as well as a large Midwest distribution reach. Both of these areas have competitive labor and industrial real-estate costs as well. Translinked region opportunities lay with companies with specific distribution needs, such as a high concentration of customers in Northern Michigan, over to Toronto, and including parts of the U.S. Midwest. Companies that require fastest ocean transits from China or Europe, or manufacturers that receive materials used in production from nearby sources are other potential candidates. TranSystems recommends a detailed, company by company analysis to identify opportunities based on the Translinked region’s specific advantages. Translinked area opportunities will be aided by addressing perceptions about the unpredictability of U.S.- Canada border crossings, or presenting the region in a “can do”, business friendly light. A short window of opportunity may be open due to concerns over truck driver and rail crew shortages, and volatile fuel prices. Logistics managers are currently open to considering location solutions that drive costs out of their networks, or that build flexibility into their supply-chains. Improved rail facilities that incorporate features of successful rail projects, such as on-site DC facilities, will also elevate the Translinked area as a competitive distribution hub. Importantly, private sector investment is critical to the success of logistics transportation infrastructure projects; therefore, we strongly urge more private industry involvement and representation in the Translinked initiative. Time is of the essence. It should be noted that recent improvements in Ohio, such as CSX’s Northwest Ohio Intermodal Terminal at North Baltimore, Norfolk Sothern’s Heartland Corridor serving Columbus, and BNSF’s Chicago rail terminal at Elwood combined with the CenterPoint Intermodal Center have been noticed in the industry. Other recent success within the Translinked region itself, such as port improvements in Toledo, have been attributed to public/private cooperation, and agreed upon priorities. Barriers impeding Translinked progress should be identified, and addressed. Slow moving initiatives will lose out to locations that are established, and proven. Creating a Translinked Marketing Organization, similar in concept to the successful KC (Kansas City) Smartport initiative, dedicated to identifying companies that would likely benefit from locating in the study area, is recommended as the first step that will identify realistic transportation opportunities. 6.2 Regional Truck/Rail Logistics Comparison Logistics managers evaluate the use of truck and rail within the context of cost savings on an ongoing basis. Improved reliability and transit speeds of railroads, and uncertainty caused by volatile fuel prices, or expected driver shortages have caused supply chain managers to consider the rail option whenever possible; however, the flexibility and transit speed capabilities of the trucking mode is often the only option, especially 77 | TranSystems
  • 82.
    Translinked Freight Study Comparative Location Analysis for time sensitive shipments. The choice of truck versus rail is decided based on delivery time and cost considerations. 6.2.1 Transit Time Hurdle When considering a move to rail from truck, the first hurdle that must be cleared is the transit time requirement. Just-In-Time (JIT) cargo needed for manufacturing purposes, for example, often has a very short lead time, and requires a high degree of on-time reliability. A late shipment can cause missed production schedules, thereby quickly erasing savings gained by using lower cost transportation options. Retail sales items that have to arrive in stores on-time, or perishable items are examples of goods that require fast, reliable transit. This cargo is more suitable for truck transportation, given that trucks tend to have faster transits than rail, and provide more scheduling flexibility. Shippers also consider trucks to have greater resiliency to service failures, due to easier access to trucks on highways, as compared to railcars on a rail network. This access enables shippers to change plans “mid-stream”. The lower cost rail option is preferred over trucking, if transit time requirements are acceptable, and rail service is available. 6.2.2 Total Landed Cost Comparison The motivation to use rail is to save money. Once transit time considerations are met, logistics mangers calculate the Total Landed Cost, which is the total of product, transportation, storage, inventory carrying costs, customs duties, transloading and any other costs that are incurred as a result of moving a product from point A to point B. This analysis allows shippers to evaluate modes on an “all inclusive” basis. Transportation costs examples include rail, trucking, barging, ocean or air. A particularly important component of Total Landed Cost is Inventory Carrying Cost, because transit time has a direct impact on Inventory Carrying Cost elements, as explained below: • Cost of Money – the longer products stay in inventory, the longer money is tied up, incurring interest expense, and opportunity costs. Cargo in-transit is considered as inventory. • Obsolescence – sales items, or items with a short shelf life, such as high fashion items carry a high inventory carrying cost, as the products become severely devalued after a short period of time. • Safety Stock – the additional amount of inventory that must be kept on-hand to prevent stock-outs. Longer lead and transit time increases safety stock requirements, Cost of Money, Obsolescence… Trucking may be more expensive than rail, but trucking’s faster transit may result in lower inventory carrying costs, and no transloading17 costs. Rail may be less expensive than trucking, but rail may incur additional inventory carrying costs, and may also result in truck transload costs. The transportation mode that results in the lowest Total Landed Cost is preferred. One outcome of this approach is that high-value18 goods are often moved by truck, because additional inventory carrying costs caused by longer transits of even a few days, or the threat of lost sales due to late train arrivals, overshadow cost savings gained by using rail. Strategies to carry low inventory in retail outlets and distribution centers factor into the landed cost calculation, and this strategy also favors faster transit trucking in order to reduce the risk of stock-outs, and missed sales opportunities. Even for time sensitive and high-value cargo; however, rail is evaluated. Improved rail reliability and transit capabilities are causing logistics managers to re-consider the rail option. 17 Transloading occurs during an intermodal move, such as from a rail boxcar to a truck. 18 High-value cargo is generally processed or semi-processed goods, and often retail items. 78 | TranSystems
  • 83.
    Translinked Freight Study Comparative Location Analysis 6.2.3 Rail Transits Railroad transit times, measured in hours, from major port gateways are shown in Table 6-1. They are based on information from railroad websites; however, TranSystems’ experience is that actual rail transits can vary widely from published schedules based on port and rail corridor congestion, container dwell times at terminals, priority given to various shippers and other factors. The Port of Halifax, for example estimates that actual rail transits to Detroit from Halifax, Montreal, and New York are closer to 125, 103, and 168 hours respectively, if container “dwell time” is included in the transit. Railroad websites suggest a much shorter transit, at 89, 40, and 68 hours from Halifax, Montreal, and New York respectively. The most important characteristic of the Table 6-1: Estimated Rail Transits in Hours from Key inland rail move is reliability. Lead times for Port Gateways to Selected Midwest Points rail shipments have already been built into delivery requirements, so logistics managers Origin Port Gateway Detroit Chicago Columbus in many cases can tolerate a day or two Halifax 89 73 97 a extra rail transit if arrival times can be relied Montreal 48 b 96 64 c upon. A separate market survey of transportation practices undertaken by New York/New Jersey 68 51 65 TranSystems, included an interview with a Norfolk 63 47 39 U.S. retailer who used the fastest rail transit Savannah 81 d 65 57 d lane available. When the rail operator raised Prince Rupert 127 97 124 e rates in that corridor, the retailer switched to a lower cost rail route because a transit Seattle/Tacoma 162 132 162 saving of two or three days did not justify Los Angeles/Long Beach 145 78 113 the higher rate, as long as the shipments a) Estimated based on Columbus versus Detroit transit difference arrived on-time. It is important to note that from NY/NJ for some shippers of high-value or time- b) Montreal to Toronto + 24 hours sensitive cargo, a two or three day shorter c) 24 hours from Detroit transit IS valued, and they would likely d) Based on Norfolk Chicago to Columbus and Detroit spreads e) 24 hours from Chicago consider premium rates for faster, reliable service. Note: Rail transit times are based on published schedules and do not take account of other factors including congestion, container dwell time, priority shipments, etc. In practice, transit times may be longer Other influences on the use of a rail than indicated in the Table. corridor are the ocean carrier used to Source: TranSystems, Railroad Websites import goods, or the type of North America distribution strategy. For example, Prince Rupert advertises the fastest ocean/rail transit from Shanghai to Detroit; however, if a shipper does not contract with one of the two ocean carriers that have vessels calling Prince Rupert, or on carriers that have space sharing agreements with those carriers, fast transit to Prince Rupert is not an option. An inland U.S. transportation strategy might employ a coastal facility that combines shipments from several origins, and redistributes cargo to North American destinations. The location of the coastal facility drives the rail corridor used, which may or may not result in the lowest rail transit in a particular corridor. The overall controlling considerations are service reliability, required transit time, and lowest total landed costs, including ocean, costal distribution, rail, and truck costs. 6.2.4 Transportation Cost Indication by Gateway When a shipper is considering gateway costs, ocean and rail costs are combined to arrive at the total cost per gateway. Transit time, cargo volume, cargo types, and number of services offered in a given gateway all affect total gateway costs. Table 6-2 provides a comparison by port gateway serving the U.S. Upper Midwest 79 | TranSystems
  • 84.
    Translinked Freight Study Comparative Location Analysis region, categorized by Market or Blow Market cost (ocean plus inland) for imports from Asia or Europe. In general, the shortest transits have the highest rates (e.g. Shanghai to Los Angeles/Long Beach), while longer transit routes have the lower rates (e.g. Shanghai to Ney York via the Panama Canal). A notable exception to this rule is Shanghai to Prince Rupert, where ocean carriers have increased capacity, and have competitively priced the service to attract new business. As a result of severe railroad delays starting in the late 1990’s, and a dock worker labor lockout on the US West Coast in 2002, logistics managers began to diversify the number of gateways used to avoid reliance on a single port. All-Water Service (AWS) from Asia that bypassed the West Coast via the Panama Canal to access Eastern and Midwestern markets became more popular. Prior to this trend, AWS pricing was discounted due to the longer transit time required to sail vessels through the Panama Canal; however, the price gap between West Coast Gateways and AWS East Coast Gateways narrowed, as this route Table 6-2: Translinked Study Area Cost* Evaluation by North became more popular. American Port Gateway Port Gateway Cargo Origin Asia Cargo Origin Europe The difference between the highest and lowest rate for the same origin Halifax/Montreal Below Market Market and destination, but using different Prince Rupert Below Market No Service gateways might be comparable, U.S. Northeast Ports Below Market Market when the total of ocean and U.S. Southeast Ports Below Market Market rail/trucking costs are considered. U.S. Pacific Northwest Market Below Market The cost evaluations appearing in Table 6-2 are intended to provide a California Ports Market Below Market general illustration of port gateway * Cost refers to ocean plus inland costs. Each port gateway is categorized as At costs. Actual rates are negotiated Market or Below Market with ocean carriers and railroad Note: Based on interviews. operators on a case-by-case basis, Source: TranSystems and will vary by shipper. 6.2.5 Trucking Transits and Market Coverage As mentioned earlier, trucking costs make up the highest portion of transportation expenses; therefore, supply chain managers develop strategies that balance truck transit time requirements and trucking costs. Moving distribution centers as close as possible to end customers is a frequent goal. One method supply chain analysts use to determine the suitability of a proposed logistics hub is to calculate the U.S. Population that can be reached within a 10-hour truck drive-time extending outward from a proposed location. Ten hours is generally used as the trucking drive-time threshold due to US Federal Motor Carrier Safety Administration (FMCSA) safety regulations that limit the amount of time that drivers are allowed to spend behind the wheel. “Team driver” arrangements are allowable to extend driver hours, but typical distribution models use single drivers. Figure 6-1 illustrates the 10-hour truck drive-time areas covered by distribution hubs in Detroit (representing the Translinked region), Columbus, Chicago, and Harrisburg, PA. Harrisburg was included to illustrate the market role of more easterly distribution hubs. Table 6-3 displays the U.S. and Canadian populations falling within the 10-hour truck distribution areas of each city. The 10-hour truck drive-time areas were calculated by assuming free-flow traffic conditions and so do not take into consideration traffic congestion on particular routes, which can have a negative impact on truck service areas. 80 | TranSystems
  • 85.
    Translinked Freight Study Comparative Location Analysis Detroit, while covering the second smallest population range (88.2 million Table 6-3: U.S. and Canada Population within 10-Hour people), reaches further north into Truck Drive-Time of Detroit and Selected Cities Ontario and Quebec than do other cities Population included in Figure 6-1. The advantages of U.S. Canada Total Millions Columbus is that it include the highest Detroit 74.9 13.4 88.2 population coverage of the four cities listed, encompassing 118.4 million people. Columbus 109.6 8.7 118.4 The coverage offered by Columbus Harrisburg 102.6 14.7 117.3 reaches from Midwest markets to the Chicago 75.7 8.2 83.9 Central Atlantic States of Pennsylvania, New Jersey, Delaware, Maryland, Virginia, Source: TranSystems derived from Census data and extends south to points in Northern Alabama, Georgia and South Carolina. Harrisburg provides coverage of 117.3 million people and it has distribution advantages in Eastern Quebec, New Brunswick, the U.S. Northeast US and the U.S. Eastern Seaboard States of Virginia North Carolina. Western markets from South-central Minnesota, down to Eastern Nebraska, and across to the Northeast corner of Arkansas are best serviced from a DC in Chicago, as compared to the other selected cities. A total of 83.9 million people can be reached within a 10-hour truck drive of Chicago. Of the cities studied, Harrisburg (14.7 million) and Detroit (13.4 million) have the highest Canadian population reach. Harrisburg would be favored for target customers heavily concentrated in the East, Chicago for Midwestern markets, Detroit for Midwestern plus Canadian markets, and Columbus for population in both Midwest and Eastern markets. The challenge for the Translinked region, as a distribution hub, is its proximity to some of these more favorably located cities – for example, a company with a DC in Columbus can access the largest population of the four locations considered here and provide coverage of the Translinked regional market. 81 | TranSystems
  • 86.
    Translinked Freight Study Comparative Location Analysis Figure 6-1: 10-Hour Truck Drive-Time Area Comparison: Detroit, MI, Chicago, IL, Columbus, OH, and Harrisburg, PA Source: TranSystems 82 | TranSystems
  • 87.
    Translinked Freight Study Comparative Location Analysis Table 6-4 provides estimated truck transit times from selected cities to major Table 6-4: Truck Transit Time from Detroit and population centers. Transit times shown in Selected U.S. Distribution Hubs to Major Cities red denote corridors that are beyond the Origin (Truck Transit Hours, > 10 Hours) 10-hour delivery radius of most DCs. For Destination Detroit Columbus Chicago Harrisburg example, none of the DCs would likely Chicago 5.4 6.7 - 12.2 service Dallas. Chicago is within range of Cincinnati 5 2.1 5.6 8.8 most of the largest Midwest Cities, and Cleveland 3.2 2.7 6.2 6.4 Harrisburg is the only DC within 10-hour Columbus 3.9 - 6.7 7 range of New York City. Dallas 22.4 19.1 17.8 25.4 Detroit - 3.9 5.4 9.2 To illustrate how truck volume to Indianapolis 5.9 3.5 3.5 10.3 destination cities affects overall trucking Kansas City 14.5 12.1 9.9 19 costs, Table 6-5 displays the populations by Milwaukee 7.4 8.6 2.1 14 U.S. Census Bureau Metropolitan Statistical Minneapolis 12.9 14.1 7.7 19.7 Area (MSA) for the largest Midwest Nashville 10.2 7.1 8.8 13.3 Markets, and the population of Toronto, New York 11.8 10.3 14.8 3.6 ON and truckload rates to each of these Pittsburgh 5.7 3.7 8.7 4.1 cities from Detroit, Chicago, Columbus and Saint Louis 10.3 8.1 5.8 14.9 Harrisburg. Table 6-5 should be viewed as Toronto 4.6* 8.2* 9.7* 7.3* a basic example of a regional DC analysis of * Subject to customs inspections, may extend transit beyond 10 hours trucking costs, where large regional DCs Source: TranSystems and Truckloadrates.com covering several states feed smaller DCs that service a metropolitan area. If truckload volumes to each destination are proportional to destination city populations, Detroit and Chicago have the lowest average total trucking costs. Chicago is aided by having local trucking rates to the third largest MSA in the cities listed, while other markets would have to pay long distance trucking rates to serve those same Chicago area customers. A regional DC located in Detroit benefits from local truck rates to 4.3 million people in Detroit, as well as the lowest long distance trucking cost to the large population center of Toronto. If Toronto is removed from the analysis, Chicago becomes the lowest cost hub, while Detroit falls to the third place position behind Columbus. It should be noted that, per Table 6-4, Detroit cannot serve Kansas City, Minneapolis, Nashville or St. Louis within a 10-hour truck drive, which may not meet service level requirements of some shippers. Service to Toronto may be affected by inspection and other delays at the border, which could disqualify Toronto from a Detroit DC service area. Interviews with logistics managers suggest that the existence of a border crossing within the distribution area of a warehouse is workable, but not desirable. This emphasizes the importance of addressing concerns regarding border delays, because access to the Toronto market is important if the Translinked region is to be viewed as a leading Midwest distribution location. A common observation of prospective regional hubs is that cargo often passes through their regions, only to be transported back into the area later. Network optimization may cause truckloads to actually pass through their eventual destination. Chicago’s lower DC distribution costs may cause containers to pass through Detroit to Chicago, where cargo might be comingled with other freight, and trucked back to Detroit. In this case, total U.S. network distribution cost savings outweigh rail cost or transit time savings to Detroit, even if containers pass through the Translinked region initially. 83 | TranSystems
  • 88.
    Translinked Freight Study Comparative Location Analysis Table 6-5: Estimated Truckload Costs from Detroit and Selected U.S. Distribution Hubs to Major Cities 2010 Origin (Estimated $ per Truckload) MSA Lowest Cost, 2nd Lowest Cost Destination MSA Rank Population Detroit Columbus Chicago Harrisburg Chicago 9,461,105 3 $555 $474 $150 $645 Cincinnati 2,130,151 27 $462 $534 $584 $549 Cleveland 2,077,240 28 $456 $443 $670 $448 Columbus 1,836,536 32 $456 $150 $678 $446 Detroit 4,296,250 12 $150 $553 $606 $563 Indianapolis 1,756,241 34 $583 $555 $457 $560 Kansas City 2,035,334 29 $1,167 $1,007 $867 $989 Milwaukee 1,555,908 39 $618 $608 $541 $828 Minneapolis 3,279,833 16 $1,053 $1,085 $664 $1,094 Nashville 1,589,934 38 $842 $562 $761 $642 Pittsburgh 2,356,285 22 $680 $489 $1,005 $455 Saint Louis 2,812,896 18 $823 $577 $577 $783 Toronto 5,471,400 - $577 $1,066 $1,150 $956 Weighted Average $612 $645 $615 $709 Source: TranSystems, TruckloadRates.com and Census Data 84 | TranSystems
  • 89.
    Translinked Freight Study Comparative Location Analysis 6.3 Location Profiles – Columbus and Chicago 6.3.1 Columbus, OH A DC located in Columbus is considered to have the largest population reach of any U.S. location, due to its proximity to the largest U.S. population centers in the Midwest and Eastern states. Over 118 million people live within a ten-hour drive of Columbus. Columbus has also benefitted from recent developments, such as the Rickenbacker Logistics Park, Norfolk Sothern’s Heartland Corridor, with improved transit times from Norfolk to Columbus, and intermodal terminal improvements as part of CSX’s National Gateway Initiative. Table 6-6 summarizes several key logistical characteristics offered by Columbus. Table 6-6: Columbus Regional Logistics Summary Columbus, OH Railroads and Service Area CSX – U.S. East, Midwest, main Western States Access NS – East, Midwest access Western States and Canadian cargo connects to railroads serving those areas, i.e. UP, BNSF, CP, and CN. Highway Description I-70 and I 80 to the north provide east/west access, I 71 and I 75 to the west provide north/south access Distribution Facilities U.S. and Canada Population Reach 118.4 million within 10-hour truck driving radius Total Warehouse Space (sq. ft.) 205.9 – 213.8 million Vacancy Rate 11.5% – 3.7% Average Lease Rate ($/sq. ft./yr)* $2.70 – $3.32 Transportation and Materials Moving $14.85 Occupation Wage (Hourly) Fastest Ocean Gateways Norfolk, New York Airport US Rank**** 54th Total Cargo (metric tons) **** 69,748 Distribution Area Target US Midwest, Northeast, Mid Atlantic * Asking lease rate for Warehouse and Distribution Use Facilities > 10,000 sq. ft Source: TranSystems, CB Richard Ellis, Grubb and Ellis, Colliers, US Bureau of Labor Statistics, Airport Council International – North America, and Railroad websites The Rickenbacker Inland Port is the best example of a multimodal/intermodal logistics park in the area. Key features of the facility are on-site access to the NS intermodal rail terminal, the Rickenbacker International Airport, and I-270. On-site rail access accommodates logistics strategies to reduce trucking costs, as cargo can be delivered to DCs that are directly adjacent to rail and air facilities. Because of the multimodal advantages, several Third Part Logistics Providers (3PLs), such as Exel, Kuehne & Nagel, Nippon Express, Expeditors International have locations at Rickenbacker. Regular cargo airline service is offered by UPS and FedEx, with less frequently scheduled cargo services offered by international carriers, such as Evergreen Air and Kalita Air. Attracting dedicated international cargo airlines other than UPS or FedEx is significant because the current trend of these carriers is to limit service to very large air hubs, such as Miami, FL, Chicago, IL, or Los Angeles, CA. The lack of daily service from multiple international cargo airlines into 85 | TranSystems
  • 90.
    Translinked Freight Study Comparative Location Analysis either Columbus or Rickenbacker international Airports indicates that the Columbus area is not considered to be a major air cargo gateway into the Midwest; however, air cargo services are an advantage of the Rickenbacker facility. Justification for air cargo services that do call Rickenbacker is based on the needs of tenants, and the large population coverage offered by the location. TranSystems interviews suggest that the Rickenbacker air facility does not break-even financially; however, air cargo services support logistics needs of the airfield tenants, such as The Limited Companies and others, and jobs created by the facility are viewed to compensate for losses. 6.3.2 Chicago, IL Chicago has the third largest U.S. metropolitan population with over 9 million people, and is served by six of the seven Class 1 Railroads that operate in North America. In addition to the local population, over 75 million people can be reached within a 10-hour truck drive from Chicago. Chicago is also North America’s fifth largest cargo airport, with regularly scheduled service from over twenty cargo airlines from around the world, in addition to passenger airlines, such as Air China, Air France, Singapore Airlines and others that transport air cargo on passenger jets. The combination of population mass, ample rail intermodal service, and nearby access to one of the key Midwest air cargo hubs provide compelling reasons to locate Midwest regional DCs in the Chicago area. Rail congestion is noted as an impetus to establish rail facilities elsewhere that allow trans-continental rail service to bypass Chicago. CSX’s North Baltimore project is an example of such a rail facility. Table 6-7 summarizes several key logistical characteristics offered by Columbus. Table 6-7: Chicago Regional Logistics Summary Chicago, IL Railroads and Service Area CSX US East, Midwest, main Western States Access NS East, Midwest access UP and BNSF, States west of the Mississippi CN, Canada Rail Markets, US Central Plain States, Gulf P, Canada Rail Markets, US Northeast, US Midwest I-94 and I 57 provide north/south access, I 80 Highway Description east/west, and I 90 northwest access Distribution Facilities U.S. and Canada Population Reach 83.9 Million within 10-hour truck driving radius Total Warehouse Space (sq. ft.) 1.0 – 1.3 Billion Vacancy Rate 9.3% – 11.3% Average Lease Rate ($/sq. ft./yr)* $3.90 – $4.39 Transportation and Materials Moving $16.46 Occupation Wage (Hourly) Fastest Ocean Gateways West Coast (Asia origin cargoes) Airport U.S. Rank 5th Total Cargo (metric tons) 1,376,552 Distribution Area Target US Midwest * Asking lease rate for Warehouse and Distribution Use Facilities > 10,000 sq. ft Source: TranSystems, CB Richard Ellis, Grubb and Ellis, Colliers, US Bureau of Labor Statistics, Airport Council International – North America, and Railroad websites 86 | TranSystems
  • 91.
    Translinked Freight Study Comparative Location Analysis An example of a logistics industrial park in the Chicago Area that combines key elements of a successful supply chain cost reduction strategy is CenterPoint’s 2,500-acre industrial complex located in Joliet. The main attraction to this facility is on-site service provided by the BNSF railway, which reduces trucking costs to DCs located at CenterPoint to an estimated $92 per container. CenterPoint considers this to be such a strong selling point that they included a “Drayage Calculator” on their website that estimates cost savings of locating at CenterPoint versus five other site locations in the Chicago area. Companies like WalMart agree with the cost saving potential of the development, and have located at CenterPoint. Separate TranSystems interviews of logistics managers in the Chicago area revealed that the single downside of the development is that BNSF is the only railroad to serve the site. If freight arrives at other railroad terminals, containers have to be drayed back to the CenterPoint facility. The Chicago logistics market is so large that smaller municipalities within the metropolitan area compete with each other for customers. Local government supports development initiatives by providing tax incentives, such as lower tax rates for “urban blight” areas, or they quickly re-zone roadways to accommodate over-weight truck loads, or re-direct roadways to facilitate the flow of freight traffic between key logistics hubs and highways. Cooperative government is a key consideration when selecting a logistics hub, after transportation cost and service requirements are met. 87 | TranSystems
  • 92.
    Translinked Freight Study Comparative Location Analysis 6.4 Regional Comparison Summary The Translinked region faces steep competition as a Midwest regional logistics hub. Table 6-8 presents a comparison of key transportation hub considerations for Detroit (representing the Translinked area), Columbus and Chicago. Detroit has distribution advantages if Ontario, Canada is included as part of a DC service area. Columbus offers the largest population coverage within a 10-hour truck drive, and the lowest transportation cost, labor rates, and industrial real estate lease rates. Chicago has the edge for railroad, or air cargo service availability. Chicago also has the highest Midwest market distribution reach. Table 6-8: Detroit, Chicago and Columbus Summary Table Detroit, MI Columbus, OH Chicago, IL Rail Access Railroads CSX, NS, CN, CP CSX, NS CSX, NS, UP, BNSF, CP, CN CSX US East, Midwest, main CSX: US East, Midwest, main Western States Access CSX US East, Midwest, main Western States Access NS East, Midwest access Western States Access NS: East, Midwest access UP and BNSF, States west of the Service Area NS East, Midwest access Western States and Canadian Mississippi CN, CP Canada Rail Markets, US cargo connects to railroads CN, Canada Rail Markets, US Central Plain States, Gulf serving those areas, i.e. UP, BNSF, Central Plain States, Gulf CP, and CN. CP, Canada Rail Markets, US Northeast, US Midwest US-69 to Blue Water Bridge to I-70 and I 80 to the north provide I-94 and I 57 provide north/south CA-402,US 75, US 375CA-401 via east/west access, I 71 and I 75 to Highway Access access, I 80 east/west, and I 90 Ambassador Bridge, US-96, US- the west provide north/south northwest access 94, US-275 (to US-80), access Distribution Facilities Population Reach (10 hour truck 88.2 million 118.4 million 83.9 million radius, US and Canada) Total Warehouse Space (sq. ft.) 366.8 – 524.0 million 205.9 – 213.8 million 1.0 – 1.3 Billion Vacancy Rate 13.5% - 14.9% 11.5% - 13.7% 9.3% – 11.3% Average Lease Rate ($/sq. ft./yr) * $3.87 – $3.91 $2.70 – $3.32 $3.90 - $4.39 Transportation and Materials Moving Occupation Wage $17.24 $14.85 $16.46 (Hourly) Fastest Ocean Gateways Halifax, Prince Rupert Norfolk, New York West Coast (Asia origin cargoes) Airport U.S. Rank 27th 54th 5th Total Cargo (metric tons) 193,344 69,748 1,376,552 Ontario, Canada, Michigan US Midwest, Northeast, Mid Distribution Area Target US Midwest Peninsula, OH, IN, WI, IL Atlantic * Asking lease rate for Warehouse and Distribution Use Facilities > 10,000 sq. ft Source: TranSystems, CB Richard Ellis, Grubb and Ellis, Colliers, US Bureau of Labor Statistics, Airport Council International – North America, and Railroad websites 88 | TranSystems