Downloaded 34 times

![RecentAttempts atVizrec Systems
• Tableau Elastic
• Voyager
• Harvest
• Profiler
• Our systems
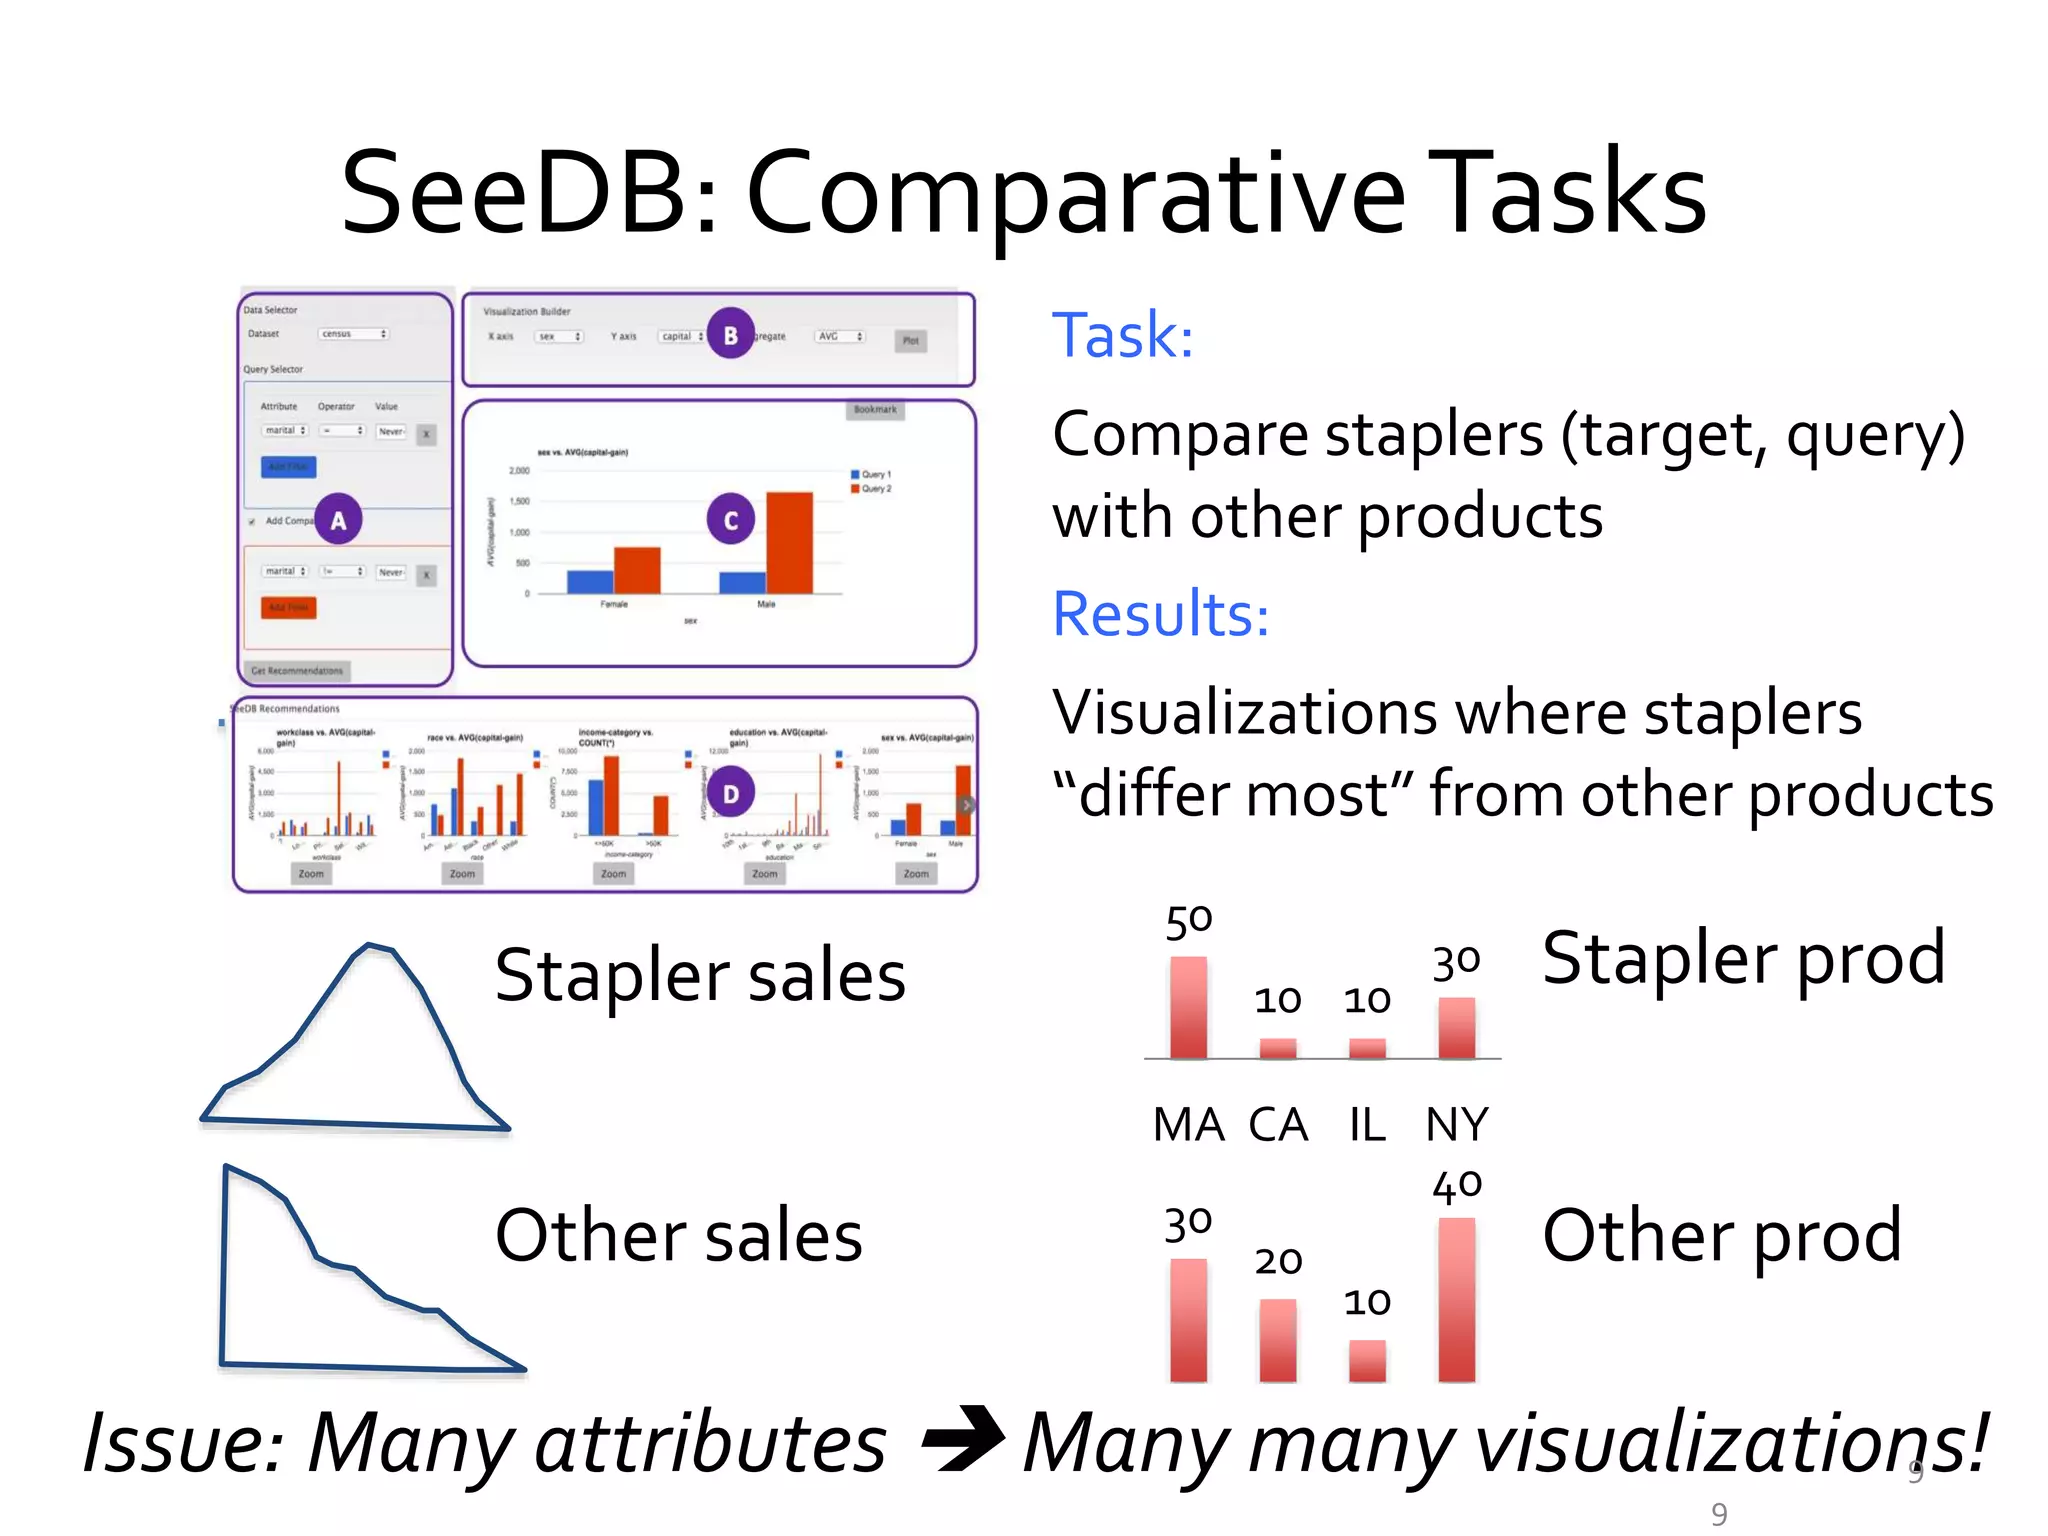
– SeeDB [VLDB 14 x 2,VLDB 16]
– zenvisage [unpublished]
This conference!
8
Still early days!](https://image.slidesharecdn.com/2015octdsia-short-talk-151026200520-lva1-app6891/75/Towards-Visualization-Recommendation-Systems-8-2048.jpg)
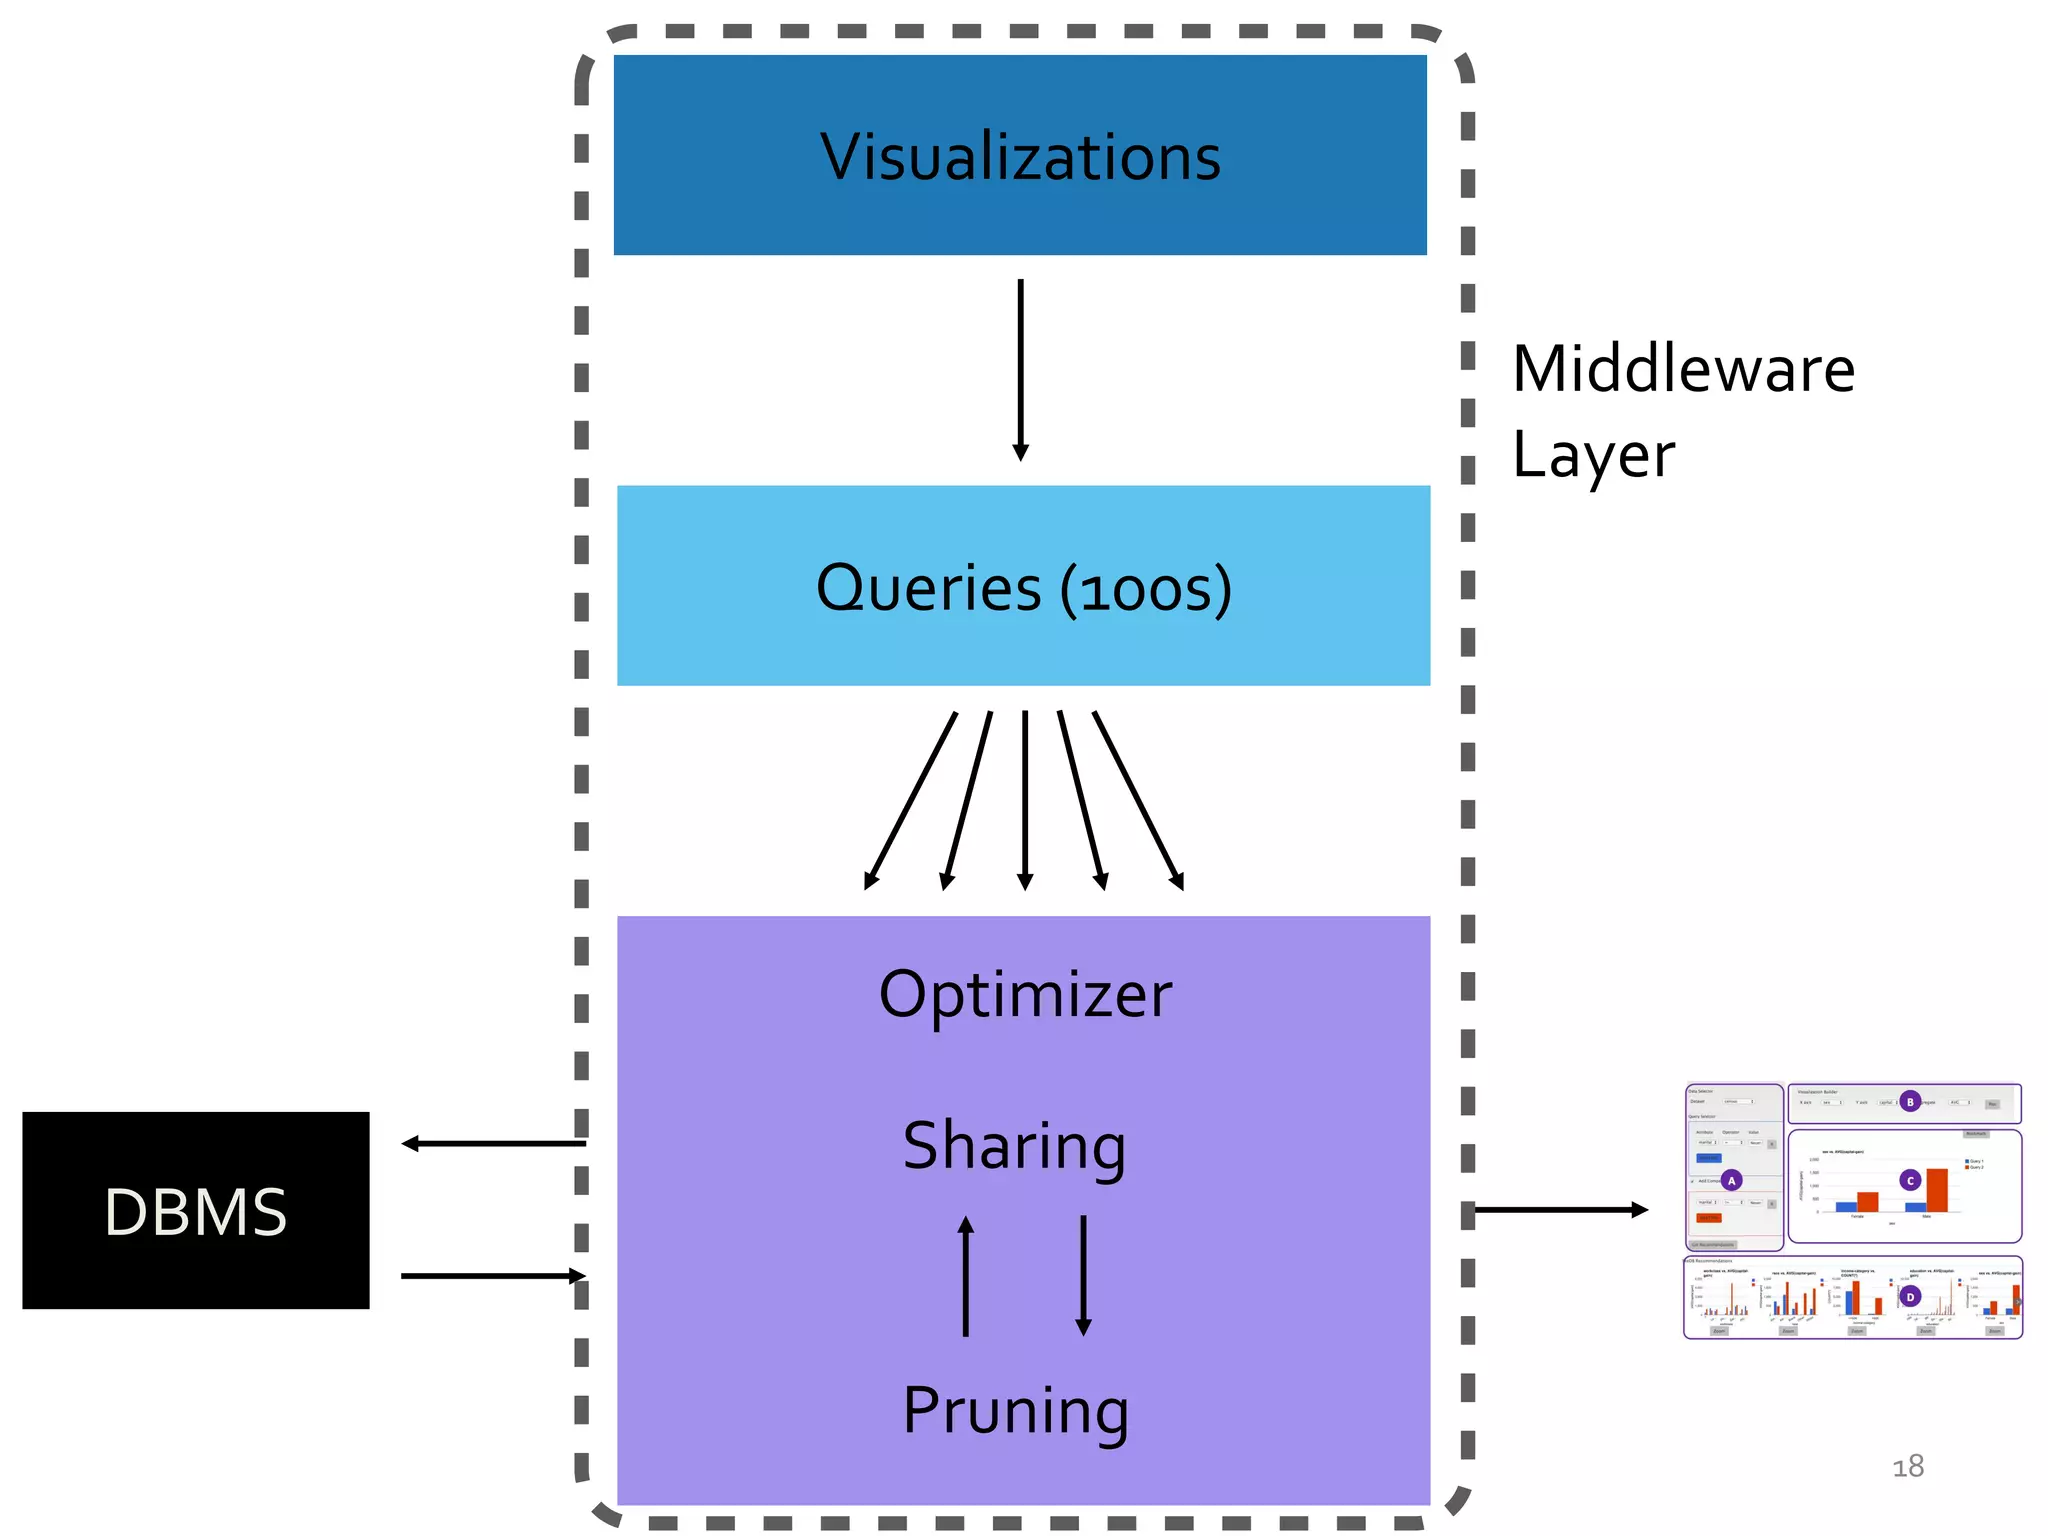
![Architectural Considerations
• Pre-computation
• Online computation
–Sharing
–Parallelism
–Pruning
–Approximations [VLDB’15]
12data-people.cs.illinois.edu/papers/dsia.pdf](https://image.slidesharecdn.com/2015octdsia-short-talk-151026200520-lva1-app6891/75/Towards-Visualization-Recommendation-Systems-12-2048.jpg)
![Ongoing Projects in Interactive Analytics
Minimizing effort & maximizing efficiency
http://data-people.cs.illinois.edu
• Data Manipulation [VLDB’15 x 2]
• DataVisualization [VLDB’14 x 2,VLDB ’15,VLDB ‘16]
• Data Collaboration [VLDB ’15 x 2, CIDR ’15,TAPP ’15]
• Data Processing with [VLDB ’15, HCOMP ’15, KDD ‘15]
datahub
14
Recent Papers, Demos
POPULACE](https://image.slidesharecdn.com/2015octdsia-short-talk-151026200520-lva1-app6891/75/Towards-Visualization-Recommendation-Systems-14-2048.jpg)

![ResearchThrust II: Crowds
Minimizing cost and maximizing accuracy in
human-powered data management
Data Processing
Algorithms
Auxiliary Plugins:
Quality, Pricing
Data Processing
Systems
Filter [SIGMOD12,VLDB14] Max [SIGMOD12]
Clean [KDD12,TKDD13] Categorize [VLDB11]
Search [ICDE14] Debug [NIPS12] Count [HCOMP15]
Deco [CIKM12, VLDB12, TR12, SIGMOD Record 12]
DataSift [HCOMP13, SIGMOD14] HQuery [CIDR11]
Conf [KDD13, ICDE15] Evict [TR12] Debias [KDD15]
Pricing[VLDB15] Quality [HCOMP14]
16](https://image.slidesharecdn.com/2015octdsia-short-talk-151026200520-lva1-app6891/75/Towards-Visualization-Recommendation-Systems-16-2048.jpg)

![II. Users Prefer SeeDB
100% users prefer SeeDB over Manual
“. . . quickly deciding what correlations are relevant” and
“[analyze] . . . a new dataset quickly”
“. . . great tool for proposing a set of initial queries for a
dataset”
“. . . potential downside may be that it made me lazy so I
didn’t bother thinking as much about what I really could study
or be interested in”](https://image.slidesharecdn.com/2015octdsia-short-talk-151026200520-lva1-app6891/75/Towards-Visualization-Recommendation-Systems-22-2048.jpg)


The document discusses the development of visualization recommendation systems aimed at automating the process of suggesting visualizations based on patterns in large datasets. It highlights the challenges faced in current tools, such as poor context comprehension and limited user preference understanding, while also referencing ongoing projects and research efforts in the field. The emphasis is on moving towards effective systems that enhance data analysis and user experience in interactive analytics.


![[BDD 2025 - Mobile Development] Exploring Apple’s On-Device FoundationModels](https://cdn.slidesharecdn.com/ss_thumbnails/md-exploringappleson-devicefoundationmodels-251124030840-d690542c-thumbnail.jpg?width=640&height=640&fit=bounds)


![[BDD 2025 - Full-Stack Development] Digital Accessibility: Why Developers nee...](https://cdn.slidesharecdn.com/ss_thumbnails/fs-digitalaccessibilitywhydevelopersneedtoknowandcarein2025-251127011019-0674441d-thumbnail.jpg?width=640&height=640&fit=bounds)


![[BDD 2025 - Artificial Intelligence] AI for the Underdogs: Innovation for Sma...](https://cdn.slidesharecdn.com/ss_thumbnails/ai-aifortheunderdogsinnovationforsmallbusinesses-251124030839-72a599a4-thumbnail.jpg?width=640&height=640&fit=bounds)

![Support, Monitoring, Continuous Improvement & Scaling Agentic Automation [3/3]](https://cdn.slidesharecdn.com/ss_thumbnails/agenticcommunityseries-day3-cfd-251120170304-ddef8112-thumbnail.jpg?width=640&height=640&fit=bounds)